
Evaluation of Exclusive Data Allocation Between
SSD Tier and SSD Cache in Storage Systems
Shinichi Hayashi
1,2
and Norihisa Komoda
2
1
Yokohama Research Laboratory, Hitachi, Ltd., Kanagawa, Japan
2
Graduate School of Information Science and Technologies, Osaka University, Osaka, Japan
Keywords: Exclusive Data Allocation, Tiered Storage, Tier, Cache, Response Time, SSD.
Abstract: We propose an exclusive data allocation method and evaluate the storage I/O response time with this
method between a solid state drive (SSD) for a tiered volume and an SSD for cache in a storage system that
uses both an SSD and hard disk drive (HDD). With the proposed method, the SSD cache function with
exclusive data allocation caches only data allocated on the HDD tier. This enables more data to be allocated
on the SSD, which reduces storage I/O response time. The simulation results show that the proposed method
reduces the storage I/O response time in high I/O locality workload or low I/O locality workload with large
SSD capacity. It also reduces the storage I/O response time by up to 23% compared to a combination of
SSD/HDD volume tiering and SSD cache methods with no exclusive data allocation.
1 INTRODUCTION
With recent improvements in information
technology, the amount of data retained by
companies has increased exponentially. The capacity
of hard disk drives (HDDs) has continued to
increase; however, the performance of these devices
has not improved significantly. Therefore, HDDs
can potentially become bottlenecks. Solid state
drives (SSDs), which are much faster than HDDs,
are currently attracting attention. When HDDs
become bottlenecks, replacing them with SSDs
could increase performance. Because SSDs are
generally more expensive, it is important to store
frequently accessed areas on an SSD and rarely
accessed areas on an HDD.
The following three methods are used for storage
systems having both an SSD and HDD.
(1) Method for dividing and locating data onto the
SSD or HDD
(2) Method for locating all data onto the HDD and
copying partial data onto the SSD
(3) Combination of these two methods
We call the first method, SSD/HDD volume tiering,
the second method, SSD cache, and the third method,
combination.
Only frequently accessed areas are stored on the
SSD with the volume tiering method. On the other
hand, the area that was accessed one time is
immediately copied to the SSD with the SSD cache
method. With the combination method, the SSD is
divided into two areas. One is used for the SSD
tiered volume and the other for the SSD cache. The
volume tiering and SSD cache methods have been
evaluated (Strunk, 2012; Chen et al., 2011; Faibish
et al., 2010), as well as the combination method
(Hayashi and Komoda, 2013).
When using the combination method, data stored
on the SSD for the tiered volume is copied to the
SSD cache. The performance of access to the data
allocated on the SSD is already high; therefore, the
response time is not further reduced.
We propose an exclusive data allocation method
with which only the data allocated on the HDD are
placed onto the SSD cache and the data allocated on
the SSD for the tiered volume are not placed onto
the SSD cache. We assume that the effectiveness of
the proposed method may differ on the basis of SSD
capacity and I/O characteristics such as the number
of I/Os, read-write ratio, and I/O locality. Therefore,
we evaluate the proposed method assuming multiple
situations through I/O simulation and clarify
conditions under which the proposed method is
effective.
The paper is structured as follows. In Chapter 2,
we present an overview of the target storage system
and how to leverage an SSD. In Chapter 3, we
144
Hayashi S. and Komoda N..
Evaluation of Exclusive Data Allocation Between SSD Tier and SSD Cache in Storage Systems.
DOI: 10.5220/0004867801440151
In Proceedings of the 16th International Conference on Enterprise Information Systems (ICEIS-2014), pages 144-151
ISBN: 978-989-758-027-7
Copyright
c
2014 SCITEPRESS (Science and Technology Publications, Lda.)
discuss our proposed method. We explain the
simulation conditions for evaluating the propose
method in Chapter 4 and the simulation results and
present discussions in Chapter 5. In Chapter 6, we
give concluding remarks and give a brief outline for
future work.
2 SSD/HDD VOLUME TIERING
AND SSD CACHE METHODS
In this chapter, we give an overview of the target
storage system that uses an SSD and HDD, discuss
how to leverage an SSD to improve storage I/O
performance, and explain related work.
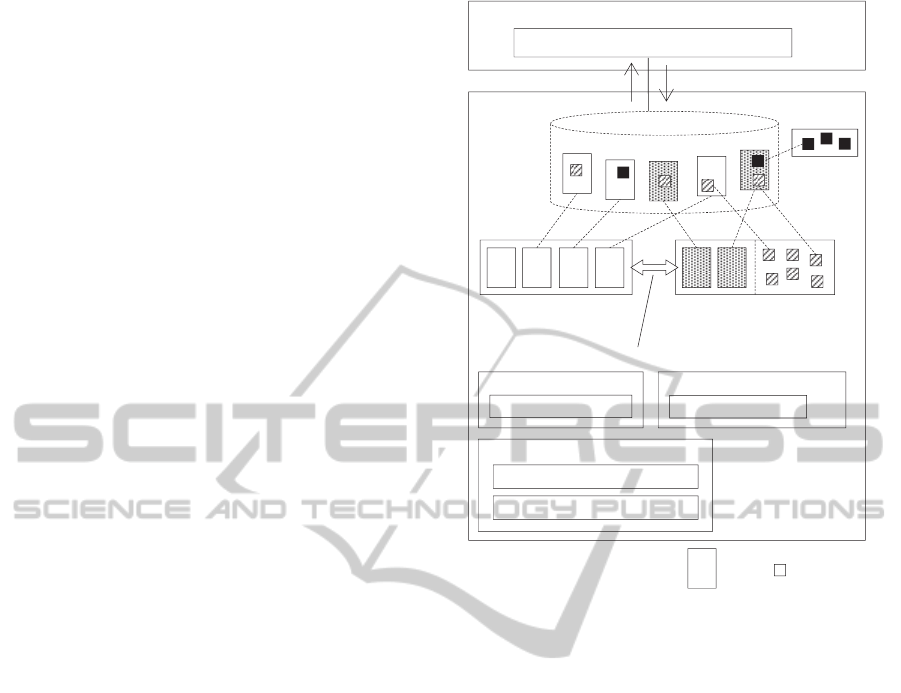
2.1 Overview of Storage System
Figure 1 gives an overview of the target storage
system we use. The storage system consists of
virtual tiered volumes, volume tiering function,
dynamic random access memory (DRAM) cache
function, SSD cache function, DRAM, SSD, and
HDD. The virtual tiered volumes are controlled by
the volume tiering function and accessed from
servers. The virtual tiered volumes consist of areas
called pages. The SSD for the tiered volume, as an
SSD tier, or the HDD for the tiered volume, as an
HDD tier, are assigned to each page.
A storage system using several tiers that have
different response times is referred to as a tiered
storage system. The volume tiering function
manages the mapping information and reads from
the SSD or HDD tier or writes to the SSD or HDD
tier on the basis of access from applications on
servers to the virtual tiered volumes. All data on the
virtual tiered volumes should be thus allocated to the
SSD or HDD tier.
2.2 SSD/HDD Volume Tiering Method
The volume tiering method is designed to reduce I/O
response time by allocating the SSD to frequently
accessed page. The tier control function measures
the number of I/Os (
) in page for a certain
period, which is defined as an I/O measurement
period ( [hours]), ranks the pages in order of the
number of I/Os ( 1
), and determines
of page on the basis of Formula (1),
where 1 denotes the SSD tier, 2 denotes the HDD
tier, denotes the number of pages in the storage
system, and denotes the rate of the SSD tier
capacity to the HDD tier capacity (SSD tier capacity
rate).
Figure 1: Overview of SSD/HDD volume tiering and SSD
cache methods.
1
2
(1)
Following tier determination, when
is
different from the current tier (
), a page
migration function migrates the data from
to
. We call this process data migration
between tiers. Since the SSD tier is more expensive,
all areas of this tier are allocated to pages. The
volume tiering function measures I/Os then
determines the page tier, and the page migration
function controls the migration between tiers.
2.3 SSD Cache Method
The SSD cache function stores accessed data to the
SSD, which has short response time media to
accelerate the subsequent I/Os. The SSD cache
function caches the data with a smaller unit called a
segment.
When the storage system receives a read request
from the server, the SSD cache function refers to an
SSD cache table to determine whether requested
data are on the SSD. If the data exist on the SSD, it
reads the data from the SSD and sends a result to the
server. Otherwise, it sends the read request to the
Storage
Server
SSD for Tiered
Volume
(SSD Tier)
Application
Virtual
Tiered
Volume
HDD for Tiered
Volume (HDD Tier)
DRAM
fo
r
Cache
Page
Segment
Read
Write
Page Migration between Tiers
SSD/HDD Volume Tiering Function
DRAM Cache Function SSD Cache Function
DRAM Cache Table
SSD Cache Table
Tier Ma
pp
in
g
Information
Pa
g
e Mi
g
ration Function
SSD for
Cache
(SSD Cache)
EvaluationofExclusiveDataAllocationBetweenSSDTierandSSDCacheinStorageSystems
145

SSD or HDD tier then sends a result to the server
and stores the data onto the SSD. If there is no free
space on the SSD to cache the data, the SSD cache
function purges some data. Several algorithms, such
as least recently used (LRU), have been proposed to
determine which data are to be purged from the
SSD. We define an SSD cache hit as requested data
existing on the SSD when the SSD cache function
receives a request from the server. We also define an
SSD cache miss as requested data not existing on the
SSD.
When the storage system receives a write request
from the server, the SSD cache function stores the
data into a free space on the SSD and sends the
completion of the write command to the server. If
there is no free space on the SSD, the SSD cache
function purges some data from the SSD before the
process. The SSD cache function records a state in
which the data are not yet written onto the SSD or
HDD tier. When the SSD cache function purges
from the SSD, it writes the cached data onto the SSD
or HDD tier. Since the storage system has
redundancy for data protection, we discuss the write-
back cache.
2.4 Combination of SSD/HDD Volume
Tiering and SSD Cache Methods
The volume tiering and SSD cache functions can be
combined (Chen et al., 2011; Hayashi and Komoda,
2013). We call these combined functions the
combination method. In this case, the SSD cache
function resides between the DRAM cache and
volume tiering functions. The DRAM cache function
receives and processes I/Os from the server. It
transfers the I/O in case of DRAM cache miss or
purge from the DRAM cache to the SSD cache
function. The SSD cache function processes the I/Os
and transfers I/Os to the volume tiering function in
case of SSD cache miss and purges from the SSD
cache.
2.5 Related Work
Hystor (Chen et al., 2011) is an implementation of
the combination method. It has two SSD areas, one
is used to cache the frequently accessed area within
a certain period and the other is used as a write-back
cache.
Hayashi and Komoda (2013) evaluated the
volume tiering, SSD cache, and combination
methods through I/O simulation. They showed the
appropriate capacity rate of SSD for the tiered
volume and cache differs on the basis of I/O
characteristics such as I/O locality and read-write
ratio.
3 EXCLUSIVE DATA
ALLOCATION METHOD
To reduce storage I/O response time by using
limited SSD capacity, it is necessary to allocate
many frequently accessed areas to the SSD. When
using the combination, volume tiering, and the SSD
cache method, the data stored in the SSD tier are
copied to the SSD cache. The performance of access
to the data allocated to the SSD is already high;
therefore, the response time is not further reduced.
Since the SSD cache is limited in capacity, there is a
high possibility that data allocated on the HDD tier
will be purged from the SSD cache. As a result, the
response time will increase.
We propose a method with which only the data
allocated on the HDD tier are allocated to the SSD
cache and the data allocated on the SSD tier are not
allocated to the SSD cache. We call this method
exclusive data allocation between the SSD for tiered
volume and the SSD for cache. Figure 2 gives an
overview of the proposed method. The proposed
method uses the SSD cache function with exclusive
data allocation as a substitute for the SSD cache
function explained in Chapter 2. We now explain the
SSD cache function with exclusive data allocation.
The SSD cache function with exclusive data
allocation refers the tier mapping information and
determines on which tier the I/O destination area is
located. When the I/O goes to the SSD tier, it
transfers the I/O to the volume tiering function.
When the I/O goes to the HDD tier, cache control is
done in the same manner as with the SSD cache
function discussed in Section 2.3. However, the
method for determining the segment that purges the
data from the SSD cache is different from the SSD
cache function with no exclusive data allocation.
When data are purged, it confirms the tier where
cached data are stored and purges data on the SSD
tier on a priority basis. This prevents the increase in
temporary workload to purge cached data. Therefore,
there is no need to purge the data at a time allocated
on the HDD tier and migrated to the SSD tier when
migrating pages on the HDD tier to the SSD tier.
The proposed method allows only the data allocated
on the HDD tier to be placed on the SSD cache. This
enables more data to be allocated on the SSD, which
leads to short storage I/O response time.
ICEIS2014-16thInternationalConferenceonEnterpriseInformationSystems
146
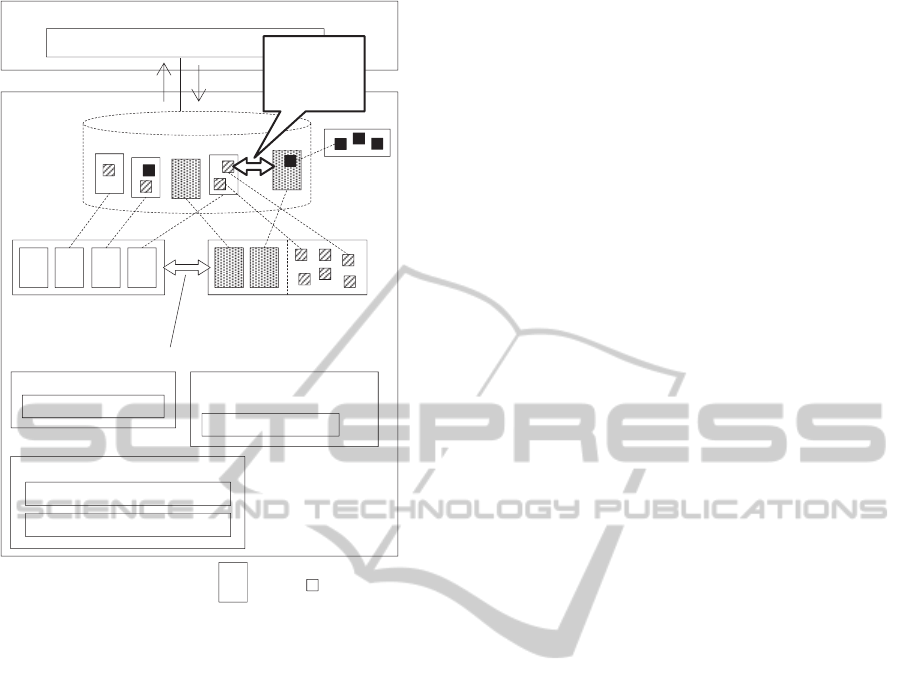
Figure 2: Overview of proposed method.
4 EVALUATION
We evaluate the proposed method through I/O
simulation. This chapter describes the evaluation
items, simulator, and simulation conditions.
4.1 Evaluation Items
The volume tiering and SSD cache methods have
different advantages, which depend on I/O
characteristics such as the number of I/Os, read and
write ratio, and I/O locality. We evaluate the effects
of these two methods by simulating I/Os using I/O
trace logs captured in a real production environment.
These two methods can be applied simultaneously.
We also evaluate these effects by adjusting the SSD
capacity for a tiered volume or cache as a parameter.
Information systems must provide performance
regulated by the service level agreement (SLA) to
information system users. The SLA regulates what
the system response time should be, for example,
within 300 milliseconds for 99.9% of its requests
(DeCandia et al., 2007; Cooper et al., 2008). An
information system provider sets the service level
objective (SLO) to meet the SLA. If the system
response time is regulated by the SLA, the provider
regulates the storage I/O response time by the SLO;
thus, we consider the storage I/O response time as
storage I/O performance by simulating I/Os.
4.2 Simulator
We developed a simulator using Perl language to
compute storage I/O response time. It simulates a
DRAM cache process, SSD cache process, and the
data migration between the SSD and HDD tiers.
Figure 3 shows the simulation model, which
simulates I/Os on the basis of the I/O trace logs. An
I/O trace log includes I/O time stamps, I/O address,
I/O size, and I/O type (read or write). The SSD and
HDD have their own queue, and their response times
depend on the I/O type.
On the basis of the I/O trace log, the DRAM
cache function handles the DRAM cache process.
The DRAM cache is a write-back cache. Cached
data in DRAM are managed using the fully
associative method, and the LRU algorithm is used
for data replacement. In case of a DRAM cache hit,
the DRAM cache function accesses the DRAM and
the simulator records the response time. In case of a
DRAM cache miss, the I/O is sent to the SSD cache
function.
Explanation of the SSD cache function is given
in Section 2.3. The SSD cache is a write-back cache.
Cached data in the SSD are managed using a fully
associative method, and the LRU algorithm is used
for data replacement. In the case of a SSD cache hit,
the SSD cache function identifies the device that
contains the data and enqueues the I/O. The
simulator then records the response time. In the case
of a SSD cache miss, the I/O is sent to the tier
function. The tier function then identifies the device
that contains the data on the basis of the page
mapping table and enqueues the I/O. The simulator
then records the response time.
The simulator also enqueues I/Os for purging the
unwritten data from the DRAM or SSD cache to the
SSD or HDD tier and I/Os for migration between the
tiers. We define the storage I/O response time from
when the storage system receives an I/O from the
server until when the storage system responds to the
result of the I/O to the server.
4.3 Simulation Conditions
Table 1 gives an overview of the I/O trace logs
(UMass Trace Repository, 2007) used in this
simulation. These I/O trace logs (Financial 1 and
Storage
Server
SSD for Tiered
Volume
(SSD Tier)
Application
Virtual
Tiered
Volume
HDD for Tiered
Volume (HDD Tier)
DRAM
fo
r
Cache
Page
Segment
Read
Write
Page Migration between Tiers
Exclusive
Data
Allocation
SSD/HDD Volume Tiering Function
DRAM Cache Function
SSD Cache Function with
Exclusive Data Allocation
DRAM Cache Table
SSD Cache Table
Tier Ma
pp
in
g
Information
Pa
g
e Mi
g
ration Function
SSD for
Cache
(SSD Cache)
EvaluationofExclusiveDataAllocationBetweenSSDTierandSSDCacheinStorageSystems
147
Figure 3: Simulation model.
Financial 2) are from online transaction processing
(OLTP) applications running at two large financial
institutions. Financial 1 contains a number of write
requests and Financial 2 contains a number of read
requests.
Figure 4 shows the distribution of the I/O trace
logs. In Financial 1, for example, 57% of I/Os to
total I/Os concentrate on 20% areas to total areas. In
Financial 2, 84% of I/Os to total I/Os concentrate on
20% areas to total areas. Figure 3 indicates that
Financial 2 has higher locality than Financial 1. To
simulate a write-intensive workload with high
locality and a read-intensive workload with low
locality, we also simulate a condition in which read
requests are swapped for write requests.
We measured the DRAM, SSD, and HDD
response times in a Linux environment and use the
Figure 4: I/O distribution of I/O trace logs.
Table 1: Overview of I/O trace logs.
Name Financial 1 Financial 2
IOPS 825 431
Read Rate 15.4% 78.5%
Average I/O Size 16.1 KB 18.8 KB
Volume Capacity 8.4 GB 8.4 GB
Record Period
12 hours
8 minutes
11 hours
23 minutes
Table 2: Number of devices and loads in simulation.
SSD Rate [%] # of SSDs # of HDDs Total
10 136 1,360 1,496
20 248 1,240 1,488
30 342 1,140 1,482
measured values as the response time of each device.
Table 2 lists the number of devices and loads in
the simulation. We define the rate of the number of
SSDs to that of HDDs as the SSD rate. We adjust
the SSD rate to 10%, 20%, and 30%. The numbers
of SSDs and HDDs are listed in Table 2. The
maximum number of devices in this simulation is
1,500 on the basis of the maximum number of
devices (Hitachi Data Systems Corporation, 2013).
To protect the data, two devices configured to a
RAID 1, and one I/O trace log is simulated per HDD
RAID group. When the number of HDDs is 100, for
example, 50 I/O trace logs are simulated to each
RAID group simultaneously. We define the SSD
cache rate as that of the number of SSDs for the SSD
cache method to the total number of SSDs. The
other SSDs are controlled using the volume tiering
method. In this simulation, we adjust the SSD cache
rate from 20% to 80% in increments of 20%.
The page size is 10 or 100 MB with the volume
tiering method and the segment size is 8 KB with the
SSD cache method. The I/O measurement period is
1 hour. Because data migration between tiers affects
the I/O response time, the page migration function
takes a data migration interval between tiers. It sets
the transfer rate of migration between tiers to the
HDD maximum transfer rate to 10% instead of
migrating target pages in sequence.
5 RESULTS AND DISCUSSION
We discuss the simulation results under the
simulation conditions explained in the previous
chapter.
0%
20%
40%
60%
80%
100%
0% 20% 40% 60% 80% 100%
I/ORate
CapacityRate
Financial1 Financial2
57%
84%
Storage
Server
Application (I/O Trace Log)
DRAM
Queue
Read
Write
DRAM Cache Function
SSD Cache Function with or without
Exclusive Data Allocation
SSD/HDD Volume Tiering Function
DRAM Cache Table
SSD Cache Table
Page Mapping Table
HDD for Tier
SSD for Tier & Cache
RAID Groups
HDD
HDD
RAID Groups
SSD
SSD
ICEIS2014-16thInternationalConferenceonEnterpriseInformationSystems
148
5.1 Simulation Results of Each
I/O Trace Log
Figures 5 to 8 show storage I/O average response
time under each condition when the page size is 10
MB. The vertical axis indicates normalized storage
I/O average response time, which is set to 100%
when the SSD and SSD cache capacity rates were
10% and 100%, respectively. The horizontal axis is
the SSD cache capacity. The terms F1 and F2 denote
the simulation conditions in Financial 1 and
Financial 2, respectively, and “rw” denotes the
condition under which read requests are swapped for
write requests. The percentages are the SSD rates.
“F1-10%”, for example, means the I/O trace log is
Financial 1 with a 10% SSD rate, “F2-rw-30%”
means the I/O trace log is Financial 2 under the
condition that read and write are interchanged with a
30% SSD rate. “Existing” and “Proposed” in Figures
5 to 9 mean application of the combination method
and the proposed method, respectively. When the
SSD cache capacity rate is 0%, the volume tiering
method is applied, when it is 20% to 80%, the
combination method is applied, and when it is
100%, the SSD cache method is applied.
We now explain the simulation results under the
F1 condition. The shortest storage I/O average
response time with a 10% or 20% SSD rate is when
the proposed method is applied. With a 30% SSD
rate, applying the combination method shortens the
storage I/O average response time.
The proposed method reduces the average
storage I/O response time compared to the
combination methods when the SSD cache capacity
rate is low. When applying the combination method
with low I/O locality and low SSD cache capacity
rates, data are purged with high frequency. There is
a high possibility that once-accessed data on the
HDD tier will be purged from the cache without
secondary access. In this case, the response time
does not decrease when the second access to the data
because it becomes a cache miss. On the other hand,
when applying the proposed method, it is believed
that data are rarely purged, since the frequently
accessed area is arranged on the SSD tier, and
cached data purging does not occur when accessing
the area. The proposed method, therefore, provides
shorter response time when the SSD cache capacity
rate is low.
The combination method shortens the storage I/O
average response time compared to the proposed
method when the SSD and SSD cache capacity rate
are high. The data that have high I/O frequency is
allocated on both the SSD tier and SSD cache. This
Figure 5: Simulation results under F1 condition.
does not lead to long response time since high I/O
frequency data remain allocated on the SSD cache
even if the page allocated on the SSD tier is
migrated to the HDD tier. On the other hand,
because data on SSD tier are not allocated on the
SSD cache when applying the proposed method, the
response time becomes long when this page is
migrated to the HDD tier. The frequency of data
being purged becomes minimal when the SSD cache
capacity rate is higher. This indicates that the
combination method shortens the average storage
I/O average time when the SSD cache capacity rate
is higher under the F1 condition.
Next, we explain the simulation results under the
F1-rw condition. The shortest average storage I/O
response time is acquired when the volume tiering
method is applied under the condition of a 10% SSD
rate, when the proposed method is applied under a
20% SSD rate, and when the combination method is
applied under a 30% SSD rate. This F1-rw has low
I/O locality and read-intensive workload. It is
important to note that when the SSD rate is 10%, the
SSD should be used as a tier because SSD cache
miss occurs frequently. This was reported in a
previous study (Hayashi and Komoda, 2013).
No significant difference is observed when the
combination and proposed method are compared
with both 10% and 20% SSD rate. This is because
the SSD rate is low, I/O locality is low, and it is rare
that data are allocated on both the SSD tier and SSD
cache in the case of a large number of reads. When
the SSD rate is 30%, there is no significant
difference between the proposed and combination
methods. However, the SSD cache capacity rate is
different when the average storage I/O response time
is minimal with each method.
The following explains the simulation results
under the F2 condition. The shortest average storage
I/O response time is when the proposed method is
applied with a 10% or 30% SSD rate. With a 20%
SSD rate, applying the cache method shortens the
40%
50%
60%
70%
80%
90%
100%
0% 20% 40% 60% 80% 100%
AverageStorageI/OResponse
Time(Normalized)
SSDCacheCapacityRate
F1‐10%
Existing
F1‐10%
Proposed
F1‐20%
Existing
F1‐20%
Proposed
F1‐30%
Existing
F1‐30%
Proposed
EvaluationofExclusiveDataAllocationBetweenSSDTierandSSDCacheinStorageSystems
149
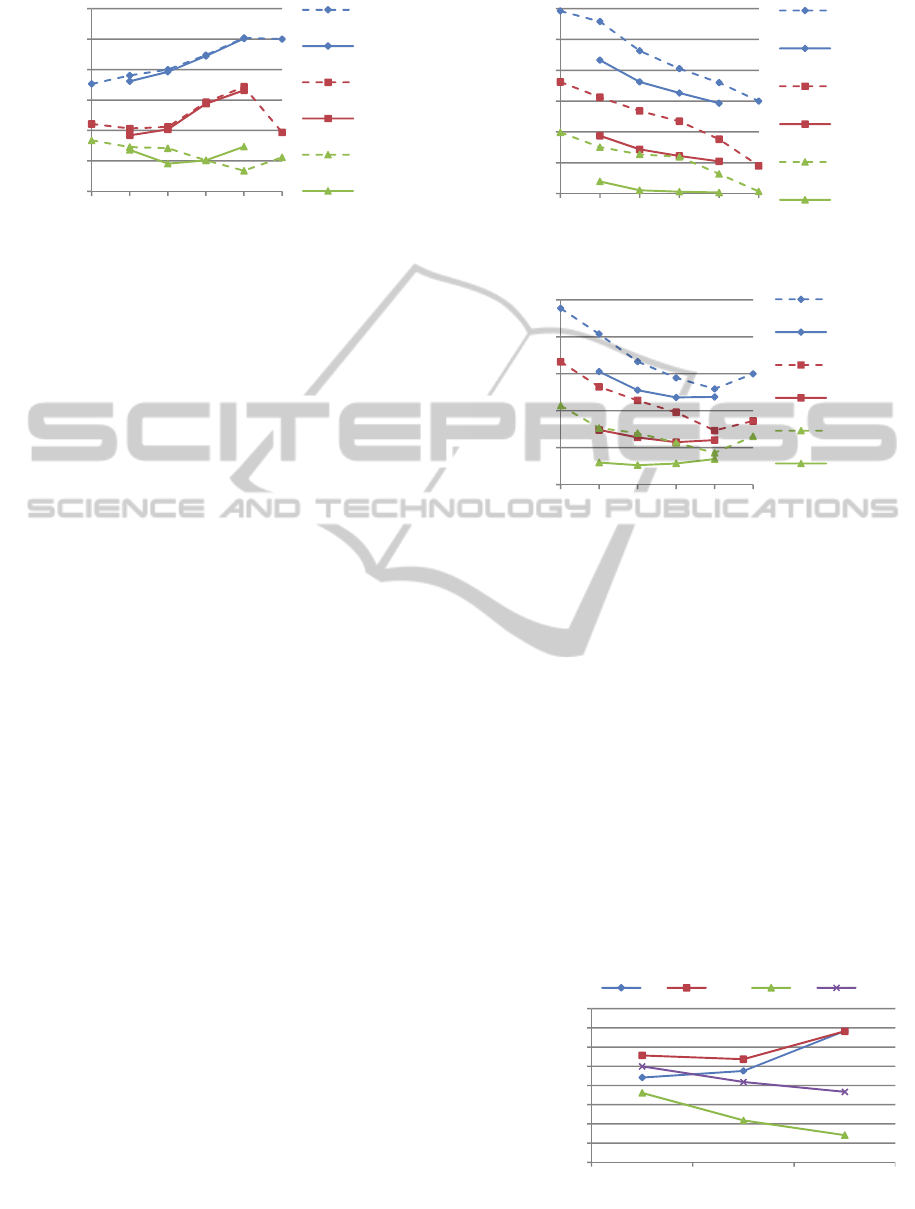
Figure 6: Simulation results under F1-rw condition.
average storage I/O response time. No significant
difference is observed between the proposed method
with 80% SSD cache rate and the SSD cache
method. When the proposed method and the
combination method are compared with each SSD
cache capacity rate, the proposed method produces
shorter average storage I/O response time under all
conditions. This result shows the advantage of the
proposed method since most areas stored on the SSD
tier are also allocated on the SSD cache with the
combination method.
Next, we explain the simulation results under the
F2-rw condition. Regardless of the number of SSDs,
the proposed method provides the shortest average
storage I/O response time. The proposed and
combination methods are compared with each SSD
cache capacity rate, and the proposed method
produces shorter average storage I/O response time
under all conditions.
5.2 Discussion of Simulation Results
Figure 9 compares the proposed and combination
methods when the page size is 10 MB. The vertical
axis indicates the average storage I/O response time
reduction rate with the proposed method where the
combination method is 100%. The horizontal axis
indicates the SSD rate. Regardless of the SSD and
SSD cache capacity rates, the proposed method
shortens the average storage I/O response time
compared to the combination method under F2 and
F2-rw conditions. There is a high possibility that the
data allocated on the SSD tier will also be allocated
on the SSD cache with high I/O locality workload.
Thus, the proposed method will shorten the average
storage I/O response time. The proposed method
provides better storage I/O performance compared
with the combination method except under low I/O
locality and large SSD capacity conditions.
Therefore, it is effective under high I/O locality
condition regardless of SSD capacity or low I/O
Figure 7: Simulation results under F2 condition.
Figure 8: Simulation results under F2-rw condition.
locality condition with small SSD capacity. It is the
most effective with F2 and a 30% SSD rate and
reduces the average storage I/O response time by up
to 23%. This condition has high I/O locality and
read-intensive workload with large SSD capacity.
The combination method provides the shortest
response time when the SSD rate is 30% under the
F1 and F1-rw conditions. This suggests that the
combination method is best suited to only low I/O
locality with large SSD capacity.
Figure 10 compares the proposed and
combination methods when the page size is 100 MB.
Although the page size is larger, the proposed
method also provides better storage I/O performance
compared with the combination method, except
under low I/O locality, write-intensive, and large
SSD capacity conditions.
Figure 9: Storage I/O response time reduction rate with
proposed method (page size = 10 MB).
50%
60%
70%
80%
90%
100%
110%
0% 20% 40% 60% 80% 100%
AverageStorageI/OResponse
Time
(Normalized)
SSDCacheCapacityRate
F1‐rw‐10%
Existing
F1‐rw‐10%
Proposed
F1‐rw‐20%
Existing
F1‐rw‐20%
Proposed
F1‐rw‐30%
Existing
F1‐rw‐30%
Proposed
40%
60%
80%
100%
120%
140%
160%
0% 20% 40% 60% 80% 100%
AverageStorageI/OResponse
Time(Normalized)
SSDCacheCapacityRate
F2‐10%
Existing
F2‐10%
Proposed
F2‐20%
Existing
F2‐20%
Proposed
F2‐30%
Existing
F2‐30%
Proposed
40%
60%
80%
100%
120%
140%
0% 20% 40% 60% 80% 100%
AverageStorageI/OResponse
Time(Normalized)
SSDCacheCapacityRate
F2‐rw‐10%
Existing
F2‐rw‐10%
Proposed
F2‐rw‐20%
Existing
F2‐rw‐20%
Proposed
F2‐rw‐30%
Existing
F2‐rw‐30%
Proposed
70%
75%
80%
85%
90%
95%
100%
105%
110%
10% 20% 30%
AverageStorageI/OResponse
TimeReductionRate
(Normalized,
CombinationMethod=100%)
SSDCapacityRate
F1 F1‐rw F2 F2‐rw
ICEIS2014-16thInternationalConferenceonEnterpriseInformationSystems
150
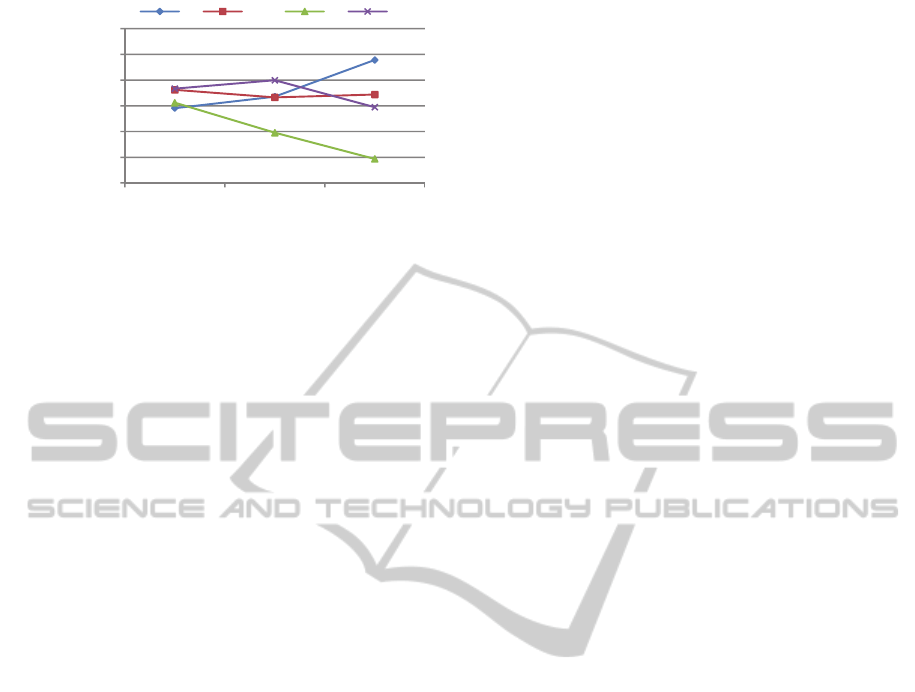
Figure 10: Storage I/O response time reduction rate with
proposed method (page size = 100 MB).
6 CONCLUSION AND FUTURE
WORK
We proposed an exclusive data allocation method
and evaluated the storage I/O response time with it
between an SSD for tiered volume and an SSD for
cache in a storage system using an SSD and HDD.
With the proposed method, the SSD cache function
with exclusive data allocation cache only data
allocated on the HDD tier. This enables more data to
be allocated on the SSD and leads to short storage
I/O response time. The simulation results suggest
that the proposed method reduces the storage I/O
response time in high I/O locality workload
regardless of SSD capacity or low I/O locality
workload with large SSD capacity. The proposed
method reduces the storage I/O response time by up
to 23% compared to the combination method
without exclusive data allocation.
Future work will be to (1) improve the proposed
method, (2) implement the proposed method with
different SSD cache algorithms, and (3) run several
workloads, for example, not only OLTP but also
online analytical processing (OLAP)) and other
benchmarks.
REFERENCES
Chen, F., Koufaty, D. A., and Zhang, X. (2011) Hystor:
Making the Best Use of Solid State Drives in High
Performance Storage Systems. In Proceedings of the
international conference on Supercomputing, pp. 22-
32.
Cooper, B. F., Ramakrishnan, R., Srivastava, U.,
Silberstein, A., Bohannon, P., Jacobsen, H., Puz, N.,
Weaver, D., and Yerneni, R. (2008) PNUTS: Yahoo!'s
hosted data serving platform. In Proceedings of the
VLDB Endowment, Vol. 1, No. 2, pp. 1277-1288.
DeCandia, G., Hastorun, D., Jampani, M., Kakulapati, G.,
Lakshman, A., Pilchin, A., Sivasubramanian, S.,
Vosshall, P., and Vogels, W. (2007) Dynamo:
Amazon's Highly Available Key-value Store. In
Proceedings of twenty-first ACM SIGOPS symposium
on Operating systems principles, Vol. 41, No. 6, pp.
205-220.
Faibish, S., Bixby, P., Forecast, J., Armangau, P., and
Pawar, S. (2010) A new Approach to File System
Cache Writeback of Application Data. In Proceedings
of the 3rd Annual Haifa Experimental Systems
Conference, Vol. 3.
Hayashi, S. and Komoda, N. (2013) Evaluation of SSD
Tier Method and SSD Cache Method in Tiered
Storage System. In Proceedings of the Second Asian
Conference on Information Systems, pp. 8-14.
Hitachi Data Systems. (2013) Hitachi Virtual Storage
Platform. http://www.hds.com/assets/pdf/hitachi-
datasheet-virtual-storage-platform.pdf.
Strunk, J. D. (2012) Hybrid Aggregates: Combining SSDs
and HDDs in a single storage pool. ACM SIGOPS
Operating Systems Review, Vol. 46, No. 3, pp. 50-56.
UMass Trace Repository. (2007) OLTP Application I/O.
http://traces.cs.umass.edu/index.php/Storage/Storage.
80%
85%
90%
95%
100%
105%
110%
10% 20% 30%
AverageStorageI/O
ResponseTimeReduction
Rate(Normalized,
CombinationMethod=100%)
SSDCapacityRate
F1 F1‐rw F2 F2‐rw
EvaluationofExclusiveDataAllocationBetweenSSDTierandSSDCacheinStorageSystems
151
