
Optimizing Micro Renewable Generation for Smart Cities by
Combining Solar and Geothermal Energy Potentials
A Case Study of the Hannover Region
Claudia Palmas
1
, Holger Jensen
2
, Christina von Haaren
1
and Robert Schöner
2
1
Department of Environmental Planning, Leibniz University of Hannover, Herrenhäuserstr. 2, Hannover, Germany
2
State Authority for Mining, Energy and Geology, Stilleweg 2, Hannover, Germany
Keywords: Micro Solar Energy Potential, Micro Geothermal Energy Potential, Smart Cities, Renewable Energies.
Abstract: In recent years there has been an increasing interest on small renewable energy production systems to
supply energy consumption of buildings. In Europe, cities face the challenge of combining energy
efficiency and sustainable urban development. This challenge is likely to have an impact on grid
infrastructures by implementing intelligent networks and storage facilities in order to secure energy supply.
This paper presents an approach for integrating solar and geothermal energy generation on the basis of a
spatially explicit assessment of potentials for both energy sources. The results should be applicable for
spatial planning. The case study area is the Hannover region. The results demonstrate that with data
available in blanked coverage in Lower Saxony the assessment of both renewables energy potentials could
be performed. The generated place based information meets the specific demands of regional as well as
municipal land use planning. It can be used for allocation and prioritisation of housing development with
micro-renewables and for proposing areas with the combination of both.
1 INTRODUCTION
Europe is facing the challenge to reach the so called
20/20/20 objective. This objective includes reducing
greenhouse gas emissions by at least 20% compared
to 1990, increasing the share of renewable energy
sources in final energy consumption to 20%; and
improving 20% energy efficiency (European
Commission, 2010). To this end a redefinition of
strategies may be necessary as several factors like
increasing of energy demand, fossil fuel energy
scarcity and high environmental impacts are
hampering target compliance. An important part of
such strategies could be to more efficiently activate
the potential of existing and new buildings for
producing their own energy. To that end we need
innovative strategies and approaches for integrating
energy concepts in regional and municipal land use
planning. In this context smart cities play a crucial
role. Countries in Europe are at different stages of
technological, political and administrative
development. However, in all cases the development
of smart cities depends significantly on smart grids,
intelligent grids to leverage energy consumption
between the different producers and consumers. The
successful combination of smart technologies can
help by improving energy efficiency and savings in
planning residential development and by adopting
measures for existing buildings. Smart technologies
need infrastructural changes of energy distribution
grids in an optimized way and are seen as a major
opportunity to merge energy and ICT industries and
technologies (Net!Works European Technology
Platform, 2011). Because of the intermittency
associated with the most renewable energy
production, it is necessary to combine renewable
energy technologies and to add some storage
mechanism in order to ensure the energy supply.
However, energy-saving measures in buildings are
either conventional (thermal insulation, energy-
efficient air conditioners and appliances) or based on
automatic intelligent systems (Wicaksono et al.,
2012). The deficits in practice correspond with
knowledge deficits about appropriate methods of
calculating energy potentials for supporting spatial
planning. In this context the micro renewable heat
potential, is especially important because it covers
the major part in urban energy consumption. The
common sources of micro renewable heat energy
production are solar thermal geothermal energy.
283
Palmas C., Jensen H., von Haaren C. and Schöner R..
Optimizing Micro Renewable Generation for Smart Cities by Combining Solar and Geothermal Energy Potentials - A Case Study of the Hannover
Region.
DOI: 10.5220/0004860602830288
In Proceedings of the 3rd International Conference on Smart Grids and Green IT Systems (SMARTGREENS-2014), pages 283-288
ISBN: 978-989-758-025-3
Copyright
c
2014 SCITEPRESS (Science and Technology Publications, Lda.)

Against this background, the objective of this
paper is to present an innovative planning approach
which according to energy potentials identifies the
best locations for combining solar and geothermal
energy. The approach is based on the research
conducted in the context of the Project Smart Nord
of Lower Saxony, where all renewable energy
sources (solar, wind, biomass, hydro and geothermal
energy) are taken into account. Here we focus on
solar and geothermal energy in order to lead the way
for activating the synergies of combining both
technologies. In this case, synergies may occur for
the following reasons (Tepe, 2011):
- Reduction of borehole depth or number of
boreholes in new systems
- Improvement of deficits existing systems to
achieve better performance.
The main research questions are:
How to estimate micro renewable energy
potentials? Which methods are needed?
How to combine solar and geothermal energy
systems?
For answering these questions we present in section
2 methods for estimating the geographical
distribution of the solar energy potential. In section 3
an application on geothermal energy developed by
the LBEG about is presented and integrated with
solar energy combinations. Finally we discuss data
availability and transferability to other regions as
well as possible planning application (section 4) and
conclude with recommendations for regional and
municipal planning (section 5).
2 METHODS
2.1 General Methodological Approach
To calculate the solar energy potential we have
estimated the global irradiation annual average for a
horizontal surface, which can be converted
according optimized angle for solar panels and solar
thermal collectors.
To calculate the geothermal energy potential we
have focused on typical shallow geothermal systems
for northern Europe. The energy abstraction is
achieved by vertical closed loop heat exchangers
with a vertical depth of around 100 m. The
subsurface model is a three layer model covering the
depth of ground surface to 100 m below surface. The
horizontal resolution is given by a 50 m by 50 m cell
size raster grid.
2.2 Data
In Table 1 datasets used for the calculation of solar
and geothermal energy potential maps for the
Hannover region, Lower Saxony, northern Germany
are shown:
Table 1.
Layer name Scale/unit Source
DEM (Digital
Elevation Model)
DGM50,
50 m raster
grid
Landesamt Bergbau
Energie und Geologie
Niedersachsen (LBEG)
http://nibis.lbeg.de/cardo
map3/
Water level in
unconsolidated rocks
in Lower Saxony
1:200000
only
applicable
for
unconsidated
rocks
LBEG (HUEK 200
“Grundwasser-
oberfläche”)
http://nibis.lbeg.de/cardo
map3/
Basal plane of
quaternary
unconsolidated rocks
in Hannover, Lower
Saxony
1:500000
edited by
detailed
point and
vector line
data
LBEG (GSKH 1:25000)
Rohde, P. & Becker-
Platen, J. D.
Geologische Stadtkarte
Hannover 1:25000
NLFB 1998
Geological map
1:500000 Lower
Saxony
1:200000
LBEG (GUEK 500)
http://nibis.lbeg.de/cardo
map3/
Geo-tectonic
Atlas 3D
Only
uppermost
layer from
the 3D model
was used
Bombien et al. (2012),
based on Baldschuhn et
al. (2001)
PK OG 2008
“Geothermal Data
Catalogue”
Thermal
conductivity
table of
typical rock
types in
Germany
http://www.infogeo.de/d
okumente/download_po
ol/PKOG_Abschlussberi
cht_1.3_08-04-25.pdf
2.3 Methodology for the Estimation of
the Micro Solar Energy Potential
The solar energy potential is calculated using the
r.sun solar radiation model implemented in GRASS
GIS (6.4.2) and the PVGIS CM-SAF estimation
utility, derived from the Photovoltaic Geographical
Information System Interactive Maps (Joint
Research Center of the European Commission,
2010). The r.sun model calculates the global solar
radiation (beam, diffuse and reflected), for both clear
sky and overcast atmospheric conditions from the
digital elevation model (DEM) (Šuri et al., 2007).
An important factor in producing reliable maps of
solar irradiation was the estimation of sky cloud
SMARTGREENS2014-3rdInternationalConferenceonSmartGridsandGreenITSystems
284

coverage, as the total amount of cloud cover
significantly affects ground irradiation. For this
reason, the data was validated using PVGIS. The
output of this model is a raster map of the global
irradiation annual average for a horizontal surface.
The PVGIS calculation of PV potential for a
specific site is based on spatial data automatically
taken from the PVGIS database. Generally, the
overall error for the whole year is quite small
(approximately 5%) (ibid.). The database is based on
climatic data from 566 meteorological stations
covering the 1981–1990 periods and includes
monthly averages of daily sums of global and
diffuse irradiation and Linke atmospheric turbidity.
Elevations and terrain features are represented by a
1-km digital elevation model. More details about the
European solar database implemented in the PVGIS
estimation utility can be found on its website (ibid.).
2.4 Methodology for the Estimation of
the Micro Geothermal Energy
Potential
All calculations were done in ArcGIS (ESRI)
version 10.0 and Microsoft Access 2007. Input data
as described in 3.2 are vector data (polygons) or
raster data (DEM). The raster layer was converted to
a point vector dataset. The data belonging to each
point consist of x,y-coordinates and the elevation.
Additional data from the polygon layers were
attached to the point layer. For the calculation of the
geothermal energy potential a three layer model was
used. The first layer consists of the distance from the
ground surface to the water table in the quaternary
porous rocks (dry unconsolidated rock). The second
layer consists of the thickness of the water saturated
porous quaternary rocks (saturated unconsolidated
rock). The third layer consists of the thickness and
type of the “hard rock” up to 100 m below ground
which were defined as the pre-quaternary rocks
(hard rock base).
Using the thickness and the thermal conductivity
for unsaturated and saturated unconsolidated rocks
as well as for each hard rock type an average
thermal conductivity up to 100 m could be computed
for each 50 m raster point. For the estimation of the
specific heat extraction values the transformation
from thermal conductivity to specific heat extraction
was performed following Pannike et al. (2006).
Here, the simplified geological stratification from
surface to 100 m depth is derived from the data
described above, and the specific heat extraction is
obtained from the following equation:
P
EWS
= -0,85 λ
2
+ 13,62 λ + 18,8
where P
EWS
= specific heat extraction capacity, and
λ = average heat conductivity of the rock.
The raster points were converted to a raster layer
with a cell size of 50 m. A continuous raster layer
set is the result, expressing the specific heat
extraction in each cell with 100 m heat exchangers.
For the solid rocks, there were some data
limitations due to the decreasing geological
information with the increasing depth. Therefore, the
rock type sometimes could only be estimated. The
data for unconsolidated rocks were taken from
geological maps on a scale of 1:25:000. The
information regarding the groundwater flow
component was not considered according to the VDI
4640 German directive.
2.5 Integration of the Energy Potentials
A first integration can be performed by an overlay of
the two energy potentials, because we assumed that
all the micro-energy potential maps are of the same
weight. The maps obtained show the best locations
for the integration of solar and geothermal energy
with vertical loops (40 m and 100 m).
3 RESULTS
3.1 Micro Solar Energy Potential Map
The latitude was computed directly from the DEM
raster, while the albedo and the Linke turbidity were
believed constant over the entire region, as a first
approximation. The clear sky indexes were not
available. After validation of the date, the output
raster map representing the annual average of global
irradiation daily sums estimated on optimally
inclined plane (Figure 1).
Figure 1: Annual average of daily sums of global
irradiation on optimally inclined plane [Wh/m
2
/d].
OptimizingMicroRenewableGenerationforSmartCitiesbyCombiningSolarandGeothermalEnergyPotentials-ACase
StudyoftheHannoverRegion
285
The output units are [Wh/m
2
/day].
3.2 Micro Geothermal Energy
Potential Maps
As an example, we present here the geothermal
energy potential for vertical loops (100 m) (see
Figure 2). We calculated for further residential
appliance the energy potential for vertical loops (40
m).
3.2.1 Geothermal Vertical Loops (100 M)
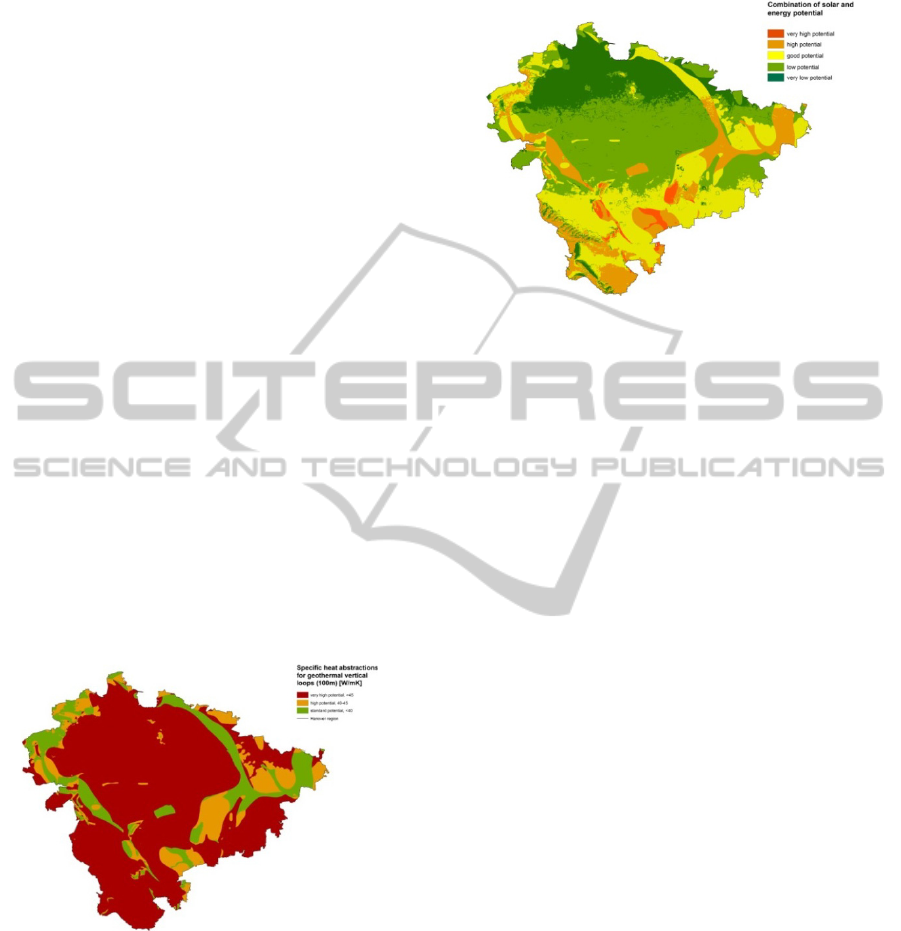
The evaluated specific heat extraction capacities,
which were calculated from thickness and thermal
conductivity of geological strata, has been used to
evaluate the geothermal energy potential for the
Hannover region. The resulting map was classified
into three categories. Class 1 represents very high
geothermal energy potential with average specific
heat abstraction values of > 45 W/mK, class 2
represents high geothermal energy potential with
average specific heat abstraction values of 40-
45 W/mK, and class 3 represents standard
geothermal energy potential with average specific
heat abstraction values of <40 W/mK. Areas not
suitable for geothermal energy use because of
drilling restriction reasons, e.g. drinking water
protection zones, lakes etc., were classified
separately as prohibited areas.
Figure 2: Specific heat abstractios for geothermal vertical
loops (100 m) [W/mK]
The GIS overlay results x categories of areas are
shown in Figure 3.
The map of the geo-solar combinations
demonstrate that the Hannover region is
characterized almost by good-high potential for the
whole case study area. Nevertheless, areas where the
potential is relatively low (areas in green), because
of the terrain aspect and slope and rocks
characteristics should be integrated with others
renewables.
Figure 3: Energy potentials by combining solar and
geothermal energy (vertical loops 100 m).
4 APPLICATIONS
The specific heat extraction/geothermal energy
potential maps are used for online applications
(“Geothermie geht das bei mir?”, LBEG 2012)
which allow to calculate the required dimension of
the closed loop system as subsurface part of a
geothermal space heating. With limited input data of
a conventional home (area to be heated, energy
consumption per area and location of the house) the
dimension and costs of the subsurface part can be
estimated. This is a powerful tool for architects,
planning engineers, and house owners to estimate
costs of different heating supply systems.
Furthermore the maps can be used in local and
regional planning in various ways: In combination
with other spatial information in particular about
environmental vulnerability the maps can be used
for the allocation of urban development into areas
with high potential for a combined micro renewable
used. On the regional level this can be prepared by
rating and prioritizing areas with reference to the
regional or state wide average and by pointing out
their potential contribution to regional energy
targets. Regional energy targets as to the share of
different energy sources will rely on such
information. The implementation of such regional
planning information may be realized by
designations in the mandatory regional plan. On
local level, the information can be used in order to
allocate housing development as well as to include
regulations about adding respective RE facilities in
every legally binding development plan. For the
technical upgrading of exiting housing areas
incentive programs can be set up, which differentiate
SMARTGREENS2014-3rdInternationalConferenceonSmartGridsandGreenITSystems
286

payments according to the expected results.
5 DISCUSSION
Both methods produce results that are differentiated
enough to serve as information basis for regional
and local planning as well as for individual house
owners. In our estimation the solar energy potential
estimation depends on the application of the r.sun
model and on the pvgis data, therefore it can be
applied in every region. However, the accuracy
depends on input data (DEM) and on pvgis data
availability.
For the geothermal energy potential maps we can
consider the typical amount of vertical heat
exchanger per area, which depends on the urban
settlement structure. The necessary input data for
this advanced model are land use maps and average
density of heat exchangers per land use type. With
this approach a comparison based on raster layers
with an energy value per cell would be possible. For
the geothermal energy potential the output energy
for space heating is higher than the energy
abstracted from the ground due to the input of a heat
pump. The seasonal performance factor (spf) of the
heat pump is the dimension of surplus from output
energy dependent of the input energy. The energy
which is available for space heating should be based
on a typical spf factor.
Research projects like Geo-Solar (Pärisch et al.,
2012) and first pilot products from the geothermal
market are focusing of the combination of
solarthermal and geothermal systems. The advantage
of solarthermal systems is the high effectiveness of
collecting energy, the advantage of the geothermal
system is the independent availability of energy 24
hours 365 days a year. Combining both systems
provides a constantly available effective heating
system driven by renewable energy. However, the
potentials of combining both energy sources need
further research. In the future, for a better integration
of both energy sources and the comparison to other
energy forms, all potential maps should be all
transformed to the same ordinal scaling and best
presented on cardinal scales which quantify
kilowatt-hour.
6 CONCLUSION
In many regions geodata already allows the spatially
concrete estimation of solar and geothermal energies
potentials. Our methodologies allow not only for
representing the separate potentials but also give a
first insight into the added value of combining both
sources. The results should be used in regional and
local land use planning as a contribution for
allocating housing development specifically
designed for micro generation of RES. It also can be
used for a targeted and results oriented approach to
allocating incentives to house owners for upgrading
existing houses by RE installation. Last not least the
maps could be made accessible to the public and
used by architects and house owners for calculating
the efficiency of planned solar or geothermal
installations.
ACKNOWLEDGEMENTS
The Lower Saxony research network "Smart Nord"
acknowledges the support of the Lower Saxony
Ministry of Science and Culture through the
"Niedersächsisches Vorab" grant program (grant ZN
2764).
REFERENCES
Baldschuhn, R., Binot, F., Fleig, S. & Kockel, F., 2001.
Geotektonischer Atlas von Nordwestdeutschland und
dem deutschen Nordsee-Sektor: Strukturen,
Strukturentwicklung, Paläogeographie - Geol. Jb.,
A153: 88 p.
Bombien, H., Hoffers, B., Breuckmann, S., Helms, M.,
Lademann, K., Lange, M., Oelrich, A., Reimann, R.,
Rienäcker, J., Schmidt, C., Slaby, M. F. & Ziesch, J.,
2012. Der Geotektonische Atlas von Niedersachsen
und dem deutschen Nordseesektor als geologisches
3D-Modell.- GMIT, 48: 6-13.
EU Joint Research Centre (JRC), 2010. Solar model r.sun.
http://re.jrc.ec.europa.eu/pvgis/solres/solmod3.htm.
LBEG, 2012. Geothermie geht das bei mir.- Online
application, http://nibis.lbeg.de/geothermie/
LBEG, 2013. map server, http://nibis.lbeg.de/cardomap3/
Net!Works European Technology Platform, 2011. Smart
Cities Applications and Requirements, http://www.
networks-etp.eu/fileadmin/user_upload/Publications/P
osition_White_Papers/White_Paper_Smart_Cities_Ap
plications.pdf.
Pannike, S., Kölling, M., Panteleit, B., Reichling, J.,
Scheps, V. & Schulz, H.D., 2006. Auswirkung
hydrogeologischer Kenngrößen auf die Kältefahnen
von Erdwärmesondenanlagen in Lockersedimenten.-
Grundwasser, 1/2006: 6-18.
Pärisch, P., Warmuth, J., Bertram, E., Tepe, R., 2012.
Experiments for combined solar and heat pump
systems. Proceedings of the Eurosun 2012, Rijeka,
Kroatien, 18.-20.09. 2012, Croatian Solar Energy
Association & International Solar Energy Society,
OptimizingMicroRenewableGenerationforSmartCitiesbyCombiningSolarandGeothermalEnergyPotentials-ACase
StudyoftheHannoverRegion
287

ISBN: 978-953-6886-20-3.
Šuri M., Huld T. A., Dunlop E. D., Ossenbrink
H. A., 2007. Potential of solar electricity generation in the
European Union member states and candidate
countries. Solar Energy 81 (2007) 1295–1305.
Tepe, R., 2011. High-efficient heat pump systems with
geothermal and solar thermal energy sources,
http://www.isfh.de/institut_solarforschung/files/11013
1_geosolarwp_en.pdf.
VDI 2001. Thermal use of the underground: Ground
source heat pump systems.- VDI 4640 Part 2, 43 p.,
Berlin, Beuth Verlag.
Wicaksono H., Aleksandrov K. and Rogalski S., 2012. An
Intelligent System for Improving Energy Efficiency in
Building Using Ontology and Building Automation
Systems. http://www.intechopen.com/download/pdf/
38012
SMARTGREENS2014-3rdInternationalConferenceonSmartGridsandGreenITSystems
288
