
Efficiency of LSA and K-means in Predicting Students’ Academic
Performance Based on Their Comments Data
Shaymaa E. Sorour
1,2
, Tsunenori Mine
3
, Kazumasa Goda
4
and Sachio Hirokawa
5
1
Faculty of Specific Education, Kafr Elsheik University, 33516 El-Gaish Street, KafrElsheikh, Egypt
2
Graduate School of Information Science and Electrical Engineering, Kyushu University,
744 Motooka Nishiku, Fukuoka, Japan
3
Faculty of Information Science and Electrical Engineering, Kyushu University, 744 Motooka Nishiku, Fukuoka, Japan
4
Kyushu Institute of Information Science, 6-3-1 Saifu, Dazaifu, Fukuoka, Japan
5
Research Institute for Information Technology, Kyushu University, 6-10-1 Hakozaki Higashi-ku, Fukuoka, Japan
Keywords: Freestyle Comments, PCN Method, LSA, K-means Cluster Algorithm.
Abstract: Predicting students’ academic performance has long been an important research topic in many academic
disciplines. The prediction will help the tutors identify the weak students and help them score better marks;
these steps were taken to improve the performance of the students. The present study uses free style
comments written by students after each lesson. These comments reflect their learning attitudes to the
lesson, understanding of subjects, difficulties to learn, and learning activities in the classroom. (Goda and
Mine, 2011) proposed PCN method to estimate students’ learning situations from their comments freely
written by themselves. This paper uses C (Current) method from the PCN method. The C method only uses
comments with C item that focuses on students’ understanding and achievements during the class period.
The aims of this study are, by applying the method to the students’ comments, to clarify relationships
between student’s behaviour and their success, and to develop a model of students’ performance predictors.
To this end, we use Latent Semantic Analyses (LSA) and K-means clustering techniques. The results of this
study reported a model of students’ academic performance predictors by analysing their comment data as
variables of predictors.
1 INTRODUCTION
The topic of explanation and prediction of students’
academic performance is widely researched. The
ability to predict their performance is very important
in educational environments. Increasing students’
success is a long-term goal in all academic
institutions. If educational institutions can predict
their academic performance before their final
examination as early as possible, extra efforts can be
taken to arrange proper support for them, in
particular lower performance students to improve
their studies and help them success. Many
researchers tried to predict students’ behaviors in
educational environments based upon diverse factors
like personal, social, psychological, and other
environmental variables. Various experiments have
been carried out in this area.
This paper also proposes a method for predicting
students’ grades. Unlike previous studies, our
method is based on students’ freestyle comments
collected in their class. The students’ comments are
good resources to predict their learning situations.
Each student writes his/her comments after a lesson;
the student looks back upon his/her learning
behavior and situation; he/she can express about
his/her attitudes, difficulties, and any other
information that help a teacher estimate his/her
learning activities.
(Goda and Mine, 2011) proposed the PCN
method to estimate students’ learning situations
from freestyle comments written by the students.
The PCN method categorizes the students’
comments into three items of P (Previous activity),
C (Current activity), and N (Next activity). It
provides data expressing students’ learning status,
also index reducing the task for all of their self-
observations, self-judgments, and self-reactions.
However (Goda and Mine, 2011) did not discuss
prediction of students’ grades.
In this paper we propose a prediction method of
students’ grades using comments with C item (C
63
E. Sorour S., Mine T., Goda K. and Hirokawa S..
Efficiency of LSA and K-means in Predicting Students’ Academic Performance Based on Their Comments Data.
DOI: 10.5220/0004841000630074
In Proceedings of the 6th International Conference on Computer Supported Education (CSEDU-2014), pages 63-74
ISBN: 978-989-758-020-8
Copyright
c
2014 SCITEPRESS (Science and Technology Publications, Lda.)

comments in short). Our proposed method is as
follows:
We analyzed C comments by using Mecab
program*, which is a Japanese morphological
analyzer to extract words and their part of speech
(verb, noun, adjective, and adverb).
We applied LSA to extracted words and
comments matrix so that we can identify patterns
and relationships between the extracted words
and latent concepts contained in unstructured
collection of texts (students’ comments).
We classified the results of LSA into 5 groups by
using K-means clustering method.
The rest of the paper is organized as follows: Section
2 summaries related work in an application of
prediction of students’ performance by data or text
mining techniques in educational environments;
Section 3 describes our students’ grade prediction
method, explaining related methods such as LSA
and K-means clustering algorithm; Section 4
discusses experimental results of students’ final
grade predictions. Finally, we conclude this paper
with a summary and describe an outlook for future
work.
2 RELATED WORK
The main objective of any higher educational
institution is to improve the quality of managerial
decisions and to impart quality education. Good
prediction of student’s success in higher learning
institution is one way to reach the highest level of
quality in higher education systems.
Various experiments have been carried out in
this area to predict students’ academic performance.
To predict students’ marks in the end of their
semester, (Bharadwaj and Pal, 2011a) used the
students’ marks of their previous semester, test
grade in their previous class, seminar performance,
assignment performance, general proficiency,
attendance in their class and lab work. (Bharadwaj
and Pal, 2011b) also conducted another study on
students’ performance, selecting 300 students from 5
different degree colleges in India. They found that
students’ academic performance were highly
correlated with their grades in senior secondary
exam, living location, medium of teaching, mother’s
qualification, family annual income, and their family
status. Using students’ attendance, test grade in their
class, seminar and assignment marks, and lab works,
(Yadav et al., 2011) predicted their performance at
the end of the semester with help of three decision
tree algorithms: ID3, CART, and C4.5, and achieved
52.08%, 56.25%, and 45.83% classification
accuracy, respectively. (Kovacic, 2010) used
students’ enrollment data to predict successful and
unsuccessful student in New Zealand, and achieved
59.4% and 60.5% of classification accuracy when
using decision tree algorithms: CHAID and CART,
respectively. (Sembiring et al., 2011) found that
students’ interest, study behaviour, learning time,
and family support are significantly correlated with
their academic performance.
(Osmanbegović and
Suljić, 2012) applied three supervised data mining
algorithms (Naïve Bayes, neural network, decision
tree) to the preoperative assessment data, to predict
students’ pass or failure in a course; They evaluated
prediction performace of the learning methods based
on their predictive accuracy, ease of learning, and
user friendly characteristics. The results indicated
that the Naïve Bayes classifier outperforms, on its
predictive accuracy, decision tree and neural
network methods. (Kabakchieva, 2013) focused on
the implementation of data mining techniques and
methods for acquiring new knowledge from data
collected by universities. The main goals of the
research are to reveal the high potential of data
mining applications for university management,
to
find out if there are any patterns in the available data
that could be useful for predicting students’
performance at the university based on their personal
and pre-university characteristics. Kabakchieva
classified students’ level into five distinct categories
(excellent, very good, good, average, and bad); they
were determined from the total university score
achieved by the students. The experimental study
classified data by decision tree algorithm (C4.5 and
J48), Bayesian classifiers (NaiveBayes and
BayesNet), a Nearest Neighbour algorithm (IBk) and
two rule learners (OneR and JRip).
The results
indicated that the prediction rates were not
remarkable (vary between 52 and 67%). Moreover,
the classifiers perform differently for the five
classes. The data attributes related to the students’
university admission score and number of failures at
the first-year university exams are among the factors
influencing most the classification process.
(Adhatrao et al., 2013) built a system to predict
students’ performance from their previous
performances using concepts of data mining
techniques under classification. They analyzed the
data set containing information about the students,
such as gender, marks scored in the board
examinations, marks and rank in entrance
* http://sourceforge.net/projects/mecab/
CSEDU2014-6thInternationalConferenceonComputerSupportedEducation
64

examinations and results in the first year of the
previous batch of the students. They applyed ID3
and C4.5 classification algorithms, and predicted the
general and individual performance of freshly
admitted students in future examinations. The
accuracy result is 75.15% for both ID3 and C4.5
algorithms. (Antai et al., 2011) classified a set of
documents according to document topic areas by
using CLUTO program with and without LSA. The
results showed that the internal cluster similarity
with LSA was much higher than that without LSA.
According to the previous studies mentioned
above, external data beside students’ marks in the
previous year are important to predict their
performance. On the other hand, using suitable data
mining techniques related to input data will give
better results than others.
(Bachtiar et al., 2012) developed an estimation
model to predict students’ English ability (listening,
reading, speaking, and writing) skills and
performance. They proposed a questionnaire to
quantify students’ affective factors with three major
factors: motivation, attitude, and personality. The
components of each of these factors are further
identified by exploring each factor conceptually.
They applied a neural network model in their
experiments. The accuracy scores obtained by the
model were 93.3% for listening, 94.4% for reading,
94.9% for speaking, and 93.6% for writing skills.
(Minami and Ohura, 2013) analysed students’
attitude towards learning, and investigated how it
affects their final evaluation; they pursued a case
study of lecture data analysis in which the
correlations between students’ attitude to learning
such as attendance and homework as effort, and the
students’ examination scores as achievement; they
analyzed the students' own evaluation on themselves
and lectures based on a questionnaire; they also
introduced a new measuring index named self-
confidence, to investigate the correlations between
self-confidence, self-evaluation, lecture evaluation,
effort, and achievement scores. Through this study,
they showed that a lecturer can give feedback data to
students who tend to over-evaluate themselves, and
let the students recognize their real positions in the
class.
From the two studies, we need to understand
individual students more deeply, recognize students’
learning status and attitude to give feedbacks to
them. Although applying questionnaire gave good
results than previous data (e.g. personality, sociality,
and students’ behaviour), we need to understand
students’ characteristics more deeply by letting them
describe themselves about their educational
situations such as understanding of subjects,
difficulties to learn, learning activities in the
classroom, and their attitude toward the lesson.
Researchers have used various classification
methods and various data in their studies to predict
students’ academic performance.
Different from the above studies, (Goda and
Mine, 2011) proposed PCN method to estimate
students’ learning situations with their freestyle
comments written just after lesson. The PCN method
categorizes their comments into three items: P
(Previous), C (Current), and N (Next) so that it can
analyze the comments from the points of views of
their time-oriented learning situations. (Goda et al.,
2013) proposed PCN scores for determing the
validity level of assessment to students’ comments
and showed there exist strong correlations between
the PCN scores and accuracy of predicting
students’ final grades. First, they employed multiple
regression analysis to calculate PCN scores and the
results indicated that students who wrote comments
with high PCN scores are considered as those who
describe the students’ learning attitude
appropriately. Second, they applied machine
learning method Support Vector Machine (SVM) to
the comments for predicting the students’ final
results in five grades of S, A, B, C, and D. The
experimental results illustrated that as students’
comments get higher PCN scores, prediction
performance of the students’ grades becomes higher.
Goda et al., however, did not discuss prediction
performance of students’ final grades.
In this study, as an extention of (Goda et al.,
2013), we focus on prediction performance of
students’ final grades. Using C comments from PCN
method, we try to predict their grade in each lesson
and discuss change of accuracy in a sequence of the
lessons.
In the following section, we describe our method
for predicting students’ performance.
3 STUDENTS’ GRADE
PREDICTION METHOD
3.1
Overall Procedures of Proposed
Method
Figure 1 displays the overall procedures of our
proposed method; we have five phases:
1- Comments Data Collection: This phase
focuses on collecting comments from students after
each lesson. In this case, we use comments data
EfficiencyofLSAandK-meansinPredictingStudents'AcademicPerformanceBasedonTheirCommentsData
65
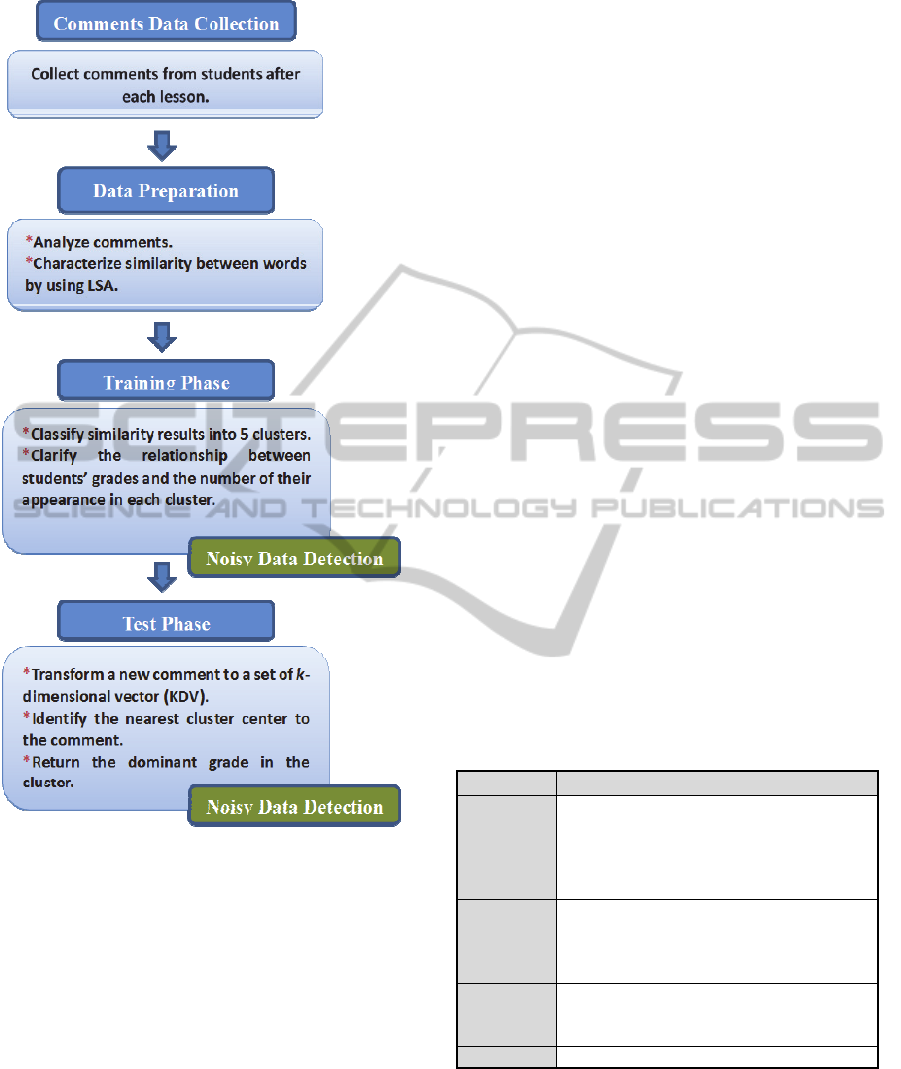
Figure 1: Overall procedures of the proposed method.
collected previously from (Goda and Mine, 2011).
We choose C comments that describe the current
activities of the students during the class period.
(See Section 3.2)
2- Data Preparation: The data preparation
phase covers all the activities required to construct
the final dataset from the initial raw data. Our
method analyses comments data by extracting words
and part of speech, calculating the word frequencies,
applying log entropy weighting method so as to
balance the effect of occurrence frequency of words
in all the comments (See Section 3.3), and applying
LSA technique to reduce the dimensions of a matrix
and obtain the most significant vectors. (See Section
3.4)
3- Training Phase: In this phase, we classify
LSA results into 5 clusters by using K-means
clustering method. (See Section 3.5)
4- Test Phase: This phase revolves on
extracting words from a new comment, and
transforming an extracted-words vector of the
comment to a set of k-dimensional vector (KDV) by
using LSA.
We identify the nearest cluster center to the
comment, among the 5 clusters created in the
training phase, and return the dominant grade in the
cluster. (See Section 4)
5- Noisy Data Detection: we detect noisy data
from the points of view of grade prediction. We
conduct the detection in two phases: training phase
and test phase. In the training phase, we calculate
Standard deviation (Sd) to each cluster. In the test
phase, we measure the average distance between a
new comment and cluster centers. (See Section 3.6)
3.2 PCN Method and Students’ Grade
Goda collected free-style comments of 123 students
in two classes who attended his programming
exercise course. The course had 15 lessons and the
students’ comments were collected every lesson
(Goda and Mine, 2011).
Each student described his/her learning tendency,
attitudes, and understanding for each lesson. Goda
prepared the fill in forms for their comments. The
form consists of four items: P, C, N and O. The
explanations of the items are shown in Table 1.
Table 1: Viewpoint Categories of Students’ Comments.
Viewpoint Meaning
P
(Previous)
The learning activity before the class
time such as review of previous class and
preparation for the coming class. For
example, “I read chapter 3 of the
textbook.”
C (Current)
The understanding and achievements of
class subjects during the class time. For
example, “I didn’t finish all exercise
because time is up.”
N (Next)
The learning activity plan until the next
class. For example, “I will make
preparation by next class.”
O (Other) Other descriptions
The main idea of their research was to grasp
students’ learning status in the class, and illustrate
the validity of the PCN method.
In their another study, (Goda et al., 2013)
proposed PCN score to judge the appropriateness of
students’ comments and the way to automatically
calculate the score with high accuracy; they also
CSEDU2014-6thInternationalConferenceonComputerSupportedEducation
66
showed there exist strong correlations between the
PCN score and prediction performance of students’
grades by applying SVM to their comments. They
chose five grades instead of mark itself as students’
results. Table 2 shows the correspondence between
the grades and the range of marks in the exam. The
results of their method are shown in Table 3, where
C comments get higher results at the head of grades:
S, A, and B, compared with P and N comments.
In this research, we have chosen C comments
from (Goda et al., 2013); C comments show
understanding and achievements of class subjects
during the class time as shown in Table 1.
Table 2: The correspondence between grades and the
range of marks.
Grade Scores
S 90-100
A 80-89
B 70-79
C 60-69
D 0-59
Table 3: Correlation Coefficient of PCN-score and student
grades (Goda et al., 2013).
P C N
S
0.3356 0.7956 0.6700
A
0.2647 0.8624 0.7829
B
0.7465 0.8263 0.7076
C
0.7631 0.6602 0.5380
D
0.7355 0.4955 0.2079
3.3 Term Weighting to Comments
After choosing C comments, we use a Japanese
morphological analyzer Mecab to analyze each
sentence for extracting words and their part of
speech (noun, verb, adjective, and adverb).
In preparing for LSA, the text is modeled in a
standard word-by-comment matrix (Salton and
McGill, 1983) by extracting words from the natural
language text. We follow procedures established for
extracting keywords from the comments. This word-
by-comment matrix A shown in Table 4 is
comprised of m words w
1
, w
2
,..., w
i
, .. , w
m
in n
comments c
1
, c
2
, .., c
j
, .., c
n
, where the value of each
cell a
ij
of A represents a local term frequency tf
ij
that
indicates the number of occurrence of word "w
i
" in
comment "c
j
." To balance the effect of word
frequencies in all comments, log entropy term
weighting method is applied to the original word-by-
comment matrix, which is the basis for all
subsequent analyses (Botana et al., 2010); we apply
a global weighting function to each nonzero element
of a
ij
of A to improve retrieval performance.
The global weighting function transforms each
cell a
ij
of A to a global term weight g
i
, which is
entropy of w
i
for the entire collection of comments
(Landauer, T., et al., 2013 & Dumais, 1991).
Here, g
i
is calculated as follows:
Global
Term
Weight g
i
g
i
= 1 +∑
j=1,n
(p
ij
log (p
ij
)/ log (n)
where p
ij
= L
ij
/gf
i
,
L
ij
=log (tfij + 1); tf
ij
is the number
of occurrence of w
i
in c
j
,
gf
i
is the number of occurrence of
word w
i
in all comments,
and n is the number of all the
comments.
Table 5 shows the results generated after applying
log entropy weighting method, where the rows refer
to words, and columns refer to C comments.
Table 4: Word by comment matrix.
Word
Com 1 Com 2 Com 3 Com 4 Com 5 Com6 Com 7 Com 8
Level
1 0101101
Setting
0 1010001
Understand
1 0010011
Do
1 0000100
Opertion
0 1010100
Exist
0 0100011
Connection
1 0010011
Suffer
0 0000000
What
0 1001010
Screen
0 0100010
Treatment
1 0010010
Table 5: An example of log entropy term weighting.
Word
Com 1 Com 2 Com 3 Com 4 Com 5 Com6 Com 7 Com 8
Level
0.45 0 0.45 0 0.45 0.45 0 0.45
Setting
0 0.71 0 0.71 0 0 0 0.71
Understand
0.58 0 0 0.58 0 0 0.58 0.58
Do 0.9900000.9900
Opertion
0 0.71 0 0.71 0 0.71 0 0
Exist
0 0 0.99 0 0 0 0 0.99
Connection
0.58 0 0 0.58 0 0 0.58 0.58
Suffer 00000000
What
0 0 .71 0 0 0.7 1 0 0.71 0
Screen
0 0 0.99 0 0 0 0.99 0
Treatment
0.71 0 0 0.71 0 0 0.71 0
3.4 Latent Semantic Analysis
LSA has been defined in different ways by different
researchers. (Dumais, 1991) defined LSA as a
statistical information retrieval technique, designed
for the purpose of reducing the problems of
EfficiencyofLSAandK-meansinPredictingStudents'AcademicPerformanceBasedonTheirCommentsData
67
synonymy and polysemy in information retrieval.
LSA is also defined as a theory and method for
extracting and representing the contextual-usage
meaning of words by statistical computations
applied to a large corpus of text (Landauer and
Dumais, 1997). The underlying idea is that the
aggregate of all the word contexts in which a given
word does and does not appear provides a set of
mutual constraints that largely determine the
similarity of meaning of words and sets of words to
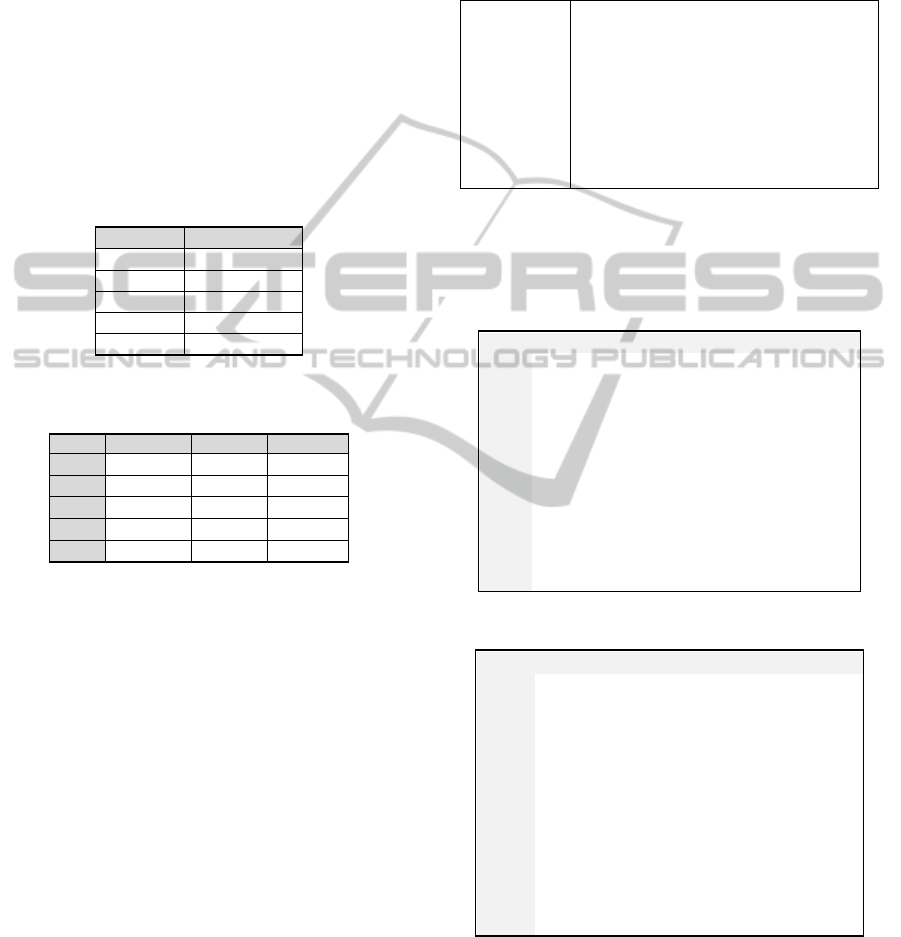
each other. The mathematical foundation for LSA
lies in singular value decomposition (SVD), which is
a matrix approximation method for reducing the
dimensions of a matrix to the most significant
vectors. Here we assume matrix A of dimension m×n,
where m is the total number of words, and n is the
total number of comments, is defined as A=USV
T
,
where U (m×n) and V
T
(n×n) are the left and right
singular matrices (orthonormal) respectively, and S
(n×n) is the diagonal matrix of singular values. SVD
yields a simple strategy to obtain an optimal
approximation for A using smaller matrices. If the
singular values in S are ordered descending by size,
the first k largest may be kept and the remaining
smaller ones set to zero. The product of the resulting
k-reduced matrices is a matrix A˜, which is
approximately equal to A in the least squares sense
and of the same rank. That is, A˜
A=USV
T
(Berry et
al., 1995). A pictorial representation of the SVD of
input matrix A and the best rank–k approximation to
A can be seen in Figure 2.
The baseline theory for
LSA in text processing is that by looking at the
entire range of words chosen in a wide variety of
texts, patterns will emerge in terms of word choice
as well as word and document meaning.
Figure 2: Diagram of the truncated SVD, the blue colour
illustrates how to reduce the range of data (Berry et al.,
1995; Witter and Berry, 1998).
The number of singular dimensions to retain is an
open issue in the latent semantic analysis literature.
Based on the research (Hill et al., 2002) retaining
dimensions 2 to 101 resulted in satisfactory
performance.
In this research, we apply LSA to the word by
comment matrix as shown in Table 6, and retaining
only the first four ranks by keeping the first four
columns of U, V, and S.
Table 6: Results of k dimensional vector (KDV).
0.649 0.733 0.263 0.073
0.926 0.977 0.783 0.701
0.489 0.465 0.357 0.241
0.521 0.544 0.434 0.381
0.543 0.551 -0.217 0.176
0.275 0.291 0.375 0.249
0.496 -0.469 0.502 0.007
0.423 0.426 0.347 0.138
0.583 0.571 -0.43 0.307
0.445 0.444 0.308 0.219
0.398 0.404 -0.384 0.2
0.64 -0.658 -0.328 0.121
0.443 0.433 0.512 0.374
3.5 Clustering
One of the definitions given of clustering by
(Zaiane,1999), is a process in which a set of objects
are split into a set of structured sub-classes, bearing
a strong similarity to each other, such that they can
be safely treated as a group. Such sub-classes are
referred to as clusters. (Csorba and Vajk, 2006)
define document clustering as a procedure which is
used to divide documents based on certain criterion,
like topics, with the expectation that the clustering
process should recognize these topics and
subsequently place the documents in the categories
to which they belong. Various clustering algorithms,
which work in different ways, have been proposed.
In this research, we concern with K-means
clustering algorithm, which is one of the simplest
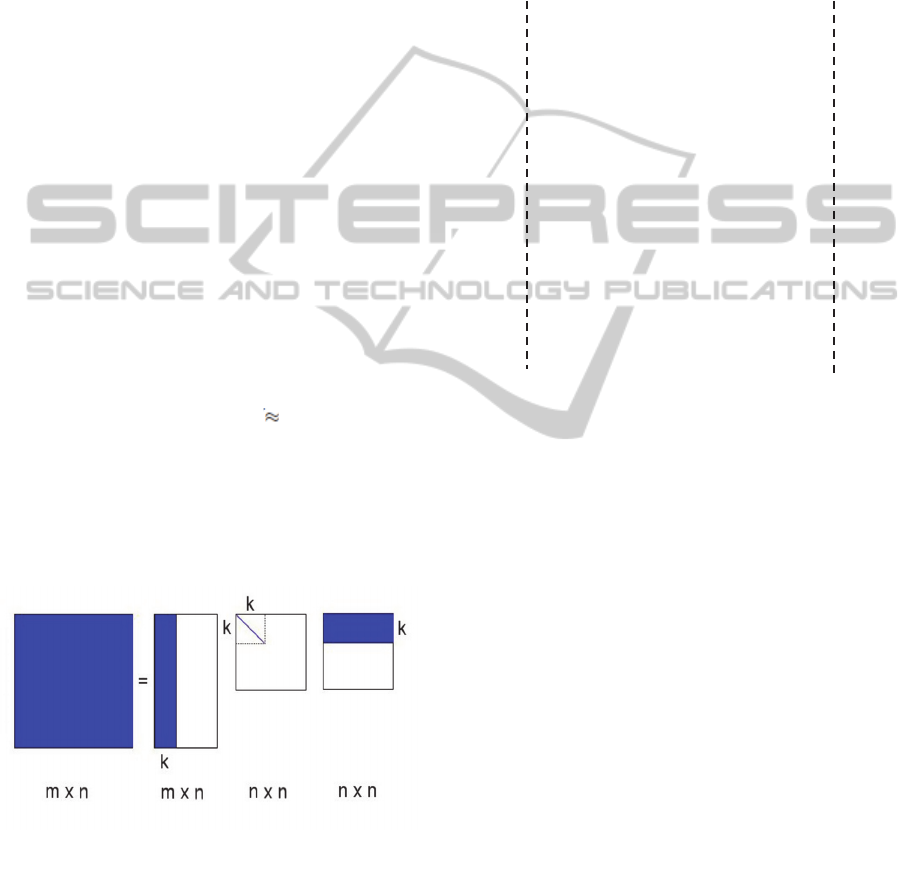
unsupervised learning algorithms. We classify k
dimensional vector (KDV) results into 5 groups,
then carry out test by comparing clustering results
with students’ grades. Figure 3 shows how to make
clusters from the data based on 5 grades.
Next, we consider to make clusters of students’
comments collected at each lesson from 7th to 15th.
104 C comments are collected at the 7th lesson.
The
number of words extracted after analysing
comments are 486 for the lesson.
A = U S V
T
A˜ =
CSEDU2014-6thInternationalConferenceonComputerSupportedEducation
68
Figure 3: An example of clustering data based on students’
grades: S, A, B, C, and D.
The results in the training phase are shown in
Table 7. Grade S accounts for about 54% in Cluster
1; grade A about 61% in Cluster 2; grade B about
43% in Cluster 3; grade C about 45% in Cluster 4;
finally, grade D about 53% in Cluster 5. Here we
call the grade that most frequently appears in a
cluster, dominant grade in the cluster; dominant
grades in Cluster 1, 2, 3, 4, and 5 are S, A, B, C, and
D, respectively.
Table 7: The results of training phase for lesson 7.
Cluster
1
Cluster
2
Cluster
3
Cluster
4
Cluster
5
S
0.54 0.08 0.09 0.15 0
A
0.22 0.61 0.26 0.25 0.27
B
0.14 0.14 0.43 0.10 0.07
C
0.10 0.17 0.09 0.45 0.13
D
0 0 0.13 0.05 0.53
3.6 Noisy Data Detection
Outlier detection discovers data points that are
significantly different from the rest of the data. In
text mining, outlier analysis can be used to detect
data that adversely affect the results (Mansur et al.,
2005). In this paper, we detect outliers in two
phases: training phase and test phase. We call such
outliers noisy data from the points of view of grade
prediction.
3.6.1 Noisy Data Detection in Training
Phase
In the training phase, we calculate Standard
deviation (Sd) to each cluster to detect noisy data.
The calculation of Sd
is as follows:
1. For each cluster, say ith cluster, calculate the
centroid c
i
of the cluster by finding the average value
of KDV formed comments in the cluster.
(1)
Here s
k,i
, and n
i
are the kth singular vector
representing a comment and the number of the
comments in the ith cluster, respectively.
2. Calculate the standard deviation for the cluster
.
The higher the Sd
i
is, the lower the semantic
coherence is (Dhillon et al., 2001). Here, we define
noisy data of the ith cluster in training phase as
follows:
(2)
Noisy Data in the ith Cluster in Training Phase:
Let s
k,i
be the kth member of the ith cluster;
if s
k,i
> Sd
i,
then s
k,i
is a noisy data of the cluster,
otherwise s
k,i
is not a noisy data of the cluster.
3.6.2 Noisy Data Detection in Test Phase
In the test phase, we calculate the average distance
between a new comment and a cluster center to
detect noisy data. We define noisy data of the ith
cluster in test phase as follows:
Noisy Data in the ith Cluster in Test Phase:
Let c
i
, s
k,i
, and d
i,ave
be the center of the ith cluster,
the kth member of the cluster, and the average
distance between members of the cluster and c
i
,
respectively;
if |s
k,i
- c
i
| > d
i,ave
, then s
k,i
is a noisy data for the
cluster, otherwise s
k,i
is not a noisy data for the
cluster.
3.6.3 Effect of Removing Noisy Data
Here we show the effect of noisy data detection in
the training phase. Such the effect in test phase will
be described in the next section.
Table 8 displays the result after detecting noisy
data for lesson 7. They become better than before,
Table 8: The results of training phase after removing noisy
data.
Cluster
1
Cluster
2
Cluster
3
Cluster
4
Cluster
5
S
0.66 0.14 0.07 0.13 0
A
0.13 0.72 0.27 0.02 0.13
B
0.13 0 0.47 0.26 0.16
C
0.08 0.14 0.06 0.59 0.13
D
0 0 0.13 0 0.58
EfficiencyofLSAandK-meansinPredictingStudents'AcademicPerformanceBasedonTheirCommentsData
69
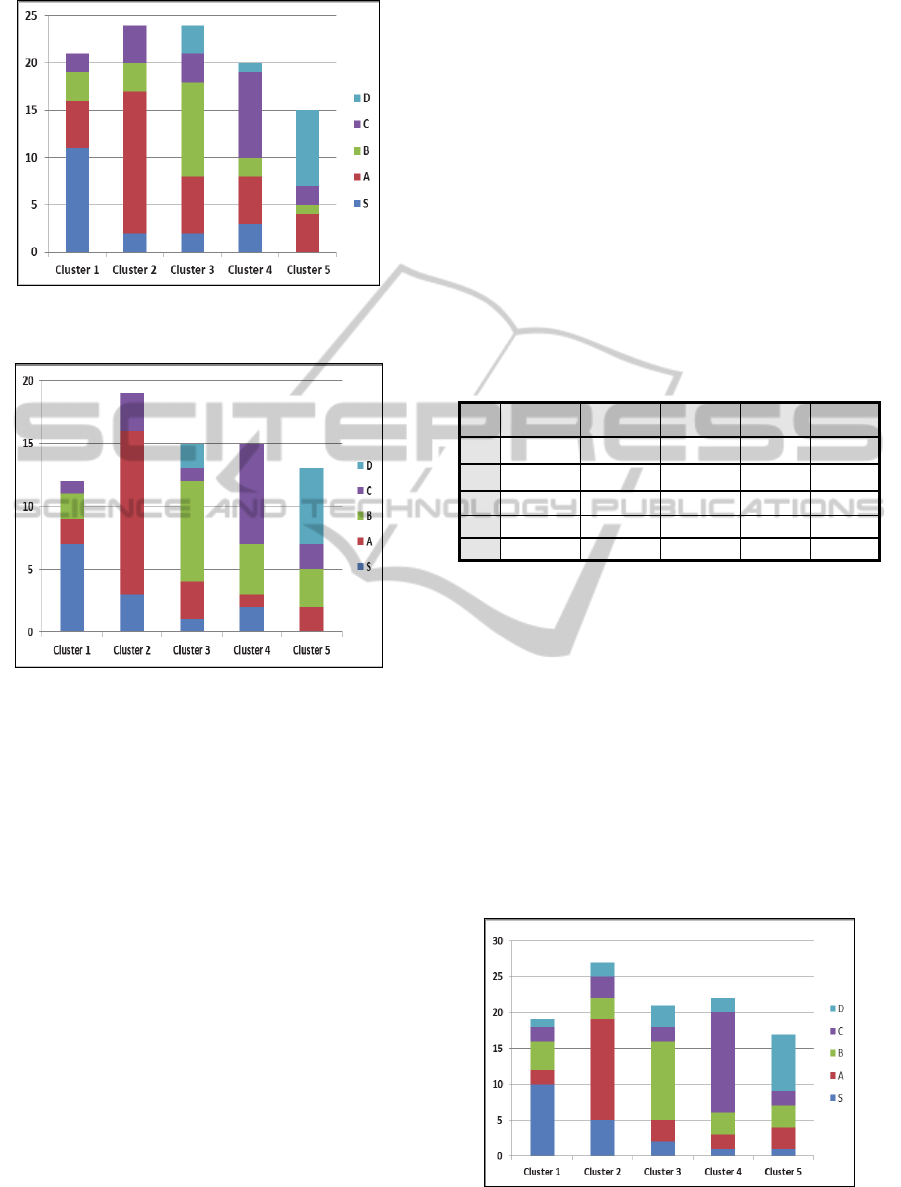
Figure 4: K-means cluster for training data at lesson 7
before detecting noisy data.
Figure 5: K-means cluster for training data after removing
noisy data.
especially in cluster 1, 2, and 4. Figures 4 and 5 illustrate
results before and after detecting noisy data in training
phase, respectively.
4 PREDICTION PERFORMANCE
In order to predict a student’s grade based on his/her
comments, we established the following steps:
1. Extract words from a new comment.
2. Transform a comment to a set of k-dimensional
vector (KDV) by calculating the following
equation.
q’=q
T
U
k
S
k
-1
(3)
Here q and q’ are the vector of words in a new
comment multiplied by the appropriate word
weights and the KDV transformed from q,
respectively. The sum of these k dimensional word
vectors is reflected by the term q
T
U
k
in the above
equation. The right multiplication by S
k
-1
differentially weights the separate dimensions
(Rosario, 2000).
3. Identify which cluster center is the nearest to the
comment, by measuring the distance between the
comment and cluster centers.
4. Return the dominant grade in the cluster to which
the identified cluster center belongs, where the
dominant grade in a cluster means the grade that
most frequently appears in the cluster as
described in the explanations of Table 7.
After performing the above steps, we conducted 10-
fold cross validation. Table 9 and Figure 6 present
the results of students’ grade prediction: (Cluster1,
S=53%), (Cluster 2, A= 54%), (Cluster 3, B=52%),
(Cluster4, C=63%), (Cluster 5, D=47%).
Table 9: The results in test phase for lesson 7 before
detecting noisy data.
Cluster
1
Cluster
2
Cluster
3
Cluster
4
Cluster
5
S
0.53 0.19 0.10 0.05 0.06
A
0.11 0.54 0.14 0.09 0.18
B
0.21 0.11 0.52 0.14 0.18
C
0.10 0.08 0.10 0.63 0.11
D
005 0.08 0.14 0.09 0.47
In order to achieve higher similarity between data
and improve our results, we apply noisy data
detection algorithm in the test phase described in
Section 3.5.2. The results are shown in Table 10 and
Figure 7; the results become better than those shown
in Figure 6. For example, grade S accounts for about
55%, and both grade C and D are removed in Cluster
1; grade A about 59% and grade D was removed in
Cluster 2; grade B about 64% and grade D are
removed in Cluster 3; grade C also about 64%, but
grade S and B are removed in Cluster 4; grade D
about 50%, and both grade S and C are removed in
Cluster 5. We also show the results from lesson 8 to
15 in Figure 8, by applying the same method.
Figure 6: Students’ grade prediction based on their
comment data for lesson 7.
CSEDU2014-6thInternationalConferenceonComputerSupportedEducation
70
Table 10: The results in test phase after removing noisy
data.
Cluster
1
Cluster
2
Cluster
3
Cluster
4
Cluster
5
S
0.55 0.23 0.07 0 0
A
0.18 0.59 0.15 0.18 0.2
B
0.27 0.09 0.64 0 0.3
C
0 0.09 0.07 0.64 0
D
0 0 0.07 0.18 0.50
Figure 7: Student grade prediction for lesson 7 after
removing noisy data.
Next, we calculated average prediction accuracy of
students’ grade from lesson 7 to 15
before and after
detecting noisy data. The results are shown in Table
11 and Figure 9. The prediction accuracy results are
between (59.3%) and (71.0%) for all data, and
(63.5%) to (74.0%) after detecting noisy data. The
highest accuracy results from the top were obtained
in lessons 7 and 12, and the lowest ones from the
bottom in lesson 8 and 14.
Table 11: The prediction accuracy results.
Lesson All data
Noisy data
Detection
7
71.0% 74.0%
8
59.3% 63.5%
9
70.0% 73.0%
10
67.3% 69.0%
11
65.5% 68.0%
12
71.0% 73.8%
13
68.3% 70%
14
64.0% 67.0%
15
64.5% 68.2%
This indicates that students wrote good
comments in lesson 7. We think they had high
motivation to write and express their attitudes to the
lesson probably because they took the first lesson on
programming at that time. The motivation might
probably have become lower in lesson 8 due to
difficulty of programming, but rose in lesson 9. In
addition, the lessons 11, 14, and 15 have lower
results. Finally, the last lesson became better than
before. We believe from these views that we have to
evaluate comments after each lesson to give
feedback to students, and encourage them to write
good comments. We believe that using these
comments with useful way would improve students’
performance.
5 CONCLUSIONS AND FUTURE
WORK
In this paper, we discussed the prediction method of
students’ grade based on C comments data from
(Goda and Mine, 2011). The C comments present
students’ attitudes, understanding and difficulties
concerning to each lesson. We applied LSA
technique to the comments for obtaining
approximate estimations of the contextual usage
substitutability of words in larger text segments, and
the kinds of meaning similarities among words and
text segments. Then we classified the results into 5
groups by using K-means clustering method. To
validate our proposed method, we conducted
experiments to estimate students’ academic
performance based on their freestyle comments. The
experimental results illustrate the validity of the
proposed method.
This study expressed the correlation between self-
evaluation descriptive sentence written by students
and their academic performance by predicting their
grade. In near future, we will develop another
method to predict students’ grades to get higher
accuracy in prediction results. For this step, it is
indispensable to devise a method for collecting good
comments data that describe educational situations
appropriately for each student, and for increasing the
quality of the comments.
Collecting comments, however, is not an easy
task for a teacher. We have to lead students so that
they good describe comments. For example, we
should prepare a comment form including items that
we would like students to describe. One of the
examples are PCNO we used. At this time, giving
students’ actual examples to write comments based
on the objectives for each lesson is also a good
option. In addition, we have to motivate students to
describe their comments so that they wise up the
worth-describing their comments; for example, let
them improve their confidence and satisfaction to
the lessons by looking back on their comments.
Giving automated feedback will also help students
EfficiencyofLSAandK-meansinPredictingStudents'AcademicPerformanceBasedonTheirCommentsData
71
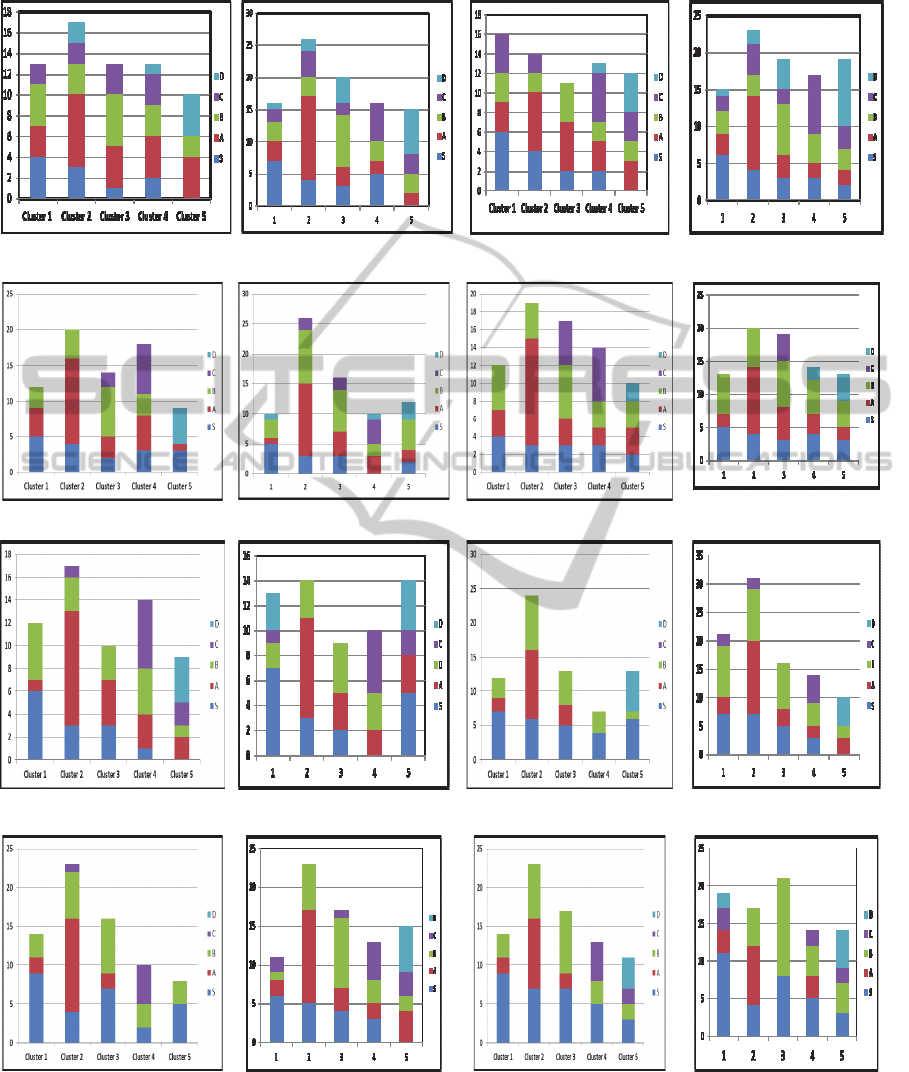
Lesson 8 Lesson 9
a b a b
Lesson 10
a b
Lesson 11
a b
Lesson 12
a b
Lesson 13
a b
Lesson 14
a b
Lesson 15
a b
Figure 8: Analysing Comments Data from Lesson 8
to 15, (a) Training Data Results (B) Student’s Grade Prediction.
increase their ability of descriptions. At this time, it
is preferable that they can share their comments
together in writing process.
Finally, further research is necessary to realize
environments suitable for activating students’
motivation and collect good comments.
CSEDU2014-6thInternationalConferenceonComputerSupportedEducation
72
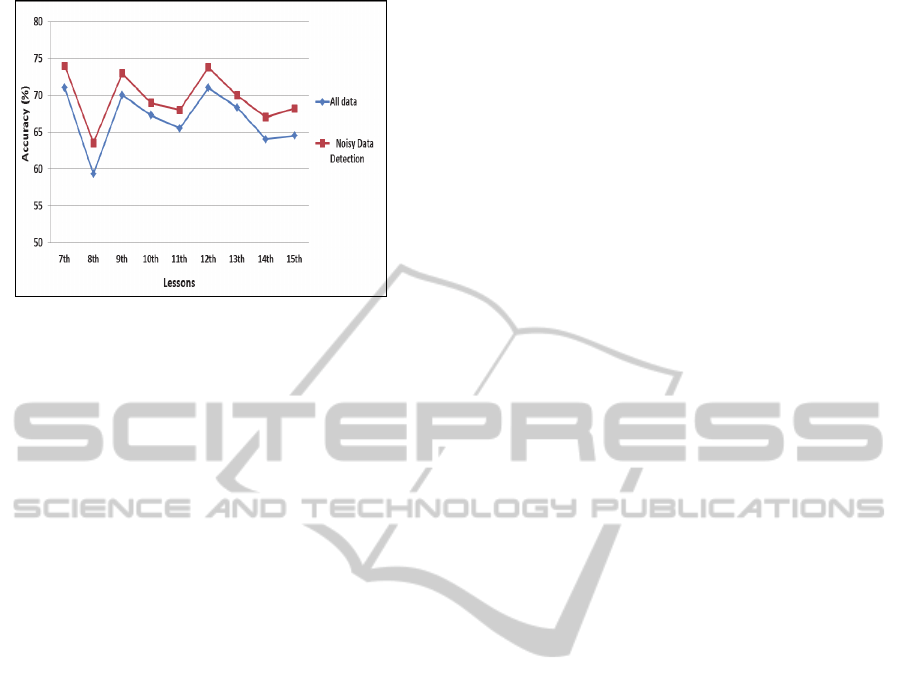
Figure 9: Average prediction accuracy of students’ grades
from lesson 7 to 15.
We believe this will help a teacher give advice to
students and improve their performance. In addition,
it leads to an important step for improving
performance of comment analysis and their learning
status prediction.
ACKNOWLEDGEMENTS
This work was supported in part by Project for
Fostering Value-Creation Advanced ICT Frontier
Human Resources by Fused Industry-University
Cooperation conducted by QITO, Kyushu
University under the MEXT, Japan, and JSPS
KAKENHI Grant Number 24500176 and 25350311.
REFERENCES
Adhatrao, K., Gaykar, A., Dhawan, A., Jha, R., &
Honrao,V., 2013. Predicting Students’ using ID3 and
C4.5 classification algorithms. International Journal
of Data Mining & Knowledge Management Process
(IJDKP), 3 (5), 39-52.
Antai, R., Fox, C., & Kruschwitz, U., 2011.The Use of
Latent Semantic Indexing to Cluster Documents into
Their Subject Areas. In: Proceedings of the Fifth
Language Technology Conference. Springer. ASME
Design Engineering Technical conferences,
DETC2001/DTM-21713.
Bachtiar, A. F., Kamei, K., & Cooper, W. E., 2012. A
Neural Network Model of Students’ English Abilities
Based on Their Affective Factors in Learning. Journal
of Advanced Computational Intelligence, and
Intelligent Informatics, 16 (3), 375-380.
Berry, W. M., Dumais, S., & O’Brien, G., 1995. Using
linear algebra for intelligent information retrieval.
SIAM Review, 37 (4), 573-595.
Bharadwaj, B. K., Pal, S., 2011a. Data Mining: A
prediction for performance improvement using
classification. International journal of Computer
Scien
ce and Information security (IJCSIS), 9 (4), 136-140.
Bharadwaj, B. K., Pal. S., 2011b. Mining Educational
Data to Analyze Students’ Performance. International
Journal of Advance Computer Science and
Applications (IJACSA), 2 (6), 63-69.
Botana, J., Leo, A., Olmos,R.,& Escudero,I., 2010. Latent
Semantic Analysis parameters for Essay Evaluation
using Small-Scale Corpora. Journal of Quantitative
Linguistics, 17 (1), 1–29.
Csorba, K., Vajk, I., 2006. Double Clustering in Latent
Semantic Indexing. In proceedings of SIAM, 4
th
Slovakan-Hungarian Joint Symposium on Applied
Machine Intelligence, Herlany, Slovakia.
Dhillon, I. S., Modha, D. S., 2001. Concept De-
compositions for Large Sparse Text Data Using
Clustering. Kluwer Academic Publishers, 4(1–2), 143–
175.
Dumais, S., 1991. Improving the retrieval of information
from external sourse. Behavior Research Methods,
Instruments, and Computers, 23, 229-236.
Goda, K., Hirokawa, S., & Mine, T., 2013. Correlation of
Grade Prediction Performance and Validity of-Self-
Evaluation Comments. SIGITE’13, Florida USA, 35-
42.
Goda, K., Mine, T., 2011. Analysis of Students’ Learning
Activities through Quantifying Time-Series
Comments. Proc. KES 2011, Part II (LNAI 6882),
154–164.
Hill, A., Dong, A., & Agogino, A. M., 2002. Towards
Computational Tools for Supporting the Reflective
Team. Artificial intelligence in Design ’02, Dordrecht,
Netherlands: Kluwer Academic Publishers, 305–325.
Kabakchieva, D., (2013). Predicting Student Performance
by Using Data Mining Methods for Classification.
Cybernetics and Information Technologies, 13 (1), 61-
72.
Kovacic, J. Z., Green, S. J., 2010. Predictive working tool
for early identification of ‘at risk’ students, Open
Polytechnic, New Zealand.
Landauer, T. K., Dumais, S. T., 1997. A solution to Plato's
problem: The Latent Semantic Analysis theory of the
acquisition, induction, and representation of
knowledge. Psychological Review, 104, 211-240.
Landauer, T. K., McNamara, D., S., Dennis, S., &
Kintsch, W., 2013. Handbook of Latent Semantic
Analysis, Lawrence Erlbaum Associates, Psychology
Press. New York, 2nd edition.
Mansur, M. O., Sap, M. & Noor, M., 2005. ‘Outlier
Detection Technique in Data Mining. A Research
Perspective’, In Postgraduate Annual Research
Seminar.
Minami, T., & Ohura, Y. 2013. Lecture Data Analysis
towards to Know How the Students’ Attitudes Affect
to their Evaluations. 8 International Conference on
Information Technology and Applications (ICITA),
164-169.
Osmanbegović, E., Suljić, M., 2012. Data Mining
Approach for Predicting Student Performance. Journal
EfficiencyofLSAandK-meansinPredictingStudents'AcademicPerformanceBasedonTheirCommentsData
73

of Economics and Business, X (1) 3-12.
Rosario, B., 2000. Latent Semantic Indexing: An
overview, INFOSYS 240, Spring (final paper).
Salton, G., McGill, M. J., 1983. Introduction to Modern
Information Retrieval, McGraw-Hill, New York.
Sembiring, M., Dedy, Z., Ramliana, S., & Wani, E., 2011.
Prediction of student academic performance by an
application of data mining techniques International
Proceedings of Economics Development and Research
IPEDR, 6.
Witter, D., Berry, M. W., 1998. Downloading the latent
semantic indexing model for conceptual information
retrieval. The computer journal, 41, 589-601.
Yadav, K., Bharadwaj, B. K., & Pal, S., 2011. Data
Mining Applications: A comparative study for
predicting students' performance. International journal
of Innovative Technology and Creative Engineering
(IJITCE), 1(12).
Zaiane, O., 1999. Principles of Knowledge Discovery in
databases, chapter 8. Data Clustering lecturing slides
for CmPUT 690, University of Alberta.
CSEDU2014-6thInternationalConferenceonComputerSupportedEducation
74
