
Statistical Process Control for a Limited Amount of Data
José Gomes Requeijo
1
, António Abreu
2,3
and Ana Sofia Matos
1
1
UNIDEMI, Departamento de Engenharia Mecânica e Industrial, Faculdade de Ciências e Tecnologia,
Universidade Nova de Lisboa, 2829-516 Caparica, Portugal
2
ISEL/IPL – Instituto Politécnico de Lisboa, Lisboa, Portugal
3
CTS – Uninova, Lisboa, Portugal
Keywords: SPC (Statistical Process Control), Q Control Charts, MQ Control Charts, Process Capability.
Abstract: Some production systems control many quality characteristics with a restricted amount of data, not allowing
a convenient estimation of the process parameters (mean and variance), thereby creating a difficulty in
implementing the traditional Statistical Process Control (SPC). In order to address this question, the
approach suggested is to adopt the developments proposed by by Charles Quesenberry, which consists in
the statistics sample transformation at time i. This transformation is based on a parameter estimation at time
(i – 1). This paper addresses two situations, the univariate and multivariate SPC, with the use of Q
dimensionless statistics. Both univariate (Q) and multivariate (MQ) statistics are distributed according to
standard Normal distribution. It is also suggested the application of new capability indices Q
L
and Q
U
to
study the univariate process capability, which are represented in the mean Q control chart to evaluate in real
time the performance of the various processes and predict the possibility of production of nonconforming
product, which will increase customer satisfaction. The methodology is applicable to different production
systems, both for industry and services. Based on a methodology developed, a case study is presented and
discussed.
1 INTRODUCTION
Initially the SPC was presented by Shewhart (1931)
in Bell Telephone Laboratories. The Shewhart’s
developments were a valuable contribution to the
continuous improvement of quality.
However, the traditional Shewhart control charts
have some limitations such as: it considers only a
characteristic of quality control, and its
implementation in a real process requires a large
amount of data. In order to implement these control
charts, it is necessary to ensure the following
principles:
1) The data is grouped in rational subgroups.
2) The sampling frequency must maximize the
possibility of variation between samples.
3) The data should be independent, that is,
ikik
x
( n,,i 1 ; m,,k 1 ), where
2
0
,N~ is a random variable, called white
noise.
4) The control limits are distant from the central
line (mean of the control variable) 3 standard
deviations of this variable, it means the
significant level is 0.27%.
5) The data has a Normal distribution with mean
and variance
2
(
2
,N~X ).
The current productive systems (lean production)
have distinct characteristics from those of the
Shewhart period (mass production). Nowadays,
firms have new constraints, such as: they produce
simultaneously a large number of different products
in small amounts and need to control, at the same
time, several quality characteristics. Consequently, it
is necessary to develop other approaches that meet
these new constraints. This topic has been the
subject of study by several researchers, such as
Bothe (1988), Wheeler (1991), Pyzdek (1993),
Quesenberry (1997), Montgomery (2012) and,
Pereira and Requeijo (2012), among other authors.
This approach is commonly known as the Short
Run SPC. When there is a restricted amount of data,
the estimation of the process parameters is not
possible. Thus, Quesenberry (1997) suggested the
application of a new kind of control charts, named Q
charts (univariate approach) and MQ charts
190
Gomes Requeijo J., Abreu A. and Matos A..
Statistical Process Control for a Limited Amount of Data.
DOI: 10.5220/0004812101900195
In Proceedings of the 3rd International Conference on Operations Research and Enterprise Systems (ICORES-2014), pages 190-195
ISBN: 978-989-758-017-8
Copyright
c
2014 SCITEPRESS (Science and Technology Publications, Lda.)
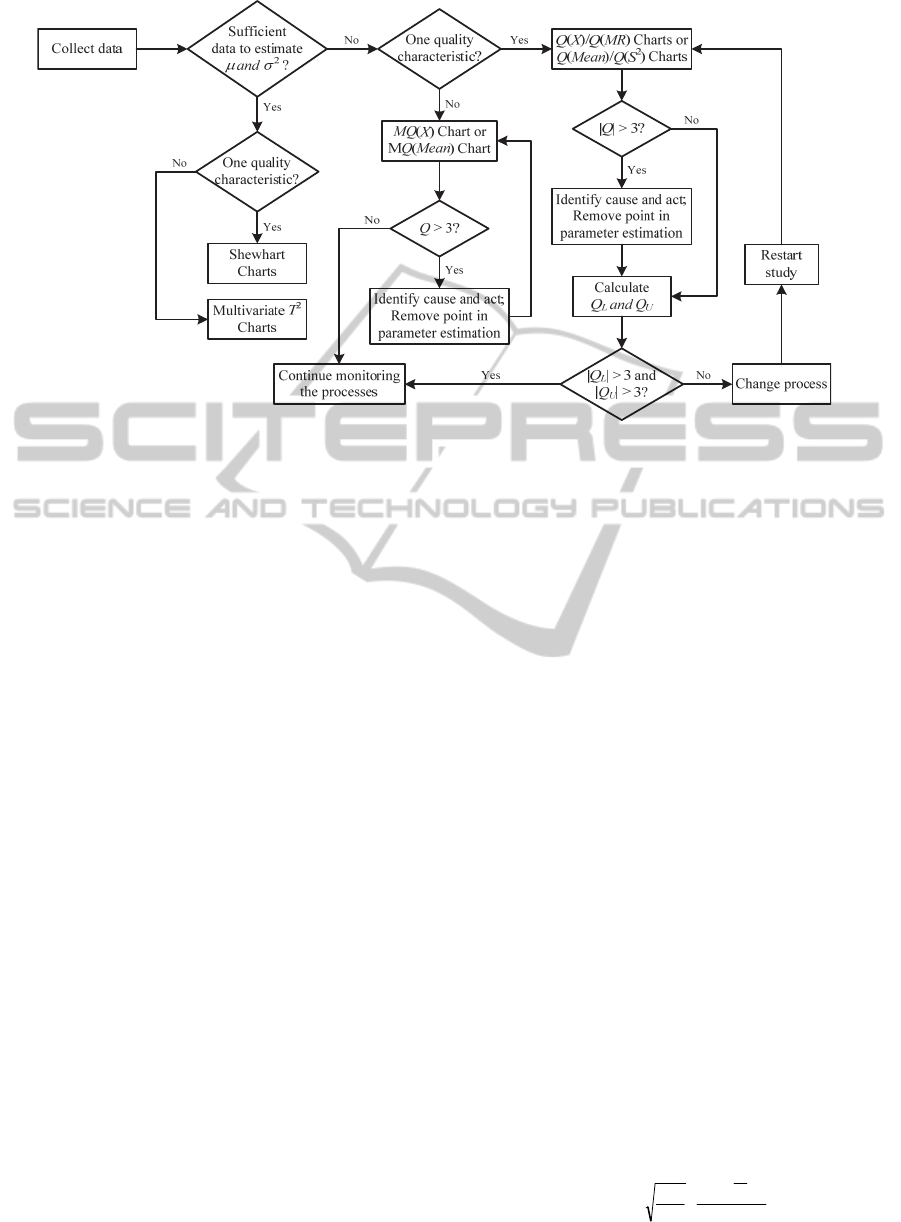
Figure 1: Methodology for implementation of SPC for a limited amount of data.
(multivariate approach). The implementation of
these control charts is done in order to include in the
same chart all products/quality characteristics, and
based on this approach it is possible to control the
stability of all processes.
In this paper the Short Run SPC approach is
discussed for continuous variables, when a restricted
amount of data in two distinct control contexts
(univariate and multivariate) exists.
In order to apply correctly the univariate and
multivariate SPC, the data must be Normality
distributed for all characteristics. To support a
continuous evaluation of the process capability, the
application of new indices Q
L
and Q
U
developed by
Pereira and Requeijo (2012) is suggested. The
implementation of these two indices allows the
capability of the process to be analyzed in real time.
In order to demonstrate the importance of these
charts and validate the methodology proposed in this
paper, a case study is presented and discussed.
2 METHODOLOGY
When there is a limited amount of data, that is, when
there is not enough information to properly estimate
the processes parameters, the authors of this paper
suggest the methodology presented in Figure 1.
3 SHORT RUN SPC TO A
LIMITED AMOUNT OF DATA
3.1 Univariate SPC
In some cases, due to the existence of a restricted
amount of data, process parameters cannot be
properly estimated, creating an obvious difficulty in
the construction of traditional Shewhart, Z and W
control charts. To answer this question, the adoption
of the methodology developed by Charles
Quesenberry is suggested, which consists in
transforming the quality characteristic X in a
variable Q, where X is a continuous variable. The
variable Q follows approximately the standard
Normal distribution, with zero mean and variance 1,
if the variable X is independent and approximately
Normal
2
,N . This method transforms the
statistics calculated at time i by estimating the
process parameters at time (i1), considering all data
prior to this time.
There are two situations to consider, the data are
samples or individual measurements.
3.1.1 Q Control Charts for Individual Data
The statistic Q at time i is calculated from the
measurement X at th3at moment, and it is defined by
4 3
1
1
1
2
1
,,i
S
XX
i
i
GXQ
i
i
i
iii
(1)
StatisticalProcessControlforaLimitedAmountofData
191

The variability process should be calculated based
on the moving range of two consecutive
observations. Thus, the statistic Q at time i, which is
obtained from the statistics at that moment MR, is
defined by
12 ; 6 4
2
2
2
2
2
1
1
i,,i
MRMR
MR
FMRQ
i
i
,ii
(2)
In equations (1) and (2) the following variables
denote:
X
i
– individual measurement at time i
1i
X – average of (i1) observations
1i
S – standard deviation of the sample of
(i1) observations,
MR
i
– moving range at time i
1
– inverse of the standard Normal
distribution function
G – Student-t distribution function,
21
,
F
– Fisher distribution function with
1
and
2
degree of freedom.
3.1.2 Q Charts for Subgrouped Data
The
XQ
statistic at time i is calculated from the
sample average
X
, defined by
i
j
j
i
j
jji,pii
p,i
ii
i
ii
i
iii
SSn
s
XX
nn
nnn
,,i,GXQ
i
11
22
1
1
1
1
11
1
;
32
1
(3)
Also, the sample variance is transformed in the
Q(S
2
) statistic, defined by
2
1
2
12
32
11
i,pii
i,ii
SS
,,i,FSQ
ii
(4)
In equations (3) and (4) the following variables
denote:
n
i
sample size at time i
i
X average of the sample i
i
X grand average of i samples
2
i,p
S
pooled variance of i samples
3.1.3 Control Limits
The Q statistics are random variables with standard
Normal distribution. Thus, the control limits are
3
(
%.270
) for
XQ ,
MRQ ,
XQ and
2
SQ
charts.
One of the serious problems of the
Q charts is its
poor sensitivity in the detection of special cause of
variation. In order to solve this drawback, it is
important to apply rules to increase the sensitivity of
the charts. The application of Rule 1 (a point outside
the control limits) and Rule 6 (four out of five
consecutive points in zone B or A on the same side
of the center line) referred to in ISO 7870-2:2013 is
suggested.
3.1.4 Process Capability
The application of the Q
L
and Q
U
capability indices
developed by Pereira and Requeijo (2012) is
advisable; these indices are defined at time
i by
i
i
i
L
ˆ
k
ˆ
LSL
Q
ˆ
(5)
i
i
i
U
ˆ
k
ˆ
USL
Q
ˆ
(6)
In equations (5) and (6) USL and LSL are
respectively the upper and lower specification limits
and
k is the minimum value to processes capability.
3.2 Multivariate SPC
Similarly to univariate SPC, when there is a limited
amount of data, the best solution to implement the
multivariate SPC is to use the
Q statistics. The
present developments are based on the assumption
that the joint distribution of
p variables is a
multivariate Normal distribution
,N
p
. The
control of the mean vector is made by
X
MQ or
X
MQ
charts.
3.2.1 MQ Control Charts for Individual
Data
The X vector is transformed in the MQ statistic.
Considering the intention of detecting shifts between
X vector and vector and the structure of the
statistic,
MQ at time i is
XX SXX
X
,p,p i,
iip
pii
f
.fA
AF;maxMQ
i
i
-
i-
i
ii
ipi,pii
32
2
11
0
1
1
1
1
1
1
(7)
ICORES2014-InternationalConferenceonOperationsResearchandEnterpriseSystems
192
Whiteness (Paint 88)
Q
(
X
) CHART
-5
-3
-1
1
3
5
1 3 5 7 9 11 13 15 17 19 21 23 25
Batch n.
Q (X)
Q(X) LCL CL UCL QL Qu
De nsity (Paint 88)
Q
(
X
) CHART
-6
-4
-2
0
2
4
6
1 3 5 7 9 11 13 15 17 19 21 23 25
Batch n.
Q (X)
Q(X) LCL CL UCL QL Qu
Opacity (Paint 88)
Q
(
X
) CHART
-5
-3
-1
1
3
5
1 3 5 7 9 11 13 15 17 19 21 23 25
Batch n.
Q (X)
Q(X) LCL CL UCL QL Qu
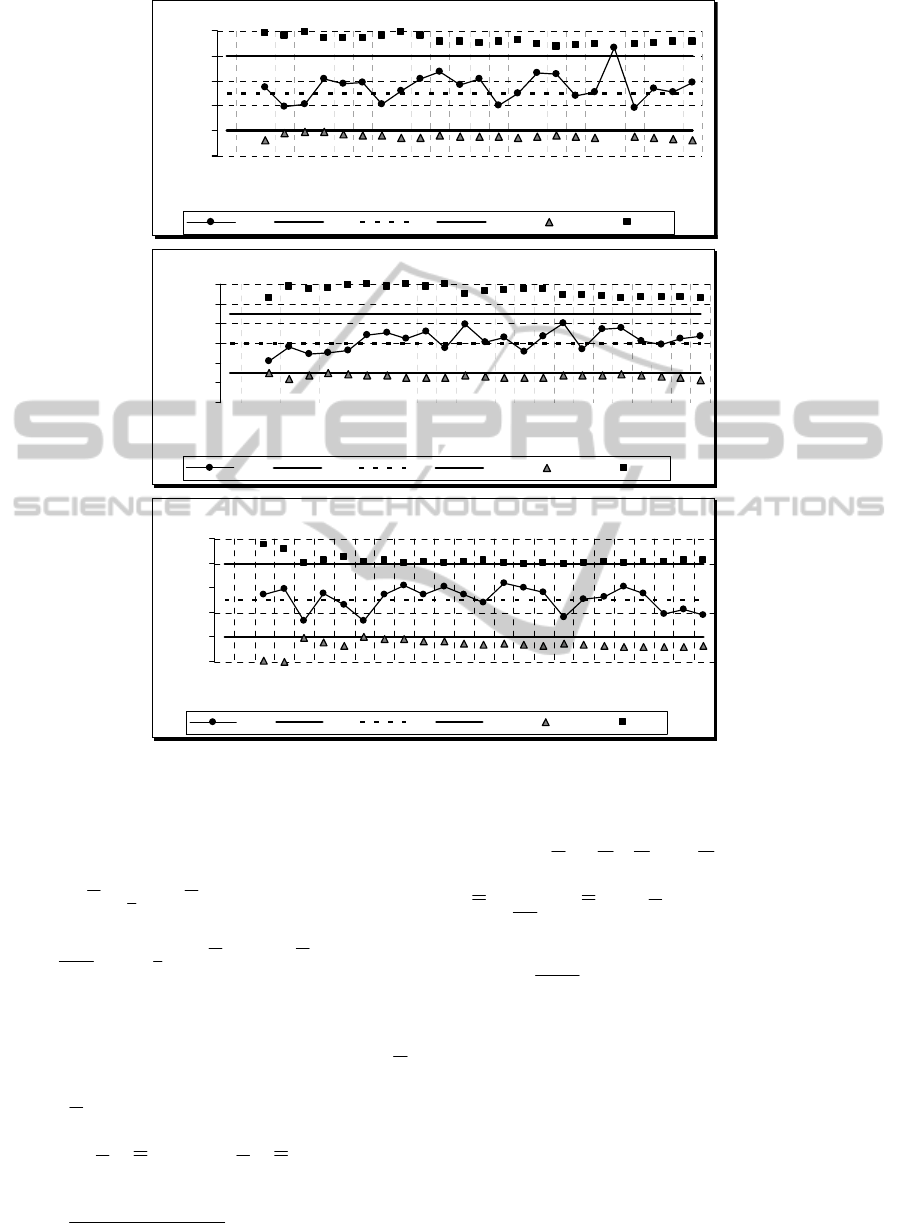
Figure 2: Q
X
Charts for Whiteness, Density and Opacity of the Paint 88.
where
ipiii
X,,X,X X
21
(8)
i
ii
i
i
XX X
1
1
1
(9)
11
1
1
1
2
i
i
i
iii
ii
i
XXXX S S
(10)
3.2.2 MQ Charts for Subgrouped Data
The MQ statistic at time i is calculated from X
vector at that time by
XXSXX
X
,,, i
iNpN
piNNn
g
.gA
AF;maxMQ
ii
iii
ii
-
pool,i
ii
r
ipiN,p
i
i
i
32
1
0
1
1
1
1
1
1
(11)
where
ipiii
X,,X,X X
21
(12)
ii
i
i
i
i
i
i
nnN;nN
N
1
1
1
1
XXX
(13)
0S
S S S
0
11
11
1
1
pool,
iipool,ii
i
pool,i
niN
N
(14)
3.2.3 Control Limits
As the T
2
charts, the MQ charts only contemplate the
upper control limit (UCL). The lower control limit
(
LCL) is zero and the upper is + 3.
StatisticalProcessControlforaLimitedAmountofData
193
4 CASE STUDY
To illustrate the potential applicability of the Short
Run SPC approach for continuous variables, when a
restricted amount of data exists, two distinct control
charts (univariate and multivariate) will be applied.
The study focuses on production of paint, named
"Paint 88." With the purpose of controlling three
quality characteristics: whiteness, density and
opacity, 25 sample batches of this paint were
analyzed.
The univariate approach contemplates the
construction of
Q
X
chart for each one of three
characteristics, as shown in Figure 2. In order to
calculate the
Q statistic, equation (1) was used.
However, to calculate indices Q
L
and Q
U,
equations
(5) and (6) were used.
Looking at univariate
Q
X
chart (figure 2) it is
possible to detect a special cause of variation related
to whiteness characteristic (see batch 21). However,
all characteristics have capability since
3
L
Q and
3
U
Q occurs in all batches.
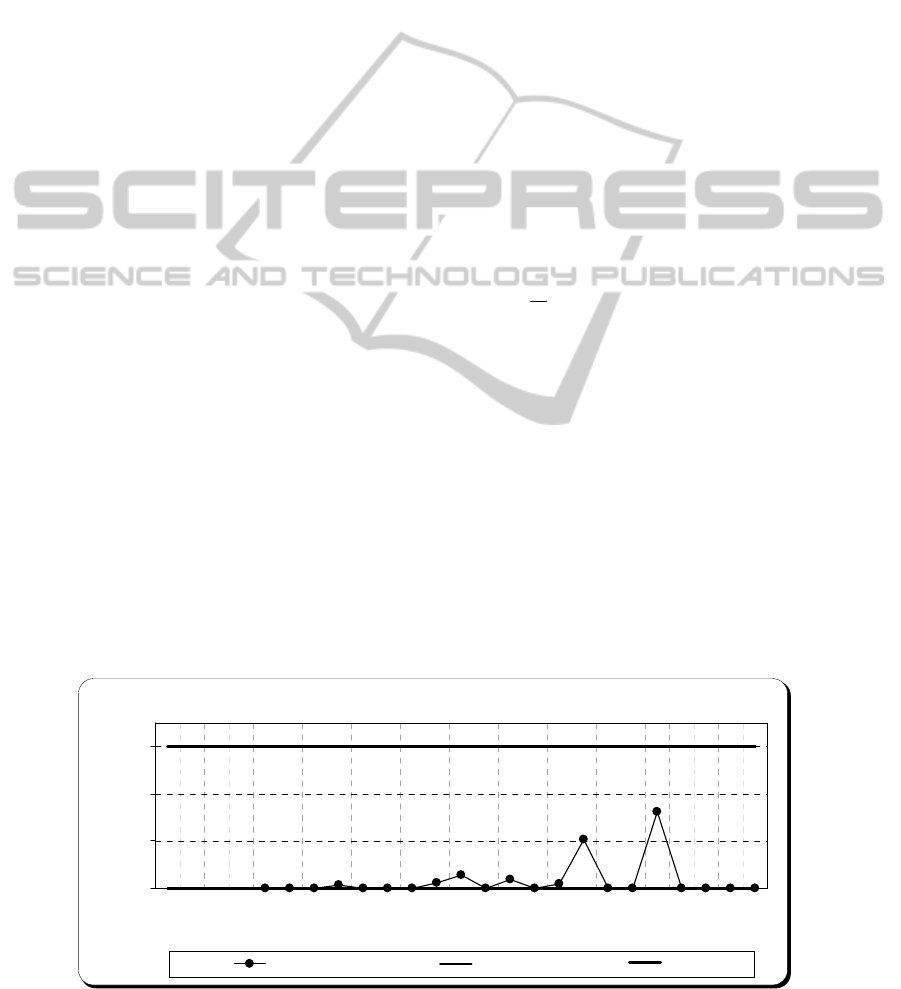
The multivariate approach contemplates the
construction of only one
MQ
X
chart, as shown in
Figure 3, and the multivariate statistics of the 25
sample batches were calculated based on equations
from (7) to (10).
Analysing the
MQ
X
chart for paint 88, it is
possible to verify that there are no problematic
situations, and therefore, we might conclude that the
process is stabilized for the three quality control
characteristics.
5 CONCLUSIONS
When there is a restricted amount of data, it is
impossible to implement the traditional SPC,
univariate or multivariate, because in these scenarios
it is necessary to estimate the process parameters.
The methodology presented in Figure 1, has
several advantages over traditional approaches such
as:
1)
Q charts allow the statistical control of all
products/quality characteristics in the same
document (control chart), even when there is
insufficient data to conveniently estimate the
process parameters (mean and variance);
2)
MQ charts allow the simultaneous control of
several statistical quality characteristics of
various products in the same document, even
when there is insufficient data to favorably
estimate process parameters (mean vector and
covariance matrix);
3) it allows the study of different characteristics in
the same chart;
4) it simplifies the processes analysis;
5) based on application of the capability indices
Q
L
and
Q
U
in the univariate approach (
XQ charts
or
XQ
) it allows the monitoring of the process
capability, revealing an important added value;
6) Using
Q
L
and Q
U
indices, permits the study of
the process capability in real-time, and reduces
the probability of producing nonconforming
units.
On the other hand, one disadvantage of
Q control
charts is the difficulty in analyzing the existence of
non-random patterns; consequently, this limitation
increases with the number of products/quality
characteristics.
Another disadvantage of the
Q and MQ control
charts is the poor sensitivity in detecting special
cause of variation, especially at the beginning of the
study. Although the lack of sensitivity in detecting
Paint 88
MQ
(
X
) CHART
0
1
2
3
12345678910111213141516171819202122232425
Batch n.
MQ (X)
MQ(X) LCL UCL
Figure 3: MQ
X
Chart for the characteristics Whiteness, Density and Opacity of the Paint 88.
ICORES2014-InternationalConferenceonOperationsResearchandEnterpriseSystems
194

non-random patterns is a limitation of the Q and
MQ control charts, its use is of great importance and
utility, since traditional approaches based on
univariate and multivariate analysis cannot be
implemented when there is a restricted amount of
data.
One way to increase the sensitivity of these
techniques is to use memory charts, such as
Cumulative Sum charts (e.g.
CUSUMQ and
MCUSUMQ) and Exponentially Weighted Moving
Average charts (e.g. EWMAQ and MEWMAQ), as
mentioned in Requeijo and Pereira (2012).
REFERENCES
Bothe, D. R., 1988. SPC for Short Production Runs,
Quality, Vol. 27, pp. 58-59, 1988.
Montgomery, D. C., 2012. Introduction to Statistical
Quality Control, 7th Edition, John Wiley & Sons, Inc.,
New York.
Pereira, Z. L. e Requeijo, J. G., 2012, Quality: Statistical
Process Control and Planning, 2
th
Edition, Fundation
of FCT/UNL, Lisbon (in portuguese).
Pyzdek, T., 1993. Process Control for Short and Small
Runs, Quality Progress, Vol. 26(4), pp. 51-60, 1993.
Quesenberry, C. P., 1997. SPC Methods for Quality
Improvement, John Wiley & Sons, Inc., New York.
Shewhart, W. A., 1931. Economic Control of Quality of
Manufactured Product, D. Van Nostrand Company,
Inc., New York.
Wheeler, D. J., 1991. Short Run SPC, SPC Press,
Knoxville, Tennessee.
StatisticalProcessControlforaLimitedAmountofData
195
