
Structuring Software Measurement
Metrication in the Context of Feedback Loops
Jos J. M. Trienekens
1
and Rob J. Kusters
2
1
Department of Information Systems, Eindhoven University of Technology, Eindhoven, The Netherlands
2
Department of Management Sciences, Open University The Netherlands, Heerlen, The Netherlands
Keywords: Measurement, Multi-level Feedback Loop, Process Oriented Metrics.
Abstract: This paper presents results of a case study in a software engineering department of a large industrial
company. This software engineering department struggles with the monitoring and control of the
performance of software projects. The current measurement processes doesn’t provide adequate and
sufficient information to both project and organisational management. Based on an analysis of the current
measurement processes four guidelines for measurement process improvement have been proposed.
Following these guidelines a three-level feedback loop has been developed and been implemented. This
multi-level feedback loop distinguishes measurement, analysis and improvement on respectively the project,
the multi-project and the organisational level. In the context of this feedback loop new ‘process oriented’
metrics have been identified in collaboration with project and organisational management. Preliminary
results show that these ‘process oriented’ metrics, i.e. regarding different types of effort deviations, provide
useful insights in the performance of software projects for managers on the different levels of the
implemented feedback loops.
1 INTRODUCTION
To be competitive in the current economy, more and
more software development organisations strive for
an improvement of their processes. Several
approaches have been developed to improve
software development processes (Balla et al., 2001)
(Unterkalmsteiner, 2012). One of the kernel
activities in software process improvement is the
development and usage of measurement
programmes, in particular the application of well-
defined metrics to quantitatively improve software
processes. Measurement is however a complex
phenomenon in the software industry. Different
levels of maturity call for different types of
measurements. E.g. particularly advanced
measurements only make sense on higher maturity
levels and should only be collected if the
organisation has reached these levels (Oman and
Pfleeger, 1997), (CMMI Product Team, 2010).
Omand and Pfleeger also stress the importance of
recognising differences in the required measurement
information at different levels in the organisation. A
project manager will need fine-grained control over
his individual project in order to manage its
performance effectively. On an organisational level,
managers need information based on aggregated
data, e.g. from a cluster of projects, to identify
general trends in performance, efficiency, quality or
productivity. These data can be provided by a
dedicated organisational unit, e.g. an ‘Experience
Factory’ in the terminology of (Basili and Rombach
1988), (Basili et al., 2010). Such a unit can support
the different management levels with metric
definition, data collection and analysis, and
information exchange on project performance. This
paper presents results of a case study on
measurement and feedback in a software
engineering department.
In section 2 the software engineering department
and its problems with respect to measurement and
performance control are presented. On the basis of
the identified shortcomings, section 3 proposes a set
of four guidelines to improve the organisations’
measurement process. Section 4 presents the
application of the guidelines in the development of a
three-level feedback loop. Section 5 reports on main
results of GQM-based ‘process oriented’ metric
identification, and the collection and the analysis of
measurement data. Section 6 ends with conclusions
129
J. M. Trienekens J. and J. Kusters R..
Structuring Software Measurement - Metrication in the Context of Feedback Loops.
DOI: 10.5220/0004811401290136
In Proceedings of the 16th International Conference on Enterprise Information Systems (ICEIS-2014), pages 129-136
ISBN: 978-989-758-028-4
Copyright
c
2014 SCITEPRESS (Science and Technology Publications, Lda.)
and recommendations for future research.
2 THE CASE STUDY
ENVIRONMENT
2.1 Application Development at AS
The software development department, Application
Services (AS), develops and maintains software
applications for its customers. The AS development
process consists of the following phases: opportunity
management, solution design, solution delivery and
customer satisfaction management. Solution design
is the phase where estimates are generated regarding
the quality, efficiency and productivity of software
development projects. In particular in this phase
metrics are being defined and measurements are
being carried out. In the solution delivery phase the
actual software applications are being build and
implemented at the customer's site. The first and last
phase, respectively opportunity management and
customer satisfaction, are the phases where
interaction with customers plays a central role. The
organisation is regularly being assessed by
independent assessors regarding its level of maturity.
Over the last ten years much effort has been spent
already by the Software Engineering Process Group
(SEPG), to reach a higher level of maturity. The
SEPG is a department within the organisation that is
responsible for process improvement based on
requirements that emerge from the CMMI. The
SEPG supports in particular the application and
deployment of the Quality Management System
(QMS) in the organisation. Project managers can
e.g. obtain advice regarding the application of
metrics, the implementation of quality assurance
procedures and the selection of tools. They can also
request training or workshops on measurement
techniques and/or tool usage.
2.2 Measurement at AS
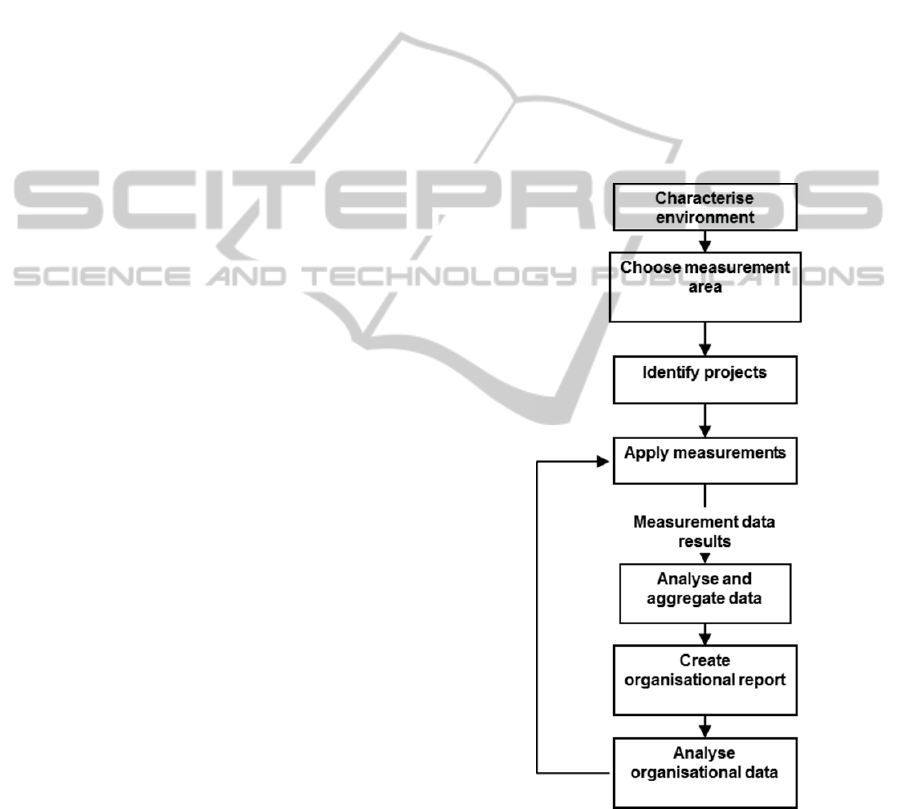
Within the AS department, measurements are
implemented on the basis of the so-called Quality
Trend Measurement (QTM) process, see Figure 1.
The QTM processes is one of the kernel processes
that is specified in detail in the QMS. The SEPG
collaborates with both the AS organisational
management and the project management, e.g. in
defining the What and How of monitoring project
performance and the application of measurement.
The steps in the QTM process are as follows.
1: Characterise Software Project Environment. An
overview should be obtained, on the organisational
level, of the software engineering environment in
which the performance has to be monitored and
controlled. A list of recently finished and running
projects is being used. The characteristics of
projects, in terms of complexity, size, risks, and
costs provide the SEPG and the organisational
management with information to cluster projects and
to identify information needs regarding project
performance.
2: Choose Measurement Area. The so-called
measurement area is determined by the SEPG and
organisational management, based on their interests
in specific aspects of project performance, e.g.
product quality, efficiency and productivity. Often a
diversity of interests and viewpoints is investigated,
with as consequence a large amount of topics and
issues to be monitored.
Figure 1: The Quality Trend Measurement process.
3: Identify Projects. Particular projects are being
selected, e.g. projects with a high risk, high
complexity, high time-pressure, large product size
etc. This selection process is supported by the SEPG
and the result is agreed upon by organisational
management. Next the measurement interests
regarding these projects are being determined.
ICEIS2014-16thInternationalConferenceonEnterpriseInformationSystems
130

4: Apply Measurements. With respect to the selected
projects and the determined measurement interests at
the organisational level, project managers have to
determine metrics in order to monitor the
performance of their projects. The SEPG collects the
measurement data of the different projects on an
end-of-project basis, which means that projects
submit their data only at the end of the projects.
5: Analyse and Aggregate Data. The SEPG analyses
project data from the viewpoints as determined by
organisational management. Subsequently the SEPG
aggregates data from the various projects on a
quarterly basis.
6: Create Organisational Report. Based on the
aggregated measurement data, organisational reports
are developed that show how the (selected) projects
perform from the viewpoints as defined by the
organisational management.
7: Analyse Organisational Data. On the
organisational management level the reports are
studied and analysed. Consequently changes can be
made to the selected measurement area, the
performance aspects to be monitored, and even
changes can be suggested regarding the usage of
particular metrics on the project level.
An important aspect of the QTM, see Figure 1, is
the feedback loop between step 4: Apply
measurements, and 7: Analyse organisational data.
This loop directly links the organisational level to
the project level.
2.3 Problems in the QTM Process
Semi-structured open interviews have been carried
out with eight project managers (so-called Delivery
Project Executives) and three managers (so-called
Sector Delivery Executives) on the organisational
level to investigate the current problems in the QTM
process. Main interview subjects were the definition
of the measurement area, the preferred measurement
interests on the organisational level, the definition
and application of measurements and metrics on the
project level and their difficulties, and the
performance of the current feedback loop, e.g. its
effectiveness, regarding both the organisational level
and the project level. The interviews have resulted
primarily in inter-subjective (qualitative) results, e.g.
due to the restricted time and number of
interviewees. The following problems have been
identified.
2.3.1 Measurement Problems on the Project
Level
The first problem that has been identified is the
mismatch between the information needed on the
organisational level and the data collected at the
project level. Project managers had different
interests in data as compared to senior management.
Project managers complained that the SEPG often
presses them to use metrics that are marginally
relevant regarding the control of their projects.
These measurements take much time and effort.
Also the information that they get back from the
organisational level was of little relevance for them.
Regarding their own needs and interests, these
project managers defined their own measurements
and metrics. In particular ‘product oriented’
measurements were used, such as function points,
LOC, etc. But also from the viewpoint of customers
the user satisfaction level (e.g. on collaboration), and
team communication are being measured). Often
these specific ‘product and project’ data were not of
interest from an organisational point of view. Project
managers also indicated that they lacked skills to
define measurements and to collect data.
Summarising, it can be stated that controlling project
performance on the project level is only loosely
coupled to control at the organisational level.
Apparently the existing feedback loop is insufficient.
2.3.2 Measurement Problems on the
Organisational Level
From the interviews with the three senior managers
it appeared that on the organisational level the
information needed from the projects, to control
project performance, is defined in a rather
unstructured way. In so-called performance control
sessions, senior managers try to get consensus about
the way the performance of projects should be
monitored and controlled. However, sometimes only
particular project characteristics (e.g. size, number
of engineers) are mentioned of clusters of projects
that should be monitored, while in other sessions
very detailed metrics (e.g. product size, function
points) are being defined for particular projects.
Both for the SEPG and the project managers it is
difficult to derive useful and clear metrics from the
information provided by the senior management
sessions, and as said before: they define their ‘own’
metrics. As a consequence the reports for the
organisational management that are being developed
on the basis of the collected project data are often
not useful. The same counts for the information that
is fed back to the project management by senior
management. Summarising it was concluded that
there exists a clear mismatch between the
organisation level and the project level regarding the
StructuringSoftwareMeasurement-MetricationintheContextofFeedbackLoops
131

way metrics and measurement should be defined to
monitor and control the performance of the projects.
3 DERIVING GUIDELINES TO
IMPROVE THE QTM PROCESS
The findings from the interviews have been used to
determine improvements in the QTM process. One
of the most important aspects of any process
improvement programme is the definition of clear
and effective feedback loops, (Basili, 1996;2010). A
feedback loop in a measurement process should give
information back to individuals or a group on a
particular management level, on information that
was provided earlier by them. As such it enables in
particular control between management levels. This
is called a two-level feedback loop. However, also
on one particular management level a feedback loop
can be implemented. In that case, data is collected
during a period of time within running development
projects. On regular intervals this data is analysed by
the project management itself to monitor and control
projects. This is called a one-level feedback loop.
Both types of feedback loops are important to keep
control over project results and to take adequate
actions for improvement. An important
characteristic of feedback loops is that they should
be closed. This means that data collected and
analysed on one management level should receive a
useful response from the other level. The same
counts for the one-level feedback loop. Data
collection should serve the project management with
useful information to control and/or improve the
project. Based on these considerations the following
guideline has been formulated: Guideline 1: Identify
the feedback loops required in the QTM process, and
close them.
Measurements and metrics are currently defined
in an unstructured and often ad-hoc way. This counts
for both the organisational and the project level. As
a consequence too many metrics are being used and
much irrelevant data is collected on the project level.
Besides the metrics that have to be used from the
perspective of the organisational management level,
project managers define their own metrics and
collect data from their own point of views. To
improve the situation the so-called Goal Question
Metric method has been implemented. The GQM
method facilitates the identification and the
definition of suitable metrics, on the basis of
explicitly defined business and project goals, see
(Basili et al., 2010), (van Solingen and Berghout,
1999). Therefore the second guideline has been
specified: Guideline 2: Derive metrics explicitly
from business goals by making use of the Goal
Question Metric method.
(Oman and Pfleeger, 1997) and (Basili et al,
2010) recommend to keep the set of metrics to be
used small. They both explicitly state that
measurements should be as simple as possible. E.g.
(Oman and Pfleeger, 1997) mentions that metrics
can only be defined and applied in case that the
particular artefact to be measured is completely
known. Both authors state that measurements should
be embedded as much as possible into the
engineering process itself, instead of leading to extra
overhead and work. Similar results are found by
(Jäntti et al., 2011). Based on this a third guideline
has been specified: Guideline 3: Keep measurement
as simple as possible, let senior management and
project management strive at a minimum set of
agreed metrics.
Project managers feel that they lack the skills to
define metrics and to do proper analysis on collected
data, see section 2. This support should be given by
an independent organisational unit that gains
experiences from various projects and that provides
support on the basis of the knowledge gained. The
Experience Factory is a concept that has been
developed by Basili as part of the TAME project
(Basili and Rombach, 1988), (Basili et al, 2010). An
Experience Factory is separated from the Software
Factory where the engineering and project
management takes place. Measurements and metrics
are a key area of research of an Experience Factory,
(Houdek et al., 1998). The AS development
organisation already applies some of the Experience
Factory concepts, and the SEPG fulfils already
particular aspects of the Experience Factory, such as
the independent analyses of the collected project
data and the aggregation and the development of
management reports. However, until now hardly any
support is given to support the software development
organisation to learn from experiences in a planned
and structured way. Therefore a fourth guideline has
been developed: Guideline 4: Let the AS
development organisation benefit from a stricter
implementation of the Experience Factory concept at
the SEPG, e.g. learning from experiences on both
management levels.
4 IMPROVING THE QTM
PROCESS
First the QTM process has been redesigned with
ICEIS2014-16thInternationalConferenceonEnterpriseInformationSystems
132
respect to feeding information back to the different
management levels, see guideline 1 of the previous
section. Second, the way measurements and metrics
are being identified and defined is improved by
applying the GQM method on different management
levels, see guideline 2 in the previous section.
Regarding guideline 3 and 4 the SEPG has put
restrictions to the usage of metrics (e.g. a limited set
of metrics), and has set up small-scale measurement
experiments. The goal of the latter is to introduce
'learning-by-doing' regarding metric definition, data
collection, and information feedback in the QTM
process.
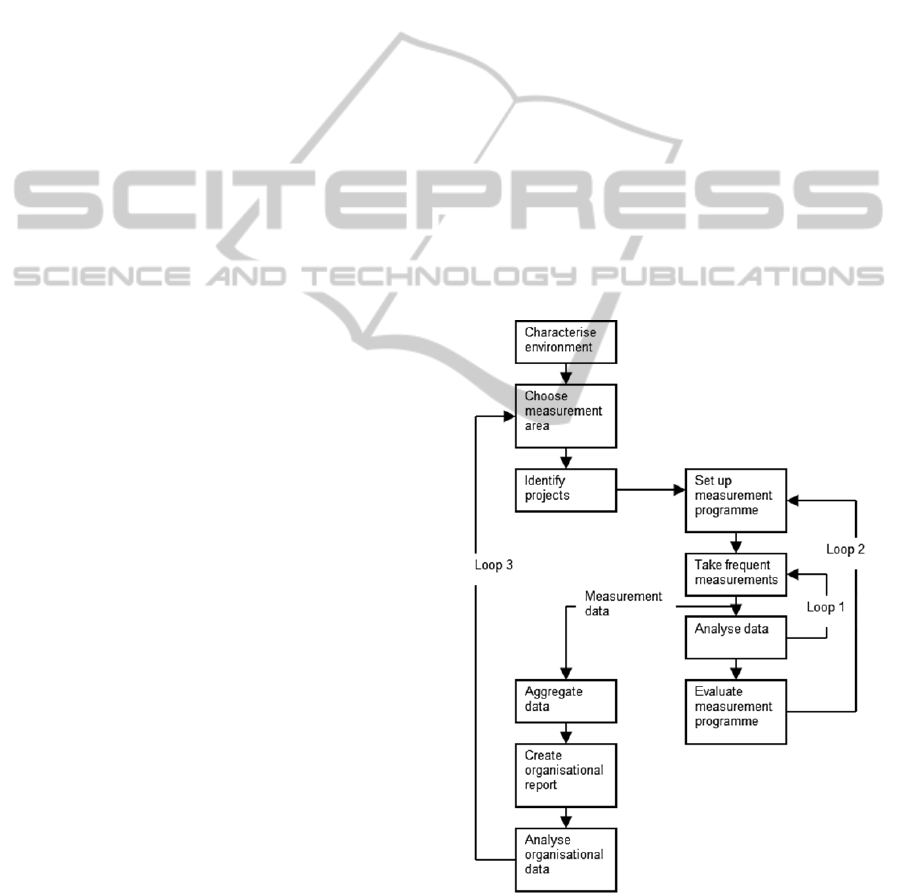
4.1 Implementing a Three-level
Feedback Loop
First it was decided to define explicitly a
measurement process on the project management
level with its own feedback loop. On the project
level the project managers will be supported by the
SEPG to define measurements and metrics for their
own projects, on the basis of the GQM method.
Starting point are the project goals that have to be
defined by the project managers themselves, before
metrics can be defined. Project goals can vary from
e.g. customer related goals such as customer
satisfaction, resource related goals such as team
communication, but also from goals with respect to
process quality, e.g. effort spent and productivity.
This project management feedback loop is depicted
in Figure 2 as “loop 1”.
Project managers need also to compare their own
projects with regard to the performance of other,
similar projects. Also, on the organisational level,
information is needed on the performance of
particular types or clusters of projects. Because of
these two different but related information needs a
so-called multi-project level is introduced, see
Figure 2 “loop 2”. On this multi-project level a
measurement programme is developed for a
coherent cluster of projects. Such a project cluster is
determined by the SEPG in collaboration with
managers on the organisational level. To determine
the information required, here also the GQM method
is used to determine project performance aspects that
are of interest for organisational management. The
SEPG supports this GQM process and subsequently,
and in collaboration with the organisational
management, links their information needs to
particular projects. Figure 2 shows as “loop 2” the
feedback from data of a cluster of projects to the
defined measurement programme.
However, the collected data on this multi-project
level, is also analysed and aggregated by the SEPG
from the viewpoint of the organisational
management. This leads to a third feedback loop, i.e.
a feedback loop to provide information from the
multi-project level to the organisational level. This
third feedback loop, “loop 3” in Figure 2, provides
the organisational management with information, on
the performance of a particular cluster of projects,
from the point of view of their business goals. This
information can be used to reconsider defined
business goals on the organisational level, to extend
or change the measurement and metrics defined on
this level, or to take action with respect to project
management on the project level.
Figure 2 shows that the middle feedback loop
(“loop 2”) bridges the gap between the information
and measurement needs on the organisational level
(e.g. uniform measurement, interests in particular
types of projects, aggregated information, regular
mid-term interval feedback), and the project level
(e.g. individual measurement preferences, detailed
information, short-term feedback).
Figure 2: the new three-loop QTM process.
StructuringSoftwareMeasurement-MetricationintheContextofFeedbackLoops
133
5 EXPERIMENTAL
MEASUREMENTS ON
THE MEASUREMENT
PROGRAMME LEVEL
To verify whether the middle feedback loop
improves the QTM process, small-scale
experimental measurements have been executed. On
the organisational level the so-called measurement
area has been defined, based on explicit business
goals from this level. Central aspects of this
measurement area are respectively: multi-project
performance, and the selection of particular high risk
projects.
5.1 (Re) Defining Measurement
The measurement area that has been defined was
described as 'the productivity of selected software
development projects'. This was motivated by two
identified major business goals at the organisational
level, respectively higher profits of software
development projects and an improved position of
the software development department in the market.
Over the years the metric that was being used at
the project level to measure productivity, was based
on function points. Function points were considered
to be a standard way to measure the functionality of
an application and thereby the output of
development projects. The functionality as output
and the developer effort as input leads to the metric
of function points per hour of development. A
problem with this metric is that it is only possible to
measure productivity after a project has been
finished, so after the functionality of an application
has been established. From discussions on how to
measure productivity, by using the GQM method
and supported by the SEPG, it appeared that both
management on the organisational and the project
level were interested in the measurement of
productivity during the projects. They called this an
'early warning system' to monitor running projects
on a continuous basis, and to execute adequate
support activities. As a consequence new ‘process
oriented’ metrics were needed to measure the
particular productivity aspects. Searching for a
way to monitor productivity on a continuous basis,
the way projects were being managed was
investigated further by using the GQM approach. It
appeared that project managers are developing
schedules by splitting up their projects into separate
activities. These activities are then planned with start
and end dates. In a project manager’s planning,
amounts of effort (person hours per activity) are
being estimated and assigned to the different
activities. This is called the estimated effort. By
calculating the effort actually spent on an activity
when completed, the ‘effort deviation’ can be
determined as ‘estimated effort’ divided by ‘actual
effort’.
However, if an effort deviation occurs, which
means that a completed activity took more or less
effort than initially estimated, then this does not
necessarily mean a lower or higher productivity. It
might also mean that the estimated effort for the
activity was wrong, and that completing the activity
entailed more or less work, or that the resources (i.e.
the engineers) were more or less productive. When
effort deviations are monitored by project managers,
to follow the productivity of their projects, they
should assess both, per deviation, whether an effort
deviation is caused by a wrong estimation or by a
higher or lower productivity of engineers. We call
these two different causes of effort deviation
respectively ‘(resource) productivity’ related and
‘(schedule) estimation’ related deviations. A
(schedule) estimation related deviation is caused by
the scheduled effort being calculated too low or too
high by a project manager. A (resource) productivity
related deviation is caused by the engineering teams
that are being more or less productive as expected.
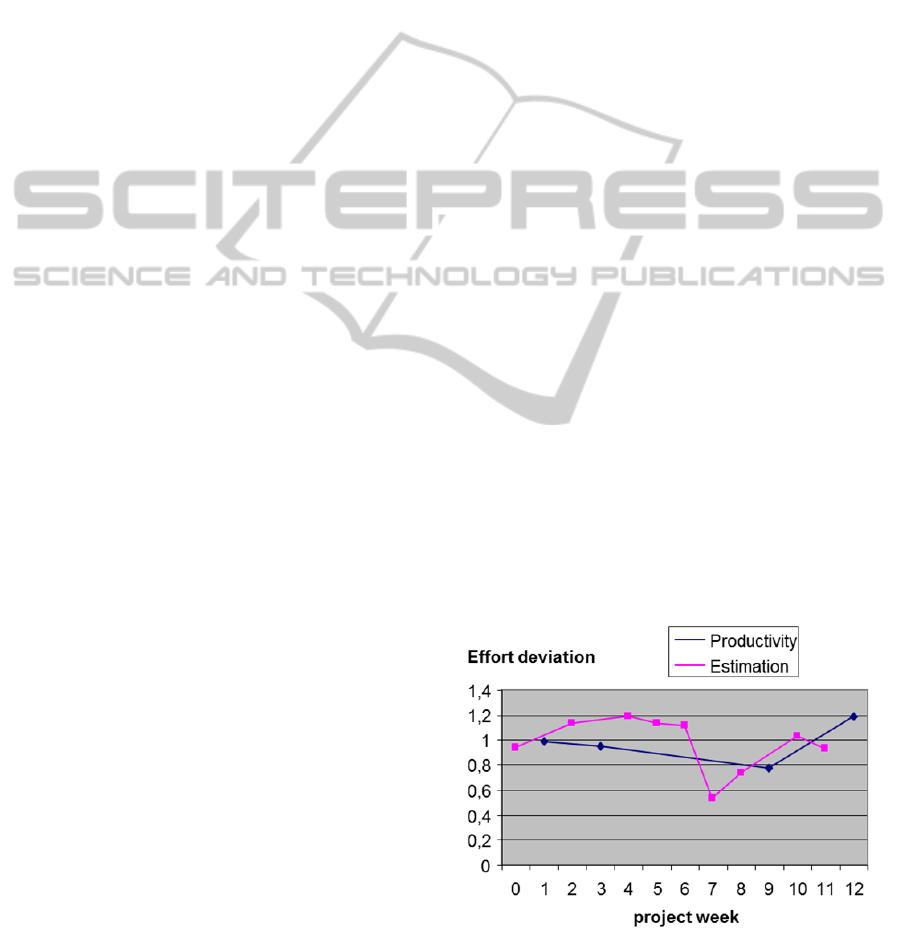
5.2 Experimental Measurement Results
In several projects, and during a number of months,
these ‘process oriented’ effort deviation metrics
have been applied and data has been collected. All
deviation data from these experiments have been
placed in control charts, see Figure 3.
Figure 3: Example of a control chart showing two types of
effort deviations in a time-frame of 12 weeks.
ICEIS2014-16thInternationalConferenceonEnterpriseInformationSystems
134
The two different causes of the deviations are
reflected by different colours. If an activity took
more time (e.g. in person hours) than estimated, the
deviation ratio is smaller than 1, if it took less, it is
higher than 1. For example in week 7 the sharp drop
shows that the engineering activities took much
more time than estimated (so a ‘weak’ estimation).
In case a lot of deviations are caused by wrong
(schedule) estimations a project manager should take
action to improve the used estimation procedures (or
his so-called rules of thumb or best practices). In
case a lot of deviations are (resource) productivity
related, the project manager should take action to
find out the root causes for this, e.g. insufficient
skills of his team members, illness of team members,
etc. From the particular example in Figure 3 it can
be concluded that the project manager had quite
some problems regarding effort deviations, both
with respect to (resource) productivity (i.e. only in
the beginning and at the end of the period of twelve
weeks above 1) and (schedule)estimation (below 1
in four of the twelve weeks). Based on this chart a
project manager should first reconsider the used
estimation procedures, e.g. whether there is a
common pattern in the estimation errors. The
primary priority is then to decrease the number of
wrong estimations. After improving the estimations,
more reliable data can be obtained regarding the
(resource) productivity related deviations, and
productivity measurement and analysis will
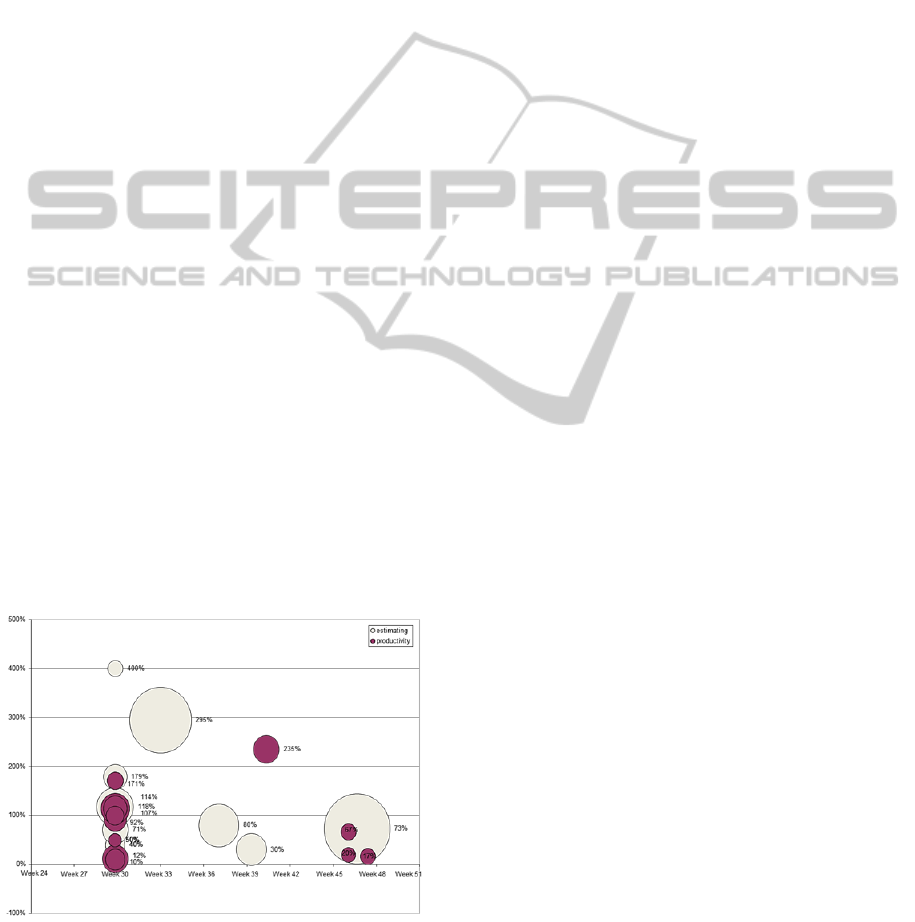
improve. In Figure 4 the sizes of the activities have
also been reflected in the graph. The vertical axis
shows the ratio between planned and actual effort as
a percentage. Higher than 100% means that an
activity took less person hours than planned and
lower means more person hours.
Figure 4: Two types of effort deviations of project
activities, with size information on the activities.
By changing the dots to circles, where the
surface shows the actual effort, it becomes possible
to visualise the size of an activity in the same chart.
In
this way it becomes possible to discuss the issue
whether the size of activities effect the type of
deviation that occurs. Figure 4 shows some extreme
estimation-related deviations for both average and
large activities (week 30 and 33). Productivity-
related deviations don’t show these extremes, and
occur only in average sized activities. This could
reflect the fact that estimation procedures should be
evaluated more intensively, and that they eventually
should be improved.
5.3 Reflection on the Experimental
Measurement Implementations
The measurement implementations have been
evaluated, in collaboration with the participating
project managers. Because the programme only ran
for a limited amount of time, and the number of
completed activities was restricted, it is not yet
possible to draw statistically significant conclusions.
However, it is possible to describe interesting
observations that are useful for project managers.
The measurement results on effort deviations, based
on (schedule)estimation and (resource)productivity
and size metrics have been determined by the
management themselves on the basis of the GQM
approach. These ‘process oriented’ metrics differ
quite a lot from the previously used ‘product
oriented’ metrics (e.g. function points), but turned
out to be very useful From all measurement results
in the case study, at least half of the effort deviations
appeared to be estimation related. Discussions on the
estimation related deviations lead to interesting
conclusions, e.g. that they were often caused by the
extra effort that it took to handle changing customer
requirements during an activity. As a consequence
activities often took more time than estimated. This
suggests to improve the current estimation
procedures, or to improve the handling of customer
change requests during the software development.
However, also after solving (and preventing)
estimation related deviations, the analysis and
solving of the productivity related deviations is still
challenging. E.g. from the experimental
measurements it appeared that higher or lower
productivity was not related to the size of the
activities. Probably other factors, such as team size,
and experience background, had a bigger impact.
Project managers suggested to add more metrics to
the measurement programme, such as the size of the
teams, and the level of skills and experience of the
StructuringSoftwareMeasurement-MetricationintheContextofFeedbackLoops
135

engineers, to improve the analysis of the deviations.
Discussion on productivity related deviations lead
also to (preliminary) conclusions that most of the
activities that needed more actual effort than
estimated, were activities that were carried out in an
external partner organisation, to which part of the
software engineering activities had been outsourced.
It was suggested that these activities were performed
with a lower productivity because of the fact that the
external software developers required assistance
from the more experienced own software
developers. It was planned to monitor these
productivity related deviations on a continuous
basis, to see whether they would decrease as a
consequence of external development teams gaining
more experience.
6 CONCLUSIONS
First, based on interviews with project managers and
organisational managers, problems regarding
measurement in the case study environment have
been identified. From a literature study guidelines
could be derived to define improvement directions.
Using these guidelines three feedback loops have
been distinguished, respectively on the project level,
the multi-project level and the organisational level.
These feedback loops enable control on the
performance of the software development projects.
They also enable the exchange of information on
projects between the different management levels,
an act as backbone for a learning process. Secondly,
the implementation of the feedback loops has been
validated by carrying out small-scale experimental
measurements. The previous rigid approach of
‘product oriented’ metric definition, and the
dictation of their usage on the organisational level
which lead to a large set of metrics, has been
abandoned. Based on the Goal Question Metric
approach, and in collaboration with project
managers and senior managers, new ‘process
oriented’ effort deviation metrics have been defined,
respectively with respect to estimation-related effort
deviations and productivity-related effort deviations.
. From the experimental measurements it became
clear that on both management levels the same type
of ‘effort deviation’ information is of interest, and
can be provided. The metrics applied, i.e. were
relatively simple and easy to use. The visualisation
of the data from these metrics lead to interesting
discussions and more insight in the estimations and
the (resource) productivity of the software
development projects.
Thirdly, it also became clear that this information
had to be provided on a continuous basis,
respectively on the organisational level on a mid-
term (month-to-month) basis and on the project level
on a (short-term) day-to-day or week-to-week basis.
ACKNOWLEDGEMENTS
The authors would like to thank Kees-Jochem
Wehrmeijer for his contributions to this project.
REFERENCES
Balla, K., Bemelmans, T., Kusters, R., Trienekens, J.
2001, "Quality through Managed Improvement and
Measurement (QMIM)", Software Quality Journal,
vol. 9, no. 3, pp. 177-193.
Basili, V. R. 1996, "The Role of Experimentation in
Software Engineering: Past, Current, and Future",
Proceedings of the 18th International Conference on
Software engineering pp. 442-449.
Basili, V. R., McGarry, F. E., Pajerski, R., and Zelkowitz,
M. V. 2002, "Lessons learned from 25 years of
process improvement: the rise and fall of the NASA
software engineering laboratory", Proceedings of the
24
th
International Conference on Software
Engineering pp. 69-79.
Basili, V. R. & Rombach, H. D. 1988, "The TAME
project: towards improvement-oriented software
environments", Software Engineering, IEEE
Transactions on, vol. 14, no. 6, pp. 758-773.
Basili, Victor R., et al. 2010. "Linking software
development and business strategy through
measurement." Computer 43.4: 57-65.
CMMI Product Team, CMMI for Development Version
1.3, Software Engineering Institute, USA, 2010.
Houdek, F., Schneider, K., & Wieser, E. 1998,
"Establishing experience factories at Daimler-Benz an
experiencereport", Software Engineering, 1998. Proc.
of the 1998 (20th) Intern. Conf. on pp. 443-447.
Jäntti, Marko, Antti Lahtela, and Jukka Kaukola. 2011,
Establishing a Measurement System for IT Service
Management Processes: A Case Study. International
Journal on Advances in Systems and Measurements
3.3 and 4, pp. 125-136.
Oman, P. W. & Pfleeger, S. L. 1997, Applying software
metrics IEEE Computer Society Press Los Alamitos,
Calif.
Solingen, R. & Berghout, E. 1999, The
Goal/Question/Metric Method - A Practical Guide for
Quality Improvement of Software Development,
McGraw-Hill.
Unterkalmsteiner, Michael, et al. 2012, Evaluation and
Measurement of Software Process Improvement—A
Systematic Literature Review. Software Engineering,
IEEE Transactions on 38.2: 398-424.
ICEIS2014-16thInternationalConferenceonEnterpriseInformationSystems
136
