
Evaluation Framework for Care Coordination & Telehealth Deployment
H. Schonenberg
1
, S. Pauws
1
, C. Bescos
2
, C. Westerteicher
2
, C. Maramis
3
, D. Filos
3
, I. Chouvarda
3
,
N. Maglaveras
3
, J. G. Cleland
4
and J. Roca
5
1
Philips Research Laboratories, Eindhoven, The Netherlands
2
Philips Telehealth Europe, Hospital to Home, Philips Healthcare, Boeblingen, Germany
3
Lab of Medical Informatics, Medical School, Aristotle University of Thessaloniki, Thessaloniki, Greece
4
University of Hull, Kingston-upon-Hull and Imperial College, London, U.K.
5
Institut d’Investigacions Biom
`
ediques August Pi i Sunyer (IDIBAPS), Barcelona, Spain
Keywords:
Telehealth, Care Coordination, Chronic Illness, Regional Evaluation, Best Practices.
Abstract:
Chronic conditions are growing to pandemic proportions. There is evidence that chronic conditions may be
managed successfully using telehealth, but this is not leading to large scale deployment. Organisational and
structural changes are needed to progress from pilots to real implementations that are integrated in the care
routines. The ACT project goes beyond the trial setting to assess programs implementing care coordination
(CC) and telehealth (TH) in different EU regions. The aim is to identify best practice organisational and
structural processes supporting integration and implementation of telehealth in a care coordination context
for routine management of patients with long-term medical conditions. In this report we describe the frame-
work of indicators for CC&TH outcomes and drivers that define data elements collected during the project.
The evaluation engine is responsible for capturing, monitoring and evaluating CC&TH deployment, using
collected data. The evaluation results contribute to the “best practice cookbook” that will facilitate CC&TH
deployment at scale. This report also shares what we have learned from a data transfer test case.
1 INTRODUCTION
In the EU, some 10 million people suffer from heart
failure (Braunschweig et al., 2011), 20 million have
chronic obstructive pulmonary disease (ECC, 2013)
and 60 million live with diabetes (IDF, 2013). Each
year, these three conditions cost EU healthcare sys-
tems around EUR 125 billion. With Care Coordi-
nation (CC) and TeleHealth (TH) services, chroni-
cally ill people can be managed more effectively in
their own homes through remote management sys-
tems and integrated networks of caregivers. The ul-
timate goal of these services is to improve health and
support self-management of patients by giving them
more independence, freedom and control over their
management. Clinical studies have shown these ser-
vices can help reduce hospital admissions, days in
hospital and mortality rates (Inglis et al., 2010; Inglis
et al., 2011; BMJ, 2012). However so far CC&TH
has been mainly limited to pilot programs due to the
difficulty of translating such research into practice.
Clinicians need better reporting of how cases were se-
lected for pilots and their representativeness.
The Advancing Care Coordination and Telehealth
program (ACT) started in February 2013 and is a 2.5
year program, co-funded by the EU (ACT Project,
2013). It is the first of its kind, specifically designed
to examine and overcome the structural and organisa-
tional barriers of the deployment of CC&TH. ACT
focuses on improving CC&TH services for patients
with chronic conditions, specifically Heart Failure,
COPD, Diabetes, and multi-morbid patients. ACT
looks at tailoring CC&TH services and solutions to
specific needs at all acuity levels set out in the Kaiser-
Permanente Acuity Pyramid (not only the 3%-5% at
the tip primarily targeted by most TeleHealth studies).
With the inclusion of CC, the regions and the health-
care experts will evaluate the integrated delivery of
healthcare services between community care, primary
care physicians, hospitals and informal care givers,
and get feedback on how to organise these to provide
optimal care. Describing the environment in which
CC&TH is embedded addresses the current lack of
representativeness in reported outcomes. In conjunc-
tion with the healthcare providers and the CC&TH
expert team, ACT will investigate how the organisa-
358
Schonenberg H., Pauws S., Bescos C., Westerteicher C., Maramis C., Filos D., Chouvarda I., Maglaveras N., Cleland J. and Roca J..
Evaluation Framework for Care Coordination & Telehealth Deployment.
DOI: 10.5220/0004811303580365
In Proceedings of the International Conference on Health Informatics (HEALTHINF-2014), pages 358-365
ISBN: 978-989-758-010-9
Copyright
c
2014 SCITEPRESS (Science and Technology Publications, Lda.)

tional and structural elements that influence effective
deployment of CC&TH are currently being used and
how they can be optimised.
Initially 5 European healthcare regions are in-
volved: The Basque Country (SP), Catalonia (SP),
Lombardia (IT), Scotland (UK) and Groningen (NL).
More regions can join the consortium during the pro-
gram. The areas that are addressed in the ACT pro-
gram are patient & population stratification, care co-
ordination and organisation, patient adherence & staff
engagement, and outcomes & efficiency. The regions
deploy and operate their own CC&TH schemes for
heart failure, COPD and diabetes patients. A base-
line assessment (month 9) is performed to assess the
current state of CC&TH in the regions. Data from
the regions are used to identify “best in class” pro-
cesses, structures and ways of working. Several iter-
ative assessments (month 14, 18, 24) of the regions
will be done with the aim to create a best practices
“cookbook”, allowing other healthcare authorities to
develop their own CC&TH systems.
This paper describes the evaluation framework
and engine that captures, monitors and reports
CC&TH outcomes. Drivers are those aspects of a
health care program that, when altered, affect one or
more outcomes. An important role of the engine is
the identification and evaluation of drivers that con-
tribute to successful CC&TH deployment. The ACT
program consolidates the understanding of the rela-
tion between drivers and outcomes in a “best prac-
tices cookbook” that can be used to improve exist-
ing CC&TH deployments and to configure future de-
ployments. The remainder of this document is organ-
ised as follows. Section 2 describes evaluation frame-
works related to CC&TH. The ACT indicator frame-
work that captures CC&TH outcomes and its drivers
is presented in Section 3. Section 4 describes the role
and main components of the evaluation engine. Sec-
tion 5 presents a feasibility study for the baseline as-
sessment and the main lessons learned. We conclude
this paper and discuss further work in Section 6.
2 RELATED WORK
Telemedicine has been defined as the application of
information and communications technology (ICT)
technology to provide and support healthcare when
distance separates the participants (Ohinmaa et al.,
2001). In the context of ACT telehealth refers to the
use of various information and communication tech-
nologies (ICT) to assist in the management of an ex-
isting long-term medical condition of a patient by de-
livering clinical care and non-clinical services where
the health care professional and patient are not at the
same location (Gaikwad and Warren, 2009). Non-
clinical services may include promotion of health ed-
ucation or self-care. Care coordination can be per-
ceived as the deliberate organisation of patient care
activities between two or more participants in a pa-
tients care (including the patient) to facilitate the ap-
propriate delivery of healthcare services (McDonald
et al., 2007).
Although telehealth and care coordination have
been recognized as important aspects of high qual-
ity and efficiently delivered healthcare, much work
remains to be done to illustrate how CC&TH could
work in an optimal way and how they relate to impor-
tant healthcare outcomes (e.g., hospitalisation, read-
missions, mortality, and QoL). For this reason, many
researchers have reviewed and evaluated certain as-
pects of CC&TH (Ekeland et al., 2010; Peikes et al.,
2009). Apart from these efforts, several large-scale
initiatives for evaluating healthcare delivery – and
CC&TH as part of it – have emerged, yielding frame-
works that systematically define healthcare-related in-
dicators and apply them on the task of healthcare de-
livery assessment. This section describes the most
important evaluation frameworks for the assessment
of CC&TH.
The International Network of Agencies for Health
Technology Assessment (INAHTA) has developed a
framework for the assessment of telemedicine appli-
cations (Ohinmaa et al., 2001). The framework con-
sidered 3 types of assessment that are directly as-
sociated with the phases of a healthcare application
lifetime. At each stage, the telemedicine application
was compared to the baseline case (i.e., absence of
telemedicine) to help authorities decide whether the
telemedicine application is worth deploying. There
are four assessment categories, e.g., general consid-
erations, costs, economic evaluation, and sensitivity
analysis.
Starting from 2009, the European Commission
project MethoTelemed developed a structured frame-
work for assessing the effectiveness and contribu-
tion to QoC of telemedicine applications, which was
named Model for Assessment of Telemedicine ap-
plications (MAST) (Kidholm et al., 2012). Using
HTA Core Model as a starting point, MAST orga-
nized telemedicine outcomes to be assessed into 7 do-
mains, namely 1) Health problem and description of
the application, 2) Safety, 3) Clinical effectiveness,
4) Patient perspectives, 5) Economic aspects, 6) Or-
ganisational aspects, and 7) Socio-cultural, ethical,
and legal aspects. Within each domain, there is a list
of issues for consideration, which are called topics.
MAST comprises 3 elements that need to be applied
EvaluationFrameworkforCareCoordination&TelehealthDeployment
359

sequentially in order to properly assess a telemedicine
service: (1) Preceding Considerations, which aims to
determine whether a telemedicine service should be
assessed or not, (2) Multidisciplinary Assessment, is
the core of MAST’s assessment taking place in all
the aforementioned domains, and (3) Assessment of
Transferability, which attempts to assess the transfer-
ability of healthcare study results to new settings. Fi-
nally, the MAST manual (Kidholm et al., 2010) pro-
vides examples of outcomes measures within each do-
main and methods for collection them.
The National Telehealth Outcome Indicators
Project (NTOIP) is a successful Canadian effort to
identify and define a minimal set of simple yet mean-
ingful outcome indicators that could be consistently
applied in the evaluation of telehealth (Scott et al.,
2007). The NTOIP study was conducted in 4 phases,
namely 1) Strategy and approach, 2) Systematic re-
view of the literature, 3) National experts workshop,
and 4) Refinement and consensus. NTOIP developed
the Telehealth Outcomes Development (TOD) frame-
work, a conceptual and guiding scheme consisting
of 5 domains (Outcome category, Outcome theme,
Outcome indicator, Outcome measure, and Outcome
tool) that clarifies the hierarchical relationships be-
tween outcome indicator elements. The project con-
cluded to a list of 34 indicators, which are catego-
rized into 4 themes (Quality, Access, Acceptability,
and Cost). Within each theme, the 3 most relevant
and appropriate for common use indicators were also
specified.
In 2010, the Agency for Healthcare Research and
Quality (AHRQ) has published a research report, en-
titled Care Coordination Measures Atlas, in order to
help evaluators identify appropriate measures for as-
sessing care coordination (McDonald et al., 2010).
The purpose of this atlas is to (1) provide a list of
existing measures of CC, organizing them along two
dimensions, namely domains (i.e., mechanisms for
achieving CC) and perspectives (i.e., the perspectives
from which to measure these mechanisms), and (2)
develop a framework for understanding how CC is
“measured”.
In 2011, the Institute for Healthcare Improvement
(IHI) published a white paper that describes the meth-
ods for better coordination of care regarding patients
with multiple health and social needs (such as chronic
ill patients) in order to ensure that their health and
life goals are improved (Craig et al., 2011). This
framework targets the assessment of patients’ emerg-
ing strengths and needs, in order to improve self-
management, target use of care system, for support
at critical times. The main aim of the framework is to
achieve better health outcomes at lower costs.
3 INDICATOR FRAMEWORK
In business, performance of an organization is mea-
sured by Key Performance Indicators (KPIs). KPIs
are different from business to business and need to be
identified first. Due to the fact that CC&TH has not
resulted into large-scale deployment yet, CC&TH
KPIs do not exist yet. The ACT project takes lead
in identifying CC&TH KPIs, and more importantly,
the drivers for those KPIs. This section describes the
indicator framework capturing the KPIs (outcomes)
and drivers that will be assessed throughout the ACT
programme.
In ACT we address the whole range of strati-
fication (patient and population), engagement (pa-
tient and staff), care coordination and organisational
structures, including telehealth solutions if relevant,
and the relation to effectiveness & efficiency. The
frameworks described in Section 2 provide a good
overview of potential indicators relevant for specific
areas within ACT. These indicators were obtained
from literature and current regional practices, we re-
structured the indicators into domains and subdo-
mains to match the context and the purpose of the
ACT project.
At this moment we established agreement on the
(sub)domains in the framework. A description of the
full framework of outcome and driver indicators is be-
yond the scope of this paper. For full details we refer
to (Pauws et al., 2013). The definitions of indicators
in the framework are under construction in collabora-
tion with the regional partners and the work packages.
To illustrate the framework and the methodology we
provide the (sub)domains for the KPIs on efficiency
and efficacy, and set for the stratification drivers. For
both areas we start with a general description and a
graphical representation of the (sub)domains for that
work package. We provide a definition of each do-
main, a motivation for the relevance of that domain,
and some example indicators of the subdomains. The
(sub)domains are illustrated by pie charts (see Figure
1 and 2).
3.1 Efficiency & Efficacy Outcomes
Efficiency & efficacy indicators capture the perfor-
mance of the CC&TH service
1
. Figure 1 depicts the
outcomes indicators (sub)domains and shows some
high level indicators, e.g., the number of patients per
disease per age category, and the system for refer-
encing the indicators. In this case, indicator 1 is ref-
erenced by 7.A.II.1, coding its correspondence to area
1
Within ACT we consider indicators for efficiency & ef-
ficacy and patient adherence as KPIs for CC&TH.
HEALTHINF2014-InternationalConferenceonHealthInformatics
360
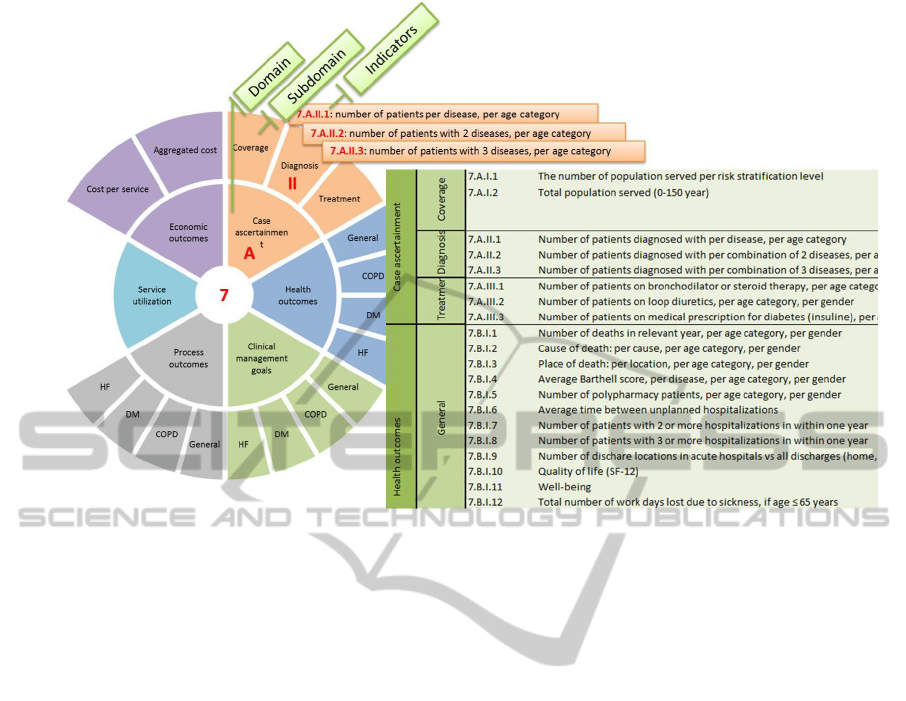
Figure 1: The indicators for the efficiency & efficacy area. The pie (left) shows the domains and subdomains for this area. The
inner circle describes the domains, the outer circle the subdomains. Also three high level examples of indicators are provided.
The table (right) depicts a fragment of a more detailed description of these indicators. A coding scheme for referencing the
indicators is part of the framework.
7 (efficiency & efficacy), domain A (Case Ascertain-
ment domain), subdomain II (Diagnosis subdomain).
The table on the right provides a more detailed de-
scription of the indicator.
Case Ascertainment Domain: Case ascertainment
domain indicators capture the extent and precision
with which the service manages its population. Suc-
cess of the service is captured by how well the di-
agnosis and treatment is for those on the service and
how well the services addresses the needs of the en-
tire population. Case ascertainment is addressed at a
population level by means of registries, e.g., the com-
parison between (the number of) diagnosed patients
in the registries and (the number of) patients treated
by certain marker drugs may highlight issues in the
identification and correct diagnosis and treatment of
patients. The subdomains are the extent of (1) the
addressed population demand (coverage), correct di-
agnosis, and correct treatment treatment.
Health Outcomes Domain: Health outcome do-
main indicators capture the effect of the CC&TH ser-
vice on the patients physical and mental health (and
deaths), functional limitations, and quality of life.
Health outcomes have a direct meaning for the pa-
tient. Hospitalisation rate is also a health outcome
that will be analysed here. For the data collection pur-
pose it is captured in the Service utilization domain.
The subdomains consider the indicators per disease
(COPD, DM, and HF) and one subdomain for gen-
eral indicators that apply for each disease.
Clinical Management Goals Domain: Besides
keeping patients outside the hospital, it is equally im-
portant to keep the patients stable, i.e. maintaining
their clinical values within safe ranges. The clini-
cal management goals domain indicators capture how
well the patient is reaching the clinical goals set by
guidelines and clinical protocols. Clinical manage-
ment goals correspond to the clinical/analytical val-
ues. These have no direct meaning to the patient, but
are relevant for the clinician. Here also general and
disease specific subdomains are considered.
Process Outcomes Domain: Process outcomes do-
main indicators capture how well the care pathways
are working in practice, and how well clinical guide-
lines and good practices are being followed. Adher-
ence to clinical guidelines is recommended to apply
evidenced-based medicine. Again, the general and
disease specific subdomains are considered.
Service Utilization Domain: Service utilization
domain indicators capture the effect of the CC&TH
EvaluationFrameworkforCareCoordination&TelehealthDeployment
361

service on the utilization of health care services. Here
we measure the burden on the health care system, i.e.,
the use of health care services in numbers, from which
economic outcomes can be derived. For example, the
number of hospitalizations, AED visits and primary
care visits.
Economic Outcomes Domain: Economic out-
comes domain indicators capture the cost of health
care service utilization. Here we measure the burden
on the health care system in terms of cost. There is a
subdomain for cost per service that captures the unit
cost per service, such as the cost of an AED visit. The
aggregated cost subdomain provides the total costs.
3.2 Population Stratification Drivers
This type of stratification is used to generate a map
of the distribution of the population by health risk
in a given sector or region. It serves the purpose of
defining specific policies and interventions at popula-
tion level. It will also serve for the generation of in-
dicators useful for the follow-up of health outcomes.
The evaluation engine should analyse the relation be-
tween drivers and KPIs. In the area of population
stratification it will be interesting to see how stratifica-
tion strategies contribute to the outcomes, e.g., does a
stratification on cost savings lead to reduction in cost,
and how does it affect health outcomes?
ACT abstracts from concrete stratification algo-
rithms, which may be different from region to re-
gion. Instead, for population stratification we focus
on the stratification process, i.e. which elements are
included in the stratification. As part of the strategy to
perform population-based stratification, we consider
five different domains, some of them including sev-
eral sub-domains, summarized in Figure 2.
Methods Domain: The domain includes the con-
ceptual definitions guiding the population-based strat-
ification and the description of the methodological
steps followed to obtain the population-based indica-
tors. Subdomains describe the stratification purpose,
processs (e.g., information sources and method), fre-
quency, and the combination method (e.g., how to
combine resources for complex indicators).
Diseases Domain: Disease domain indicators pro-
vide information on the epidemiological impact
of targeted diseases and their combination (co-
morbidities) at population level(Murray and Lopez,
1997). The disease severity subdomain addresses
the loss of function due to affected organs. Consen-
sus classification of severity for major chronic dis-
eases is reported in international clinical guidelines
Figure 2: Population stratification indicators.
(i.e. NYHA, New York Heart Academy classification
for heart failure; GOLD stages for Chronic Obstruc-
tive Pulmonary Disease, COPD). Co-morbidities are
defined as concomitant diseases in a given patient. It
is a common condition in chronic patients with a sig-
nificant impact on health risk. A classical indicator
to assess the impact of co-morbidities at population
level is the Charlson index.
Age Domain: We examine the effect of age on sur-
vival, utilisation of healthcare resources and use of
technologies (SIMPHS2, 2013).
Deprivation Domain: Deprivation Index is used to
characterize socio-economical and educational status
of the population. Deprivation index indicators char-
acterize the poverty in an area. Poverty is related to
health, education level, availability of means to sus-
tain a healthy lifestyle and social support from the
environment, and the availability to utilities, e.g. a
network. Hence poverty is expected to impact health
outcomes and adherence to the programs (Schuurman
et al., 2007).
Past Use of Healthcare Domain: Use of health-
care resources within a given period of time (i.e., past
12 months) is expressed by indicators of disease bur-
den on the health system. Three main sub-domains
are currently considered, but this may need to be
expanded to include novel modalities of interactions
of the patient with the healthcare system using tele-
health. We consider indicators in the subdomains that
capture hospitalizations, visits, and drugs.
HEALTHINF2014-InternationalConferenceonHealthInformatics
362

4 EVALUATION ENGINE
The evaluation engine refers to the organisational and
technological infrastructure to collect, analyse and re-
port CC&TH data. This section covers technology
and the processes related to the evaluation engine.
The engine supports monitoring of KPIs to all
stakeholders. It provides an overview of the targets
and statuses of all KPIs. In addition, the evaluation
engine evaluates the relation between the KPIs and
the drivers in the areas of (1) optimisation CC&TH
organisation and structures, (2) stratification, and (3)
patient adherence & staff engagement. The engine
should support the understanding how to improve the
tailoring of care for co-morbid patients by exploring
the drivers that lead to better health outcomes (cap-
tured by some KPIs), e.g., by applying specific strat-
ification strategies, taking into account disease sever-
ity and frailty, but also considering the communica-
tion between various health care providers involved
in the treatment of the co-morbid patient.
Within the ACT program, the Evaluation Engine
makes data on CC&TH deployment (i.e. KPIs and
driver configurations per region) transparent, inter-
rogative and actionable to all partners and regions at
pre-set moments in time.
A wide variety of “off-the-shelf” technologies is
available from both commercial vendors and open
source community. The selection of technologies for
the prototype of the evaluation engine consists of sev-
eral components. The content and access to the con-
tent is provided by the open source content manage-
ment system Drupal
2
. Surveys are provided by a
LimeSurvey
3
application. Shiny
4
allows the statisti-
cal analysis, performed in R(R Core Team, 2013), to
be easily deployed in an interactive web application.
In the ACT project there will be a limited number of
data collections, therefore data access and integration
can be performed manually in the R scripts. Data col-
lection of the KPIs for population stratification and
for efficiency & efficacy is currently done via a secure
data transfer, but will be replace by a data submission
service in a next version.
5 FIRST EXTRACTION:
LESSONS LEARNED
The ACT program is designed as a program of
prospective data collection for the purpose of a mul-
2
https://drupal.org/
3
http://www.limesurvey.org/
4
http://www.rstudio.com/shiny/
titude of analyses. From an organisational perspec-
tive, data need to be collected at the regions, ei-
ther with the help from ACT regional partners (e.g.,
KRONIKGUNE in the Basque Country or Telbios
in Lombardy) or by third parties. Figure 3 depicts
the (sub)domains of all ACT areas we have identi-
fied in agreement with the regional partners and the
work packages. The figure also shows how data for
the baseline assessment will be collected. Where sys-
tematic collection of data is available in local IT sys-
tems, data extraction is the preferred data collection
method. Currently data extraction is only possible
for population stratification and efficiency & efficacy.
Surveys will be issued to gather information on the
indicators from the other areas.
A small feasibility study has been performed to
assess readiness for regions to share data. Currently,
regions are assessing availability of the indicators in
the framework and preparing their systems for base-
line data extraction. The remainder of this section dis-
cuses the findings of the test extraction of the feasibil-
ity study. Two regions were successful in collecting
and sharing their data. The following issues were re-
vealed and need closer study. Clearly agreed and very
precise indicator definitions are needed to achieve a
transparent way of reporting across regions. For ex-
ample, Catalonia reported mortality per 1.000 inhab-
itants, whereas other regions reported a total number
of deaths. It should be clear if these numbers refer to
patients that were only included in the risk set (one
of the health plans) or to representatives of the lo-
cal common population. The Basque Country shared,
besides the raw number statistics on admission, ad-
justed measures for admission by taking into accounts
patients that died during follow-up. Adjusted admis-
sions were calculated by subtracting the number of
dead from the number of admissions. Cooperation
with the regions is necessary to achieve a common
understanding of the indicators captured by a solid
definition. This is a time consuming effort.
Access permissions and procedures differ per re-
gion and have been found to be a barrier during the
test transfer. Data resides in different systems; some
are easy to access while others require contracting
third parties. Due to access restriction, Catalonia
could not share data on length of stay combined with
other variables (cause of admission, diagnosis, type
of centre). Lombardy (Telbios) was not able to meet
the data transfer request, as it concerned health out-
come and resource utilisation data which are beyond
the access privileges of Telbios. A third Lombard
party, outside of ACT, Lombardy Informatics SPA
owns, manages and controls these data. It is a publicly
owned IT service company, founded by the Lombardy
EvaluationFrameworkforCareCoordination&TelehealthDeployment
363

Data collection KPIs Drivers
Stratification Care Coordination Adherence
Data extraction Efficiency & Efficacy Population Stratification
6 domains 5 domains
17 subdomains 9 subdomains
Surveys Patient Adherence Patient Stratification Care Coordination Patient Adherence
4 domains 4 domains 4 domains 3 domains
12 subdomains 17 subdomains 15 subdomains 11 subdomains
Staff Engagement
6 domains
3 subdomains
Figure 3: Overview of indicator framework areas and the data collection method (survey or data extraction).
regional government.
If data are readily available from the regional
ICT infrastructure (e.g., from existing reporting dash-
boards), data collection is straight-forward. It is antic-
ipated that new indicators will need new queries, pos-
sibly from additional data sets, consequently a newly
configured means in the ICT infrastructure. It is a sig-
nificant effort to compose such a means especially for
composite indicators (i.e., combined end points). For
instance, in the Basque Country, mortality data for
chronic patients were not available because that re-
quires the configuration of a new dashboard. It is crit-
ical to arrive at an agreed set of indicators swiftly to
plan for local ICT configuration effort and meet ACT
project deadlines.
6 CONCLUSIONS
The indicator is part of the ACT program that is re-
lated to the evaluation framework and engine. Ob-
viously, the program has just started and comprises
of many more elements that are being under devel-
opment. The indicator framework is the result of
many discussions in the ACT consortium. The frame-
work now describes the domains and subdomains that
are considered relevant for deploying and monitoring
CC&TH . In close collaboration with work package
leaders, we recently have defined a list of indicators
that will be collected in the regions. The current list is
ambitious and contains many indicators that are prob-
ably not (readily) available at the regions.
It is expected that most regions will not be able
to provide information on most indicators during the
life-cycle of this programme. However, they are
the indicators that the medical community and pol-
icy makers expect regions to work towards. In the
past, many programs have published over-optimistic
results based on managing a highly selected group of
patients unrepresentative of the general problem. This
has led to a loss of confidence and trust by the med-
ical community in such reports, which must now be
corrected.
The evaluation engine covers the process of data
collection, analysis and reporting, as well as the re-
quired underlying technology. This can be offered by
a data warehousing approach where ETL tooling sup-
port data collection, the data warehouse stores his-
torical data, and BI tools can be used to report and
monitor data. Nowadays many solutions support the
connection to statistical tools such as R and may even
provide the resources to run and store the analysis.
We need to explore the requirements with respect to
data collection, analysis and visualisation to select the
right product and vendor.
As a result of the test transfer we observed many
differences between regions in IT systems access, ac-
cessibility of the data elements, levels of granularity
of the data, and in the care coordination processes
(e.g. the recruitment process). Agreed and precise
definitions of the indicators are required for consis-
tent data collection across the regions. Moreover, the
agreement on the level of granularity needs further in-
depth discussion within the ACT program.
ACKNOWLEDGEMENTS
The work leading to these results has received fund-
ing from the European Community’s Health Pro-
gramme under grant agreement 0121209. The ACT
programme is fully aligned with the European Inno-
vation Partnership in Active and Healthy Ageing ob-
jectives to deploy integrated care for chronically ill
patients. We would like to thank all ACT participants
and collaborating teams for their contribution to the
indicator framework.
List of ACT Researchers
Cristina Bescos, Chris Westerteicher (Philips Health-
care); Steffen Pauws, Helen Schonenberg (Philips
Research); Nicolaos Maglaveras, Ioanna Chouvarda,
Christos Maramis, Dimitris Filos (AUTH); Stanton
Newman, Lorna Rixon, Rosemary Davidson (UCL);
HEALTHINF2014-InternationalConferenceonHealthInformatics
364

Josep Roca (IDIBAPS); Joan Escarrabill, Montserrat
Moharra (AIAQS); John Cleland (Imperial College);
David Barrett, Samantha Nabb (University of Hull);
Rachel Harding, Nicholas Hart (Guy & St Thomas
NHS); Miren David Iturralde, Joana Mora Amen-
gual, Esteban de Manuel Keenoy (Kronikgune); Erik
Buskens, Daan Bultje (UMCG); Luciana Bevilacqua,
Marco Nalin (Telbios); Janne Rasmussen, George
Crooks (NHS 24/SCTT); Claudia Pagliari (University
of Edinburgh); Stefan St
¨
ork, Carolin Wahl (Univer-
sity of W
¨
urzburg)
REFERENCES
ACT Project (2013). Advancing Care Coordina-
tion and Telehealth Deployment.
http://www.
act-programme.eu/
.
BMJ (2012). British Medical Journal, 344.
Braunschweig, F., Cowie, M., and Auricchio, A. (2011).
What are the costs of heart failure? Europace, 13:13–
17.
Craig, C., Eby, D., and Whittington, J. (2011). Care coor-
dination model: Better care at lower cost for people
with multiple health and social needs. IHI Innova-
tion Series. Cambridge, Massachusetts: Institute for
Healthcare Improvement.
ECC (2013). European COPD Coalition.
http://www.
copdcoalition.eu/about-copd/prevalence
.
Ekeland, A. G., Bowes, A., and Flottorp, S. (2010). Effec-
tiveness of telemedicine: a systematic review of re-
views. International journal of medical informatics,
79(11):736–771.
Gaikwad, R. and Warren, J. (2009). The role of home-
based information and communications technology
interventions in chronic disease management: a sys-
tematic literature review. Health Informatics Journal,
15(2):122–146.
IDF (2013). International Diabetes Federation.
http://
www.idf.org/diabetesatlas/europe
.
Inglis, S., Clark, R., McAlister, F., Ball, J., Lewinter, C.,
Cullington, D., Stewart, S., and Cleland, J. (2010).
Structured Telephone Support or Telemonitoring Pro-
grammes for Patients with Chronic Heart Failure. The
Cochrane Database of Systematic Reviews, 8(8).
Inglis, S., Clark, R., McAlister, F., Stewart, S., and Cleland,
J. (2011). Which Components of Heart Failure Pro-
grams are Effective? A meta-analysis of the outcomes
of structured telephone support or telemonitoring as
the primary component of heart failure management
in 9,560 patients. European Journal of Heart Failure,
13:1028–1040.
Kidholm, K., Bowes, A., Dyrehauge, S., Ekeland, A., Flot-
torp, S., Jensen, L., Pedersen, A., and Rasmussen, J.
(2010). [Online] The MAST manual.
Kidholm, K., Ekeland, A. G., Jensen, L. K., Rasmussen, J.,
Pedersen, C. D., Bowes, A., Flottorp, S. A., and Bech,
M. (2012). A model for assessment of telemedicine
applications: mast. International journal of technol-
ogy assessment in health care, 28(01):44–51.
McDonald, K., Schultz, E., Albin, L., Pineda, N., Lonhart,
J., Sundaram, V., Smith-Spangler, C., Brustrom, J.,
and Malcolm, E. (2010). Care coordination atlas ver-
sion 3 (prepared by stanford university under subcon-
tract to battelle on contract no. 290-04-0020). AHRQ
Publication No. 11-0023-EF.
McDonald, K. M., Sundaram, V., Bravata, D. M., Lewis,
R., Lin, N., Kraft, S. A., McKinnon, M., Paguntalan,
H., and Owens, D. K. (2007). Closing the quality gap:
a critical analysis of quality improvement strategies
(vol. 7: Care coordination).
Murray, C. and Lopez, A. (1997). Global Mortality, Disabil-
ity, and the Contribution of Risk Factors: Global Bur-
den of Disease Study. The Lancet, 349(9063):1436–
1442.
Ohinmaa, A., Hailey, D., and Roine, R. (2001). Elements
for assessment of telemedicine applications. Inter-
national Journal of Technology Assessment in Health
Care, 17(2):190–202.
Pauws, S., Schonenberg, H., Maramis, C., Filos, D., Chou-
varda, I., Maglaveras, N., and Bescos, C. (2013).
Evaluation Engine for Advancing Care Coordination
and Telehealth Deployment. Directorate-General
for Health & Consumers. Contract Nr: HEALTH-
20121209.
Peikes, D., Chen, A., Schore, J., and Brown, R. (2009). Ef-
fects of care coordination on hospitalization, quality
of care, and health care expenditures among medi-
care beneficiaries. JAMA: the journal of the American
Medical Association, 301(6):603–618.
R Core Team (2013). R: A Language and Environment for
Statistical Computing. R Foundation for Statistical
Computing, Vienna, Austria.
Schuurman, N., Bell, N., Dunn, J., and Oliver, L. (2007).
Deprivation Indices, Population Health and Geogra-
phy: An Evaluation of the Spatial Effectiveness of In-
dices at Multiple Scales. Journal of Urban Health,
84(4):591–603.
Scott, R., McCarthy, F., Jennett, P., Perverseff, T., Loren-
zetti, D., Saeed, A., Rush, B., and Yeo, M. (2007).
Telehealth Outcomes: a Synthesis of the Literature
and Recommendations for Outcome Indicators. Jour-
nal of Telemedicine and Telecare, 13(S2):1–38.
SIMPHS2 (2013). Strategic Intelligence Monitor for Per-
sonal Health Systems.
http://is.jrc.ec.europa.
eu/pages/TFS/SIMPHS2.html
.
EvaluationFrameworkforCareCoordination&TelehealthDeployment
365
