
Feature Selection Applied to Human Tear Film Classification
Daniel G. Villaverde
1
, Beatriz Remeseiro
1
, Noelia Barreira
1
, Manuel G. Penedo
1
and Antonio Mosquera
2
1
Department of Computer Science, University of A Coru˜na, Campus de Elvi˜na s/n, 15071 A Coru˜na, Spain
2
Department of Electronics and Computer Science, University of Santiago de Compostela, Campus Universitario Sur,
15782 Santiago de Compostela, Spain
Keywords:
Tear Film, Dry Eye Syndrome, Color Texture Analysis, Feature Selection, Filter Methods, Machine Learning.
Abstract:
Dry eye is a common disease which affects a large portion of the population and harms their routine activities.
Its diagnosis and monitoring require a battery of tests, each designed for different aspects. One of these
clinical tests measures the quality of the tear film and is based on its appearance, which can be observed
using the Doane interferometer. The manual process done by experts consists of classifying the interferometry
images into one of the five categories considered. The variability existing in these images makes necessary
the use of an automatic system for supporting dry eye diagnosis. In this research, a methodology to perform
this classification automatically is presented. This methodology includes a color and texture analysis of the
images, and also the use of feature selection methods to reduce image processing time. The effectiveness of
the proposed methodology was demonstrated since it provides unbiased results with classification errors lower
than 9%. Additionally, it saves time for experts and can work in real-time for clinical purposes.
1 INTRODUCTION
Dry eye syndrome, resulting from an inadequate tear
film, is a prevalent disease which affects a wide range
of population. It affects over 14% of 65+ age group
according to one US study (Moss, 2000), and over
30% of the same group in a population of Chinese
subjects (Jie et al., 2008). The percentage of Euro-
pean people affected by dry eye is quite similar. In
Germany, for example, one in four patients consulting
an ophthalmologist complains of the symptoms of dry
eye (Brewitt and Sistani, 2001). Many sufferers will
require treatment and the potential cost is significant.
Therefore, monitoring the effect of the different treat-
ments is of great importance in order to ensure the
maximum benefit to each patient (Bron, 2001).
The tear film is a thin film formed by the tear fluid
over the exposed ocular surface. It was classically de-
fined by Wolff (E.Wolff, 1954) as a multi-layer struc-
ture which consists of an outer lipid layer, an inter-
mediate aqueous layer, and a deep mucous layer. One
aspect of tear film assessment is the evaluation of
the lipid superficial layer (Guillon and Guillon, 1997;
Thai et al., 2004), since it plays an important role in
the retention of the tear film by slowing evaporation.
A deficiency of this layer may cause evaporative dry
eye syndrome. Although this layer is transparent, in-
terference fringes are created when light rays, reflect-
ing off the previous surface, interfere with rays which
have been reflected by the posterior surface (Freeman
and Hull, 2003). In this manner, both light and dark
bands of interference can be observed. The number
and spacing of these bands depend on the thickness
of the lipid layer and the rate at which this changes
(Freeman and Hull, 2003).
The Doane tear film video interferometer (Doane,
1989) consists in a light source and an observation
system which captured the appearance of the tear film
using a video-based system. Using this interferome-
ter, Thai et al. (Thai et al., 2004) measured the evap-
oration rate, thinning characteristics and lipid layer
changes in the tear film. For this purpose, they pro-
posed a grading system in order to classify tear film
images into different categories.
Based on (Thai et al., 2004), a new grading scale
composed of five categories was proposed in (Reme-
seiro et al., nd), since the use of a digital camera pro-
duced changes in the detail seen in the digital images.
The variability in appearance of these categories re-
sulted in a major intra- as well as inter- observer varia-
tions, and so a computer-based analysis was also pre-
sented in (Remeseiro et al., nd). This previous re-
395
G. Villaverde D., Remeseiro B., Barreira N., G. Penedo M. and Mosquera A..
Feature Selection Applied to Human Tear Film Classification.
DOI: 10.5220/0004809403950402
In Proceedings of the 6th International Conference on Agents and Artificial Intelligence (ICAART-2014), pages 395-402
ISBN: 978-989-758-015-4
Copyright
c
2014 SCITEPRESS (Science and Technology Publications, Lda.)
search demonstrated that the interference phenomena
can be characterized as color texture patterns, and so
the manual process can be automated with the benefits
of being faster and unaffectedby subjective factors. A
wide set of texture analysis techniques, color spaces
and machine learning algorithms were analyzed. As a
summary, the co-occurrence features method for tex-
ture extraction and the Lab color space produced the
best results with maximum accuracy over 90%. Re-
garding the machine learning algorithms, an statisti-
cal comparison of classifiers was performed and the
SVM was established as the most competitive method
for the problem at hand. To the best knowledge of the
authors, there are no more attempts in the literature to
automatically analyze tear film images acquired with
the Doane interferometer.
The problem with the approach proposed in
(Remeseiro et al., nd) is that the time required to ex-
tract some of the texture features is too long for clin-
ical purposes. Reducing processing time is a criti-
cal issue in this application, so feature selection tech-
niques will be applied in this research in order to de-
crease the number of features and, as a consequence,
the computational time. The proposed methodology
will provide reliable results in a short period of time
and so the system would be highly recommended for
clinical use in dry eye diagnosis.
This paper is organized as follows: Section 2 de-
scribes the steps of the methodology, Section 3 ex-
plains the experimental study performed, Section 4
shows the results and discussion, and Section 5 in-
cludes the conclusions and future lines of research.
2 RESEARCH METHODOLOGY
The methodology proposed in this research is illus-
trated in Figure 1, and aims at improving automatic
human tear film classification. First, image process-
ing is performed in order to obtain the quantitative
vectors with the texture and the color information of
the images. Second, feature selection methods are
applied in order to select the subset of relevant fea-
tures. Then, the classification step is performed and,
finally, two performance measures are computed to
evaluate the effectiveness of the methodology. Next,
every stage will be explained in detail.
Image
processing
Feature
selection
Classification
Performance
evaluation
Figure 1: Steps of the research methodology.
2.1 Image Processing
The first step consists in processing an input image
acquired with the Doane interferometer and, as a re-
sult, a quantitative vector of features is obtained. It is
composed of three sub-steps: (1) the region of interest
of an input image is extracted; (2) this region in RGB
is converted to a specified color space; (3) each single
channel of the transformed image is analyzed in terms
of texture. As a result, a feature vector is generated.
In what follows, every step will be explained in depth.
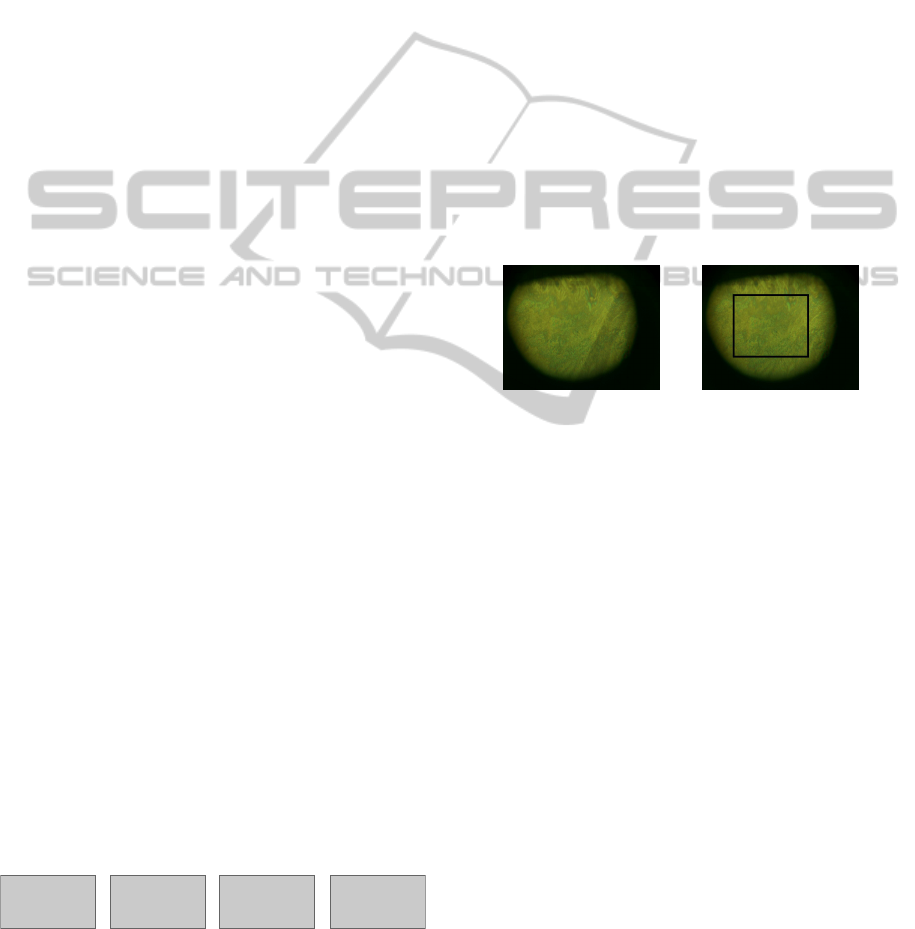
2.1.1 Extraction of the Region of Interest
The input images, as depicted in Figure 2(a), include
an external area that does not contain useful infor-
mation. Also, the most relevant information appears
in the central part of the yellowish or greenish area,
formed by the anterior surface of the tear film. This
forces a pre-processing step aimed at extracting the
region of interest (ROI) (Remeseiro et al., nd).
(a) (b)
Figure 2: (a) Input image in RGB. (b) Region of interest.
The relevant region of the image is characterized
by green or yellow tonalities, and so only the green
channel of the input image in RGB is considered.
The backgroundof the image is determined by finding
those pixels whose gray level is less than a threshold:
th = µ − p× σ (1)
where µ is the mean value of the gray levels of the
image, σ is its standard deviation and p is a weight
factor empirically determined.
Once the background is identified, the central part
of the rest of the image can be located in order to
extract the final ROI (see Figure 2(b)). Since some
images include other irrelevant regions, such as eye-
lashes, the morphological operator of erosion (Gonza-
lez and Woods, 2008) is applied in order to eliminate
them from further analysis. Next, a rectangle within
the region identified above is selected and reduced by
a pre-specified percentage. This region is likely to be
free of irrelevant features and so, in most of cases,
corresponds to the final ROI. However, a final step is
needed in some cases: an iterative process to reduce
the size of the ROI until no background areas remain.
ICAART2014-InternationalConferenceonAgentsandArtificialIntelligence
396

2.1.2 Color Analysis
Some categories show different color characteristics
and, for this reason, images were analyzed not only in
grayscale but also using the Lab color space.
• A grayscale image represents the color as gray
levels from black to white. In order to analyze the
texture over grayscale images, the three channels
of the ROI in RGB are converted into a single gray
channel and its texture is subsequently extracted.
• The CIE 1976 L*a*b color space (McLaren,
1976) is a chromatic color space appropriate for
texture analysis. Using the Lab color space entails
converting the three channels of the ROI in RGB
to the three components of Lab. Then, each com-
ponent is individually analyzed in terms of tex-
ture and the final descriptor is the concatenation
of these three individual descriptors.
2.1.3 Texture Analysis
Texture is used to characterize the interference pat-
terns of the grading scale considered. As several
methods for texture analysis could be applied, five
popular techniques are tested in this research:
• Butterworth filters (Gonzalez and Woods, 2008)
are frequency domain filters that have an approx-
imately flat response in the bandpass frequency,
which gradually decays in the stopband. The or-
der of the filter defines the slope of the decay. A
bank of Butterworth filters composed of 9 second
order filters was used, with bandpass frequencies
covering the whole frequency spectrum. The fil-
ter bank maps each input image to 9 output im-
ages, one per frequency band. Each output image
was normalized separately and then a uniform his-
togram with non-equidistant bins was computed.
Since 16-bin histograms were used, the feature
vectors contain 16 components per filter.
• Gabor filters (Gabor, 1946) are complex expo-
nential signals modulated by Gaussian functions.
The parameters of Gabor filters define their shape,
and represent their location in the spatial and fre-
quency domains. A bank of 16 Gabor filters cen-
tered at 4 frequencies and 4 orientations was cre-
ated. The filter bank maps each input image to 16
output images, one per frequency-orientation pair.
Using the same idea as in Butterworth filters, the
descriptor of each output image is its uniform his-
togram with non-equidistant bins. Since 13-bin
histograms were used in grayscale and 17-bin his-
tograms were used in Lab, the feature vectors con-
tain 13 and 17 components per filter, respectively.
• The discrete wavelet transform (Mallat, 1989)
generates a set of wavelets by scaling and translat-
ing a mother wavelet. The wavelet decomposition
of an image consists of applying these wavelets
horizontally and vertically, generating 4 subim-
ages (LL, LH, HL, HH) which are then subsam-
pled by a factor of 2. Then, the process is repeated
n− 1 times over the LL subimage, where n is the
number of scales. A generalized Daubechies al-
gorithm (Daubechies, 1992) was applied as the
mother wavelet. The descriptor of an input image
is constructed by calculating the mean and the ab-
solute average deviation of the input and LL im-
ages, and the energy of the LH, HL and HH im-
ages. Since 8 scales were used, the feature vectors
contain 42 components.
• Markov random fields generate a texture model by
expressing the gray values of each pixel in an im-
age as a function of the gray values in a neighbor-
hood of the pixel. In order to generate the descrip-
tor, the directional variances proposed in (C¸ esmeli
and Wang, 2001) were used. In this work, the
neighborhood of a pixel is defined as the set of
pixels within a Chebyshev distance d. Distances
from 1 to 10 were considered and, for a distance
d, the descriptor comprises 4d features.
• Co-occurrence features analysis (Haralick et al.,
1973) is based on the computation of the condi-
tional joint probabilities of all pairwise combina-
tions of gray levels. For a given distance and an
orientation, this method generates a set of gray
level co-occurrence matrices and extracts several
statistics from their elements. In general, the num-
ber of orientations and matrices for a distance d
is 4d. A set of 14 statistics proposed in (Har-
alick et al., 1973) was computed from each co-
occurrence matrix. The descriptor of an image
consists of 2 properties,the mean and range across
matrices of these statistics, thus obtaining a fea-
ture vector with 28 components per distance. Us-
ing the Chebyshev distance as in Markov random
fields, distances from 1 to 17 were considered.
2.2 Feature Selection
Feature selection is a dimensionality reduction tech-
nique which consists of removing the irrelevant and
redundant features in order to obtain a reduction in
processing time without a degradation in performance
(Guyon et al., 2006). Among the different feature se-
lection techniques that can be found in the literature,
filters are used in this research for several reasons: (1)
they are the least time-consuming, (2) they rely on
the general characteristics of the training data, and (3)
FeatureSelectionAppliedtoHumanTearFilmClassification
397

they are independent of the induction algorithm. In
summary, filters are computationally simple and fast.
Three filters were selected in this research based on
previous works (Bol´on-Canedo et al., 2013):
• Correlation-based feature selection (Hall, 1999)
is a simple algorithm that ranks feature subsets ac-
cording to a correlation based heuristic. The bias
of this function is toward subsets that contain fea-
tures that are highly correlated with the class and
uncorrelated with each other. Irrelevant features
should be ignored because they will have low cor-
relation with the class; whilst redundant features
should be discarded since they will be highly cor-
related with at least one of the remaining features.
• Consistency-based filter (Dash and Liu, 2003)
evaluates the worth of a subset of features by
the level of consistency in the class values when
the instances are projected onto the subset of at-
tributes. The algorithm generates a random subset
S from the number of features in every round. If
the number of features of S is lower than the best
current set (S
best
), the data with the features pre-
scribed in S is checked against the inconsistency
criterion. If its inconsistency rate is below a pre-
specified one, S becomes the new S
best
. The in-
consistency criterion specifies to what extent the
dimensionally reduced data can be accepted.
• INTERACT (Zhao and Liu, 2007) is a subset fil-
ter based on symmetrical uncertainty (SU) and the
consistency contribution (CC), which is an indi-
cator about how significantly the elimination of a
feature will affect consistency. The algorithm is
made up of two parts: (1) the features are ranked
in descending order based on their SU values, and
(2) the features are evaluated one by one starting
from the end of the ranked feature list. If the CC
of a feature is lower than an established threshold,
the feature is removed, otherwise it is selected.
2.3 Classification
Once all the features are extracted from the ROI of a
single image, the obtained descriptor has to be clas-
sified into one of the considered categories. For this
task, a support vector machine (SVM) (Burges, 1998)
is trained according to the results presented in (Reme-
seiro et al., nd). In the aforesaid paper, an statisti-
cal analysis of machine learning algorithms was per-
formed, and the SVM was selected as the most com-
petitive method for the problem at hand, compared
with methods such as Naive Bayes or decision trees.
2.4 Performance Evaluation
After the SVM is trained, the performance of the sys-
tem is evaluated in terms of two different measures of
relevance to the problem in question:
• The classification error is computed as the per-
centage of incorrectly classified instances.
• The feature extraction time is computed as the
time that the texture analysis methods take to ex-
tract the selected features from a single image.
Note that this does include neither the time of
training a classifier nor the time of performing
feature selection, since they are off-line processes.
3 EXPERIMENTAL STUDY
The aim of this research is to present a methodology
based on color texture analysis and feature selection
to classify tear film images acquired with the Doane
interferometer. This methodology is tested in order to
improve previous results (Remeseiro et al., nd). The
materials and methods used in this research are pre-
sented in this section.
3.1 Data Source
In order to test the proposed methodology, a bank of
images acquired from dry eye patients with average
age 55 ± 16 was used. This dataset is publicly avail-
able in (VOPTICAL
GCU, nd). All images in this
bank have been annotated by two optometrists from
the Department of Life Sciences, Glasgow Caledo-
nian University (Glasgow, UK).
The acquisition of the images was carried out with
the Doane interferometer (Doane, 1989) and a digi-
tal PC-attached CMEX-1301 camera (CMEX-1301x,
nd). The ImageFocus Capture and Analysis soft-
ware (ImageFocus, nd) was used for image capture,
and images were stored at a spatial resolution of
1280× 1024 pixels in the RGB color space. Multiple
images were taken for up to one minute and, due to the
various artifacts associated with image capture, many
of them were unsuitable for analysis. Therefore, op-
tometrists selected only those images taken shortly af-
ter blinking, and when the eye was fully open.
The bank is composed of 106 images and in-
cludes samples from the five categories considered:
11 strong fringes, 25 coalescing strong fringes, 30
fine fringes, 26 coalescing fine fringes and 14 debris.
These grades of interference patterns were defined by
experimented optometrists in (Remeseiro et al., nd),
and are defined as follows (see Figure 3):
ICAART2014-InternationalConferenceonAgentsandArtificialIntelligence
398
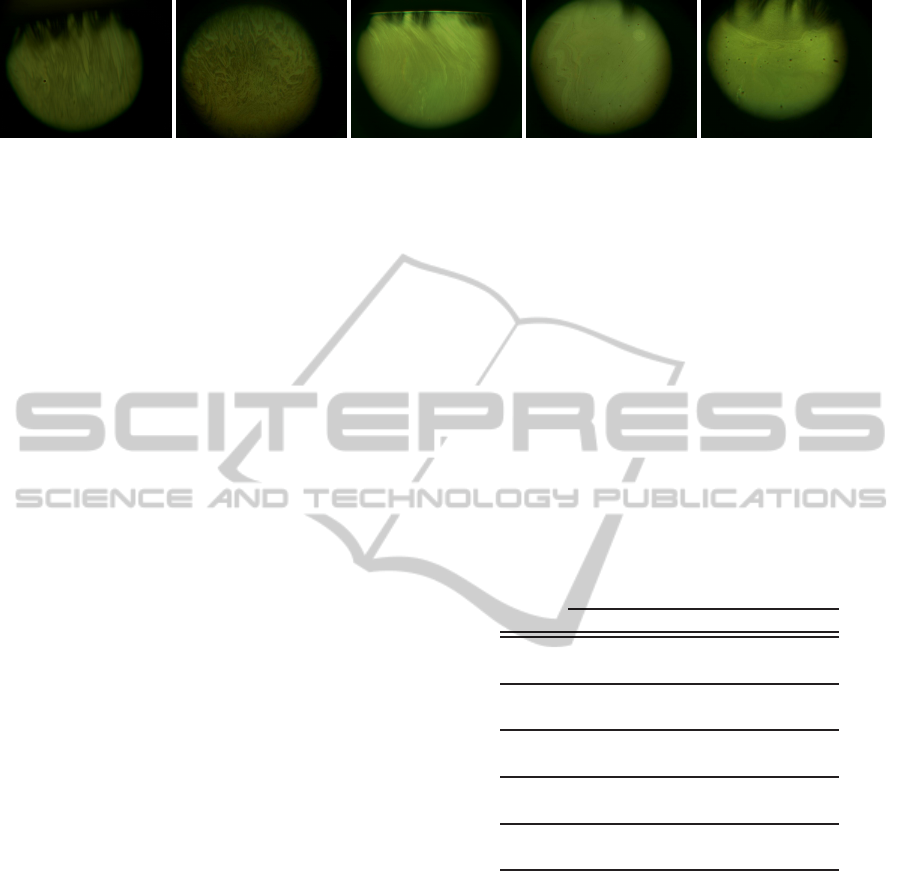
(a) (b) (c) (d) (e)
Figure 3: (a) Strong fringes. (b) Coalescing strong fringes. (c) Fine fringes. (d) Coalescing fine fringes. (e) Debris.
• Strong fringes. Obvious color fringes with an ap-
pearance of spreading across the cornea.
• Coalescing strong fringes. Obvious color fringes,
but coalescing into islands of color.
• Fine fringes. Gray fringes with an appearance of
spreading across the cornea.
• Coalescing fine fringes. Gray fringes, but coalesc-
ing into islands of gray.
• Debris. Obvious disturbances in the tear film,
likely to be of varying origin.
3.2 Experimental Procedure
The experimental procedure is detailed as follows:
• Apply the five texture analysis methods (see Sec-
tion 2.1.3) to the dataset of images using the two
color spaces (see Section 2.1.2).
• Apply the three feature selection filters (see Sec-
tion 2.2) to the dataset to obtain the subset of fea-
tures that properly describe the problem at hand.
• Train a SVM (see Section 2.3) with radial ba-
sis kernel and automatic parameter estimation. A
leave-one-out cross-validation was used, so the
average error across all trials was computed.
• Evaluate the effectiveness of the proposed
methodology in terms of two performance mea-
sures (see Section 2.4).
Experimentation was performed on an
Intel
R
Core
TM
i5 CPU 760 @ 2.80GHz with
RAM 4 GB.
4 RESULTS AND DISCUSSION
The results obtained with each color space (grayscale
and Lab), each texture analysis method (Butterworth
filters - BF, Gabor filters - GF, the discrete wavelet
transform - DWT, Markov random fields - MRF, and
co-occurrence features - CF), and each feature selec-
tion filter (correlation-based feature selection - CFS,
consistency-based filter - Cons, and INTERACT -
INT) will be analyzed in terms of the two perfor-
mance measures described above (classification error
and feature extraction time). Bear in mind that the
column None in the tables of this section shows the re-
sults when no feature selection was performed. Also,
as a leave-one-out cross-validation was performed,
the error, the number of features, and the time for ex-
tracting them were computed as an average value.
Table 1 shows the number of features selected by
each of three feature selection filters. In average, CFS
and INTERACT retain the 4.9% and 2.08% of the
features, respectively; whilst consistency-based fil-
ter performed the most aggressive selection retaining
only the 1.4% of the features.
Table 1: Number of features. From top to bottom, each cell
contains the results corresponding to grayscale and Lab.
None CFS Cons INT
BF
144 12.52 8.91 11.43
432 20.65 5.89 12.75
GF
208 13.92 7.06 9.68
816 23.69 6.28 12.72
DWT
42 10.95 5.9 6.18
126 17.67 6.05 8.80
MRF
220 9 7.23 8.87
660 21.34 6.42 11.56
CF
476 37.64 4.49 16.83
1428 55.9 4.3 28.75
Table 2 shows the test errors for all color spaces,
texture analysis methods and feature selection filters
after applying the SVM classifier, where the best re-
sult for each combination appears highlighted. In
general, all texture analysis techniques perform quite
well providing results below 16% error. Regarding
the texture and color analysis without performing fea-
ture selection, it can be seen that the use of color in-
formation slightly improves the results achieved when
compared to grayscale analysis since some categories
contain not only morphological features, but also
color features. On the other hand, all texture extrac-
tion methods perform quite well, but co-occurrence
features generate the best results, closely followed
by Gabor filters. Despite the fact that Markov ran-
dom fields use neighborhood information, as does
FeatureSelectionAppliedtoHumanTearFilmClassification
399

co-occurrence features analysis, the Markov method
does not perform as well because less information is
included in the final descriptor. In essence, the combi-
nation of co-occurrence features and the INTERACT
filter outperform the other methods, with the best re-
sult of 9.4% error using grayscale images. Regard-
ing feature selection, it outperforms primal results in
five out twelve pairwise combinations of color spaces
and texture analysis techniques using CFS and IN-
TERACT filters. However, the consistency-based fil-
ter produced a degradation in performance in all the
combinations due to its aggressive selection.
Table 2: Mean test classification error (%). From top
to bottom, each cell contains the results corresponding to
grayscale and Lab.
None CFS Cons INT
BF
15.10 18.87 18.87 20.76
16.88 21.70 18.87 15.10
GF
16.04 25.47 28.31 20.76
11.32 16.98 33.02 17.93
DWT
24.53 20.76 30.19 20.76
21.70 13.21 18.87 20.76
MRF
21.70 22.65 26.42 23.59
15.10 24.53 23.59 25.47
CF
11.32 11.32 13.21 9.44
11.32 13.21 16.04 15.10
The automatic grading system for human tear
films should provide results to the clinicians in a very
brief period of time, since waiting too long in front
of a computer could be a reason for rejection of its
use. In this sense, applying feature selection meth-
ods to reduce the number of input attributes and, thus,
the time needed for extracting texture features can be
a key step in order to improve the automatic system.
In this sense, Table 3 shows the times needed for an-
alyzing color and texture information of one single
image, where the best result for each combination ap-
pears highlighted. Notice that co-occurrence features
has been known to be slow and, for this reason, an op-
timization of the method based on (Clausi and Jerni-
gan, 1998) was used in this research.
According to Tables 2 and 3, the effectiveness of
using feature selection is demonstrated since, in most
cases, the time is significantly reduced without wors-
ening the performance. In eleven out twelve pairwise
combinations, the lowest times are obtained using
the most aggressive algorithm, which is consistency-
based filter, and in only one case INTERACT outper-
forms it. The maximum processing time that would
be accepted in this clinical system is around 10 or 20
seconds, and only two methods for texture analysis
can be rejected for this reason (Butterworth filters and
Markov random fields). Furthermore, both discrete
Table 3: Feature extraction time (s). From top to bottom,
each cell contains the results corresponding to grayscale and
Lab.
None CFS Cons INT
BF
101.76 68.25 62.82 63.89
305.17 132.96 47.96 109.60
GF
20.72 8.32 6.80 7.49
62.70 19.89 8.09 13.38
DWT
0.96 0.68 0.46 0.44
3.00 1.45 0.59 0.89
MRF
74.05 50.82 33.20 56.98
221.72 104.96 29.29 67.02
CF
58.69 6.22 0.42 3.31
169.22 20.58 0.34 8.47
wavelet transform and co-occurrence features analy-
sis take less than 1 second in providing results so the
system could work in real-time using these two tex-
ture analysis techniques.
Among all the combinations of methods, it is a
very difficult task to select the best combination since
two performance measures are considered. Although
co-occurrence features analysis outperforms the other
methods in terms of classification error and provides
good results regarding feature extraction time, the
Pareto front (Teich, 2001) for each alternative was
computed in order to analyze the balance between er-
ror and time. In the context of multi-objective op-
timization, the Pareto front is defined as the set of
points which are equally satisfying the constraints of
the corresponding problem. Thus, selecting a solution
in the Pareto front would imply to select a better solu-
tion than any outside the Pareto front. In this research,
solutions are constrained to minimize both classifica-
tion error and feature extraction time. Figure 4 shows
the points in the Pareto front marked with a red circle.
These three points correspond to: (1) co-occurrence
features using grayscale images and INTERACT, (2)
co-occurrence features using grayscale images and
consistency-based filter, and (3) co-occurrence fea-
tures using images in the Lab color space after ap-
plying the consistency-based filter. The selection of
one of these three points will depend on if it is prefer-
able to minimize either the error or the time for the
problem at hand.
The three points in the Pareto front were analyzed
in order to try to shed light on this issue. For rea-
sons of simplicity, these three points will be referred
with the numbers in Figure 4. Using the combina-
tion (2), the number of features considered is ap-
proximately the same than using the combination (3)
(4.49 and 4.3 features in average). However, the time
needed for extracting these features is lower if the op-
tion (3) is considered (0.42 and 0.34 seconds in aver-
ICAART2014-InternationalConferenceonAgentsandArtificialIntelligence
400
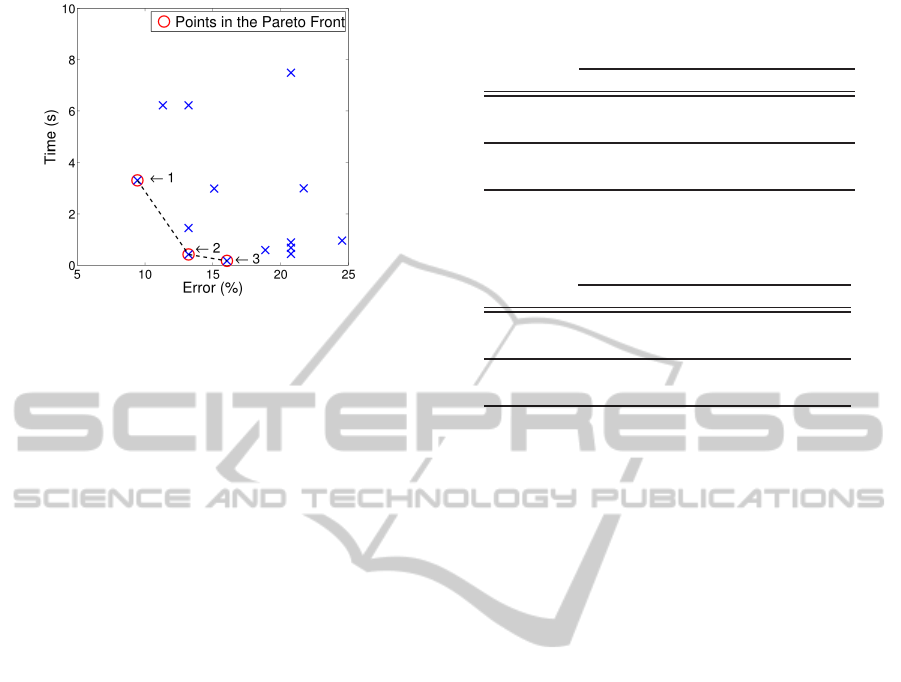
Figure 4: Pareto front for all the combinations of methods
for texture extraction, color analysis and feature selection.
age). Comparing the options (1) and (2), it can be
seen that the number of features in (1) is almost 4
times the number of features in (2), whilst the time
is 8 times greater. This fact lead us to a depth anal-
ysis of the features extracted with the co-occurrence
features analysis, since the time needed for obtaining
its features is not homogeneous. Features are vector-
ized in groups of 28 related to distances and channels
in the color space. Each group of 28 features corre-
sponds with the mean and range of 14 statistics across
the co-occurrence matrices. Some experiments were
performed on the time the method takes to compute
each of the 14 statistics. Results disclosed that com-
puting only the 14
th
statistic, which corresponds with
the maximal correlation coefficient (Haralick et al.,
1973), takes around 60% of the total time.
After this analysis focus on the individual features
of the method proposed by Haralick, the aim here is to
explore the impact of removing all the 14
th
statistics.
In this manner, Tables 4 and 5 show the classification
error and the feature extraction time, respectively, for
this experiment. From top to bottom, each cell con-
tains the results previously obtained and the results if
the 14
th
statistics are excluded from each set of fea-
tures. As can be seen in Table 4, the error is reducedin
three out eight combinations, and maintained in two
out eight combinations. Regarding Table 5, the time
is reduced in seven out eight combinations and main-
tained in the other one. Thus, the exclusion of the
14
th
statistic allows to improve the performance of the
methodology. However, it is also important to remark
the effectiveness of the INTERACT filter for selecting
the most appropriate features since simply removing
the 14
th
statistics from the original set of features not
only takes more time to perform feature extraction,
but also produces worse results in terms of error.
Table 4: Mean test classification error (%). From top to
bottom, each cell contains the results corresponding to the
experiment with and without the 14
th
statistic.
None CFS Cons INT
CF+gray
11.32 11.32 13.21 9.44
15.10 14.15 13.21 8.49
CF+lab
11.32 13.21 16.04 15.10
11.32 10.38 16.98 14.15
Table 5: Feature extraction time (s). From top to bottom,
each cell contains the results corresponding to the experi-
ment with and without the 14
th
statistic.
None CFS Cons INT
CF+gray
58.69 6.22 0.42 3.31
24.40 3.93 0.42 1.92
CF+lab
169.22 20.58 0.34 8.47
75.59 5.26 0.31 2.71
5 CONCLUSIONS AND FUTURE
RESEARCH
An automatic grading system to measure the quality
of human tear films was developed in previous re-
search, but it requires a too long time for extracting
some texture features. This time prevents the clini-
cal use of the system, so the aim of this work is im-
proving previous results focus on reducing the pro-
cessing time. For this task, three of the most popu-
lar feature selection filters (correlation-based feature
selection, consistency-based filter and INTERACT)
were tested. Results obtained with this methodology
surpass the previous approach in terms of processing
time and, furthermore, improves slightly the accuracy
of the system.
In clinical terms, the importance of the proposed
methodology lies in providing objective results in
real-time, which saves time for experts who do the
process by hand. Specifically, the system is able to
automatically classify the images obtained using the
Doane interferometer with an error lower 9% and a
processing time under one second.
Future work will involve performing local analy-
sis in order to segment one single tear film image in
different categories. The motivation is that although
some tear film images, from an individual subject,
conformed to a single pattern, it was more common
for them to be made up of a combination of differ-
ent patterns. In addition, investigation of dynamic
changes seen in the tear film during the inter-blink
time interval would help in identifying subjects with
poor tear film stability.
FeatureSelectionAppliedtoHumanTearFilmClassification
401

ACKNOWLEDGEMENTS
This research has been partially funded by the Sec-
retar´ıa de Estado de Investigaci´on of the Spanish
Government and FEDER funds of the European
Union through the research projects PI10/00578 and
TIN2011-25476. Beatriz Remeseiro acknowledges
the support of Xunta de Galicia under Plan I2C Grant
Program.
We would also like to thank the School of Health
and Life Sciences, Glasgow Caledonian University
for providing us with the annotated image datasets.
REFERENCES
Bol´on-Canedo, V., S´anchez-Maro˜no, N., and Alonso-
Betanzos, A. (2013). A review of feature selection
methods on synthetic data. Knowledge and Informa-
tion Systems, 34(3):483–519.
Brewitt, H. and Sistani, F. (2001). Dry Eye Disease: The
Scale of the Problem. Survey of Ophthalmology,
45(2):199–202.
Bron, A. J. (2001). Diagnosis of Dry Eye. Survey of Oph-
thalmology, 45(2).
Burges, C. J. (1998). A Tutorial on Support Vector Ma-
chines for Pattern Recognition. Data Mining and
Knowledge Discovery, 2:121–167.
C¸esmeli, E. and Wang, D. (2001). Texture Segmentation
Using Gaussian-Markov Random Fields and Neural
Oscillator Networks. IEEE Transactions on Neural
Networks, 12.
Clausi, D. and Jernigan, M. (1998). A Fast Method to Deter-
mine Co-occurrence Texture Features. IEEE Transac-
tions on Geoscience and Remote Sensing, 36(1):298–
300.
CMEX-1301x (n.d.). CMEX-1301x camera. Euromex Mi-
croscopen BV, Arnhem, The Netherlands.
Dash, M. and Liu, H. (2003). Artificial intelligence, 151(1-
2):155–176.
Daubechies, I. (1992). Ten Lectures on Wavelets. SIAM,
CBMS series.
Doane, M. G. (1989). An instrument for in vivo tear
film interferometry. Optometry and Vision Science,
66(6):383–388.
E.Wolff (1954). Anatomy of the eye and orbit (4th edition).
H. K. Lewis and Co., London.
Freeman, M. H. and Hull, C. C. (2003). Interference and
optical films. Butterworth Heinemann.
Gabor, D. (1946). Theory of Communication. Journal of
Institute for Electrical Engineering, 93:429–457.
Gonzalez, R. and Woods, R. (2008). Digital image process-
ing. Pearson/Prentice Hall.
Guillon, J. P. and Guillon, M. (1997). Tearscope plus clini-
cal hand book and tearscope plus instructions. Keeler
Ltd. Windsor, Berkshire, Keeler Inc, Broomall, PA.
Guyon, I., Gunn, S., Nikravesh, M., and Zadeh, L. (2006).
Feature Extraction: Foundations and Applications.
Springer Verlag.
Hall, M. (1999). Ph.D dissertation, The University of
Waikato.
Haralick, R. M., Shanmugam, K., and Dinstein, I. (1973).
Texture Features for Image Classification. IEEE
Transactions on Systems, Man, and Cybernetics In
Systems, Man and Cybernetics, 3:610–621.
ImageFocus (n.d.). ImageFocus Capture and Analysis
software. Euromex Microscopen BV, Arnhem, The
Netherlands.
Jie, Y., Xu, L., Wu, Y. Y., and Jonas, J. B. (2008). Preva-
lence of dry eye among adult Chinese in the Beijing
Eye Study. Eye, 23(3):688–693.
Mallat, S. G. (1989). A theory for multiresolution signal de-
composition: the wavelet representation. IEEE Trans-
actions on Pattern Analysis and Machine Intelligence,
11:674–693.
McLaren, K. (1976). The development of the CIE 1976
(L*a*b) uniform colour-space and colour-difference
formula. Journal of the Society of Dyers and
Colourists, 92(9):338–341.
Moss, S. E. (2000). Prevalence of and Risk Factors for
Dry Eye Syndrome. Archives of Ophthalmology,
118(9):1264–1268.
Remeseiro, B., Oliver, K., Tomlinson, A., Martin, E., Bar-
reira, N., and Mosquera, A. (n.d.). Automatic grading
system for human tear films. Under review.
Teich, J. (2001). Pareto-front exploration with uncertain ob-
jectives. In Evolutionary multi-criterion optimization,
volume 1993, pages 314–328. Springer.
Thai, L. C., Tomlinson, A., and Doane, M. G. (2004). Effect
of Contact Lens Materials on Tear Physiology. Op-
tometry and Vision Science, 81(3):194–204.
VOPTICAL
GCU (n.d.). VOPTICAL GCU, VARPA
optical dataset annotated by optometrists from
the Department of Life Sciences, Glasgow Cale-
donian University (UK). [Online] Available:
http://www.varpa.es/voptical
gcu.html, last access:
december 2013.
Zhao, Z. and Liu, H. (2007). Searching for interacting fea-
tures. pages 1156–1161.
ICAART2014-InternationalConferenceonAgentsandArtificialIntelligence
402
