
Identification of Gait Events using Expert Knowledge and Continuous
Wavelet Transform Analysis
Siddhartha Khandelwal and Nicholas Wickstr¨om
Intelligent Systems Laboratory, Halmstad University, Box 823, SE-301 18, Halmstad, Sweden
Keywords:
Gait Event Detection, Wavelet Analysis, Accelerometers, Outdoor Walking, Continuous Wavelet Transform.
Abstract:
Many gait analysis applications involve long-term or continuous monitoring which require gait measurements
to be taken outdoors. Wearable inertial sensors like accelerometers have become popular for such applications
as they are miniature, low-powered and inexpensive but with the drawback that they are prone to noise and re-
quire robust algorithms for precise identification of gait events. However, most gait event detection algorithms
have been developed by simulating physical world environments inside controlled laboratories. In this paper,
we propose a novel algorithm that robustly and efficiently identifies gait events from accelerometer signals
collected during both, indoor and outdoor walking of healthy subjects. The proposed method makes adept
use of prior knowledge of walking gait characteristics, referred to as expert knowledge, in conjunction with
continuous wavelet transform analysis to detect gait events of heel strike and toe off. It was observed that in
comparison to indoor, the outdoor walking acceleration signals were of poorer quality and highly corrupted
with noise. The proposed algorithm presents an automated way to effectively analyze such noisy signals in
order to identify gait events.
1 INTRODUCTION
Gait is generally defined as the manner or way of
walking. The healthy locomotor system integrates in-
put from the motor cortex, cerebellum, and the basal
ganglia, as well as feedback from visual, vestibular
and proprioceptive sensors to produce controlled mo-
tor commands that result in coordinated muscle fir-
ings and limb movements (Hausdorff, 2007). This
multi-levelneural-locomotorcontrol system produces
a stable gait and a highly consistent walking pattern
while improper co-ordination may lead to deviations
from normal gait behavior resulting in unstable gait.
Gait analysis involves measuring and understanding
various parameters of gait to interpret and draw con-
clusions on physiological, pathological and psycho-
logical factors modulating healthy or unhealthy gait.
In recent years, technological advances have made it
possible to develop better techniques for gait anal-
ysis and as such its applications have grown mani-
fold. It can be used to design and optimize functional
electrical stimulation (FES) systems (Williamson and
Andrews, 2000; Mansfield and Lyons, 2003), clini-
cal tool for diagnosis and severity analysis of neuro-
physiological disorders and impairments (Socie et al.,
2013), elucidate the working of our neuro-locomotory
system (Hausdorff, 2007), assess the quality of gait of
amputees and rehabilitating patients (Aminian et al.,
2004; Selles et al., 2005), recognize different walking
behaviors (Hafner and Bachmann, 2008), predict and
evaluate the risk of falls in older adults (Reelick et al.,
2009; Callisaya et al., 2010) and many more.
Gait is comprised of sequential gait cycles and
each such gait cycle is composed of a sequence of
events that mark the transition from one gait phase
to another (Rueterbories et al., 2010). In the tempo-
ral domain, gait events are expressed as a function of
time while in the spatial domain, gait movements are
expressed as a function of the orientation of the limbs
and joints. In terms of temporal domain parameters,
the two most relevant events in a normal gait cycle are
the initial heel contact or heel strike (HS) and termi-
nal contact or toe off (TO). Both these key events are
widely used in gait analysis because of the aforemen-
tioned applications and the fact that other temporal
parameters like swing, stance and stride time can be
directly computed from them. Thus detecting HS and
TO accurately is of vital importance in clinical gait
analysis and many sensors have been used to this end.
Force plates and camera-based motion capture
(mocap) systems are considered as the “gold stan-
dard” or reference for identifying gait events (Miller,
197
Khandelwal S. and Wickström N..
Identification of Gait Events using Expert Knowledge and Continuous Wavelet Transform Analysis.
DOI: 10.5220/0004799801970204
In Proceedings of the International Conference on Bio-inspired Systems and Signal Processing (BIOSIGNALS-2014), pages 197-204
ISBN: 978-989-758-011-6
Copyright
c
2014 SCITEPRESS (Science and Technology Publications, Lda.)

2009; Desailly et al., 2009). Force plates capture
the ground reaction force caused by the pressure ex-
erted by the foot on them. Thus by applying simple
thresholds on the recorded force, individual events of
HS and TO can be precisely identified (Mills et al.,
2007). Camera-based mocap systems track markers
that are placed on the body (Hanlon and Anderson,
2009; Aung et al., 2013). Generally, a laboratory
setup consists of a pair of force plates (one for each
foot) that is used concurrently with the mocap sys-
tem. Though these devices provide relatively pre-
cise measurements, they are highly expensive, immo-
bile and require competence in maintenance, opera-
tion and execution. The fact that they record the infor-
mation of only a couple of steps renders them inade-
quate for applications that need long-term or continu-
ous gait monitoring. For example, some authors have
hypothesized that in-coordination between the neu-
ral and locomotor control systems results in specific
gait patterns which can be used for analyzing neuro-
physiological disorder patients (Stolze et al., 2004;
Hausdorff, 2007) or older adults that have a fear of
falling (Herman et al., 2005; Reelick et al., 2009).
These applications would essentially require mobile
sensors and robust gait analysis algorithms for day-
to-day monitoring of such patients.
Pressure sensitive mats and foot switches provide
the option of being used outside the laboratory for
measuring gait events. The pressure sensitive mat
(e.g.GaitRite) consists of a grid of pressure sensors
that can be few meters in length (McDonough et al.,
2001). Foot switches like force sensitive resistors can
be attached at various positions below the feet or in-
soles of the shoe (Williamson and Andrews, 2000;
Aminian et al., 2002; Lau and Tong, 2008). How-
ever there have been studies to show that they are less
reliable and not durable over longer periods (Mans-
field and Lyons, 2003) and cannot differentiate be-
tween foot load changes due to walking and those
caused by weight shifting for non-walking tasks (Pap-
pas et al., 2001). Hence, from a long-term perspec-
tive, they might not be convenient for outdoor use in
daily life and be prone to mechanical failures. More-
over, these sensors provide only temporal information
and thus restrict the scope for any further analysis in-
volving spatial parameters of gait.
Consequently, for such long-term gait monitor-
ing and daily life applications, an alternative is to
use wearable inertial sensors like accelerometers and
gyroscopes. Advancements in MEMS technology
have made them miniature, low-powered, durable, in-
expensive, highly mobile and readily available (Ka-
vanagh and Menz, 2008). In recent years, many
gait event identification algorithms have been devel-
oped using inertial sensors (Rueterbories et al., 2010).
While some have used gyroscopes (Pappas et al.,
2001; Aminian et al., 2002; Lee and Park, 2011),
others have found it appropriate to use accelerome-
ters (Williamson and Andrews, 2000; Mansfield and
Lyons, 2003; Selles et al., 2005; Hanlon and Ander-
son, 2009; Sant’Anna and Wickstr¨om, 2010; Aung
et al., 2013). A major drawback of using inertial
sensors is that they provide highly noisy information
and thus require very robust algorithms for gait anal-
ysis. Based on the quality and type of information
they provide, some authors have discussed the pros
and cons of using either accelerometers or gyroscopes
(Aminian et al., 2002; Lau and Tong, 2008) though it
must be noted that these sensors are used and well re-
searched in other fields like aerospace and humanoids
(Khandelwal and Chevallereau, 2013). In the con-
text of gait event analysis, accelerometers seem to
be a better choice than gyroscopes for developing
automated gait event identification systems. Sudden
movements like jerks or turns during walking would
cause large gyro drift errors. Furthermore, gyroscopes
have high power consumption, long reaction time and
are very sensitive to temperature effects limiting their
long-term outdoor use (Tan and Park, 2005; Wood-
man, 2007). Accelerometers, on the other hand, suf-
fer from noise due to mechanical vibrations and cali-
bration errors but these do not diverge in time and in
many cases can be handled effectively.
Recently, many methods have been developed
for identifying gait events only from accelerometer
data. Some of these algorithms apply different tech-
niques to analyze signals obtained from individual
accelerometer axis (Williamson and Andrews, 2000;
Mansfield and Lyons, 2003; Selles et al., 2005; Tor-
realba et al., 2010). Hence, at the beginning of the
experiment, the accelerometer is positioned in some
specific orientation such that each accelerometer axis
is aligned with some pre-defined limb axis and the
assumption is made that the accelerometer shall stay
statically positioned during the entire movement of
the experiment. Otherwise, either the axis alignment
should be readjusted frequently or the exact orien-
tation of the accelerometer must be known through-
out the experiment (which might be difficult to es-
timate) to compensate for the misalignment of the
axes. A possible alternative could be to analyze the
resultant accelerometer signal instead as it is invari-
ant to individual axis alignment. Some other meth-
ods use machine learning techniques (Williamson and
Andrews, 2000; Aung et al., 2013) but the difficulty
with such algorithms is that they depend on labeled
training data and the addition or exclusion of any
parameter would require re-training the entire algo-
BIOSIGNALS2014-InternationalConferenceonBio-inspiredSystemsandSignalProcessing
198

rithm. In recent years, wavelet transforms are being
increasingly used to develop gait event detection al-
gorithms (Aminian et al., 2002; Forsman et al., 2009;
Gouwanda and Senanayake, 2009; Aung et al., 2013)
as it supports simultaneous time frequency analysis
of non-stationary signals and have been shown to be
robust among peak detection algorithms (Yang et al.,
2009). Additionally, baseline trends can be implic-
itly removed and no preprocessing of the signal is re-
quired (Du et al., 2006). All methods and techniques
that were reviewed in this paper have been developed
by ‘simulating a physical world environment inside a
controlled laboratory’. Therefore there is a need for
a robust algorithm that can identify gait events from
acceleration signals collected in the ‘outdoor environ-
ment’.
This paper proposes a novel algorithm for the ro-
bust identification of gait events from accelerome-
ter data collected during indoor and outdoor walk-
ing. The developed method combines the knowl-
edge about some known gait characteristics referred
to as expert knowledge (EK) with continuous wavelet
transform (CWT) analysis of the resultant accelerom-
eter signal. The proposed method is applied on an
indoor walking dataset to evaluate its efficiency and
accuracy. The robustness of the algorithm is evalu-
ated by applying it on outdoor walking signals and
comparing the mean stride time calculated from the
left and right legs of each subject. Since the outdoor
walking signals were of poorer quality and noisier
than indoor, further analysis was required to identify
the gait events. The rest of this paper is organized into
four sections. Sections 2 & 3 describe the data collec-
tion procedure and the developed algorithm, respec-
tively. Section 4 presents the results while Section 5
concludes this paper and discusses future work.
2 EXPERIMENTS
Fifteen healthy volunteers participated in the experi-
ments with informed prior consent. Each subject had
two Shimmer (3-axis) accelerometers (sampling at
128 Hz) attached to both their ankles, just above their
lateral malleolus. Velcro straps were used to keep the
sensors in place. The subjects were instructed to walk
for about 25 minutes at their preferred walking speed
on an outdoor street which was not absolutely flat and
made of asphalt concrete. The proposed method was
also applied on a previously published dataset which
was collected from 6 subjects walking inside a labo-
ratory (Sant’Anna and Wickstr¨om, 2010). The exper-
iment used two Shimmer 3-axis accelerometers (sam-
pling at 50 Hz) positioned at the ankles and a 6m
long Gold GaitRite pressure sensitive mat (sampling
at 60 Hz) which had its own software for detecting
HS and TO. The pressure mat data was used as the
ground truth. All analysis was performed in MAT-
LAB (MathWorks, Natick, Massachusetts, USA).
3 METHODOLOGY
3.1 Continuous Wavelet Transform
The wavelet transform produces a time frequency de-
composition of the signal which separates individual
signal components more effectively than the short-
time Fourier transform. The ability to give the time
localization of the spectral components in a non-
stationary signal has rendered it a powerful tool for
processing of biosignals like EEG, EMG and ECG
(Rafiee et al., 2011). Wavelet transforms can be
mainly divided into discrete and continuous forms.
The former operates over scales and positions based
on powers of two making it non-redundant, computa-
tionally more efficient and sufficient for reconstruc-
tion of signal. The latter allows transforms at all
scales and positions, thus maintaining all information
without down-sampling which makes it appropriate
for tasks like peak detection (Du et al., 2006) and pat-
tern matching. The Continuous Wavelet Transform or
CWT of a signal, x(t), is given as:
CWT(a, b) =
1
√
a
Z
+∞
−∞
x(t)ψ
∗
(
t −b
a
)dt (1)
where ψ
∗
(t) is the complex conjugate of the wavelet
function ψ(t) and a and b are the dilation and loca-
tion parameters of the wavelet, respectively (Mallat,
1999). ψ(t), usually termed the mother wavelet func-
tion, must satisfy certain mathematical criteria like fi-
nite energy and no zero-frequency component to be
admissible (Addison, 2005). The dilation or scale
is inversely proportional to the spectral components.
Low scales or high frequencies provide more local in-
formation while high scales or low frequencies pro-
vide relatively more global information about the sig-
nal. This multi-resolution property of CWT makes it
appropriate for gait analysis.
3.2 Expert Knowledge
There are some characteristics that are particular to
gait signals which is used in conjunction with CWT
analysis to develop the proposed algorithm. These
known gait characteristics, namely, EK
1,2,3
are enu-
merated below:
IdentificationofGaitEventsusingExpertKnowledgeandContinuousWaveletTransformAnalysis
199
1. For a subject walking at their preferred walking
speed, the shape of the HS regions in the resultant
accelerometer signal have consistency throughout
the signal as shown in Figure 1a. TO regions have
a similar consistency but their peaks are lower
than HS because normally the heel strikes the
ground with higher force compared to the toe lift-
ing off the ground.
2. The activity of walking cannot be done at arbi-
trarily high speeds. There is an upper bound in
the frequencies that are generated during walking.
3. This is an extension of EK
2
. During walking
at preferred walking speed, the velocity might
change with fairly consistent stride time but there
is no random high jump in speed from one step to
the other. For example if one step is taken at x m/s
then the following next step cannot be at 1.5x m/s
for a ‘normal’ walk.
Each of these facts are utilized to develop the pro-
posed method. Figure 1a shows the resultant accel-
eration signal that is calculated from the individual
accelerations from each axis of the 3-axis accelerom-
eter. EK
1
is used to choose the mother wavelet that is
applied to this resultant acceleration signal. The CWT
gives continuous wavelet coefficients which illustrate
how well a wavelet function correlates with a specific
signal. Thus greater the correlation, higher will be
the CWT coefficients and vice-versa. The wavelet
‘symlet-4’ (sym4) is chosen as the mother wavelet
function ψ(t) which is near symmetric and orthog-
onal (Figure 1b). Sym4 wavelet highly matches or
correlates with the HS regions giving sharper peaks
at higher scales (called ridges) more than the TO
regions, thus providing a better separation between
them at the same scales. EK
2
is used to choose the
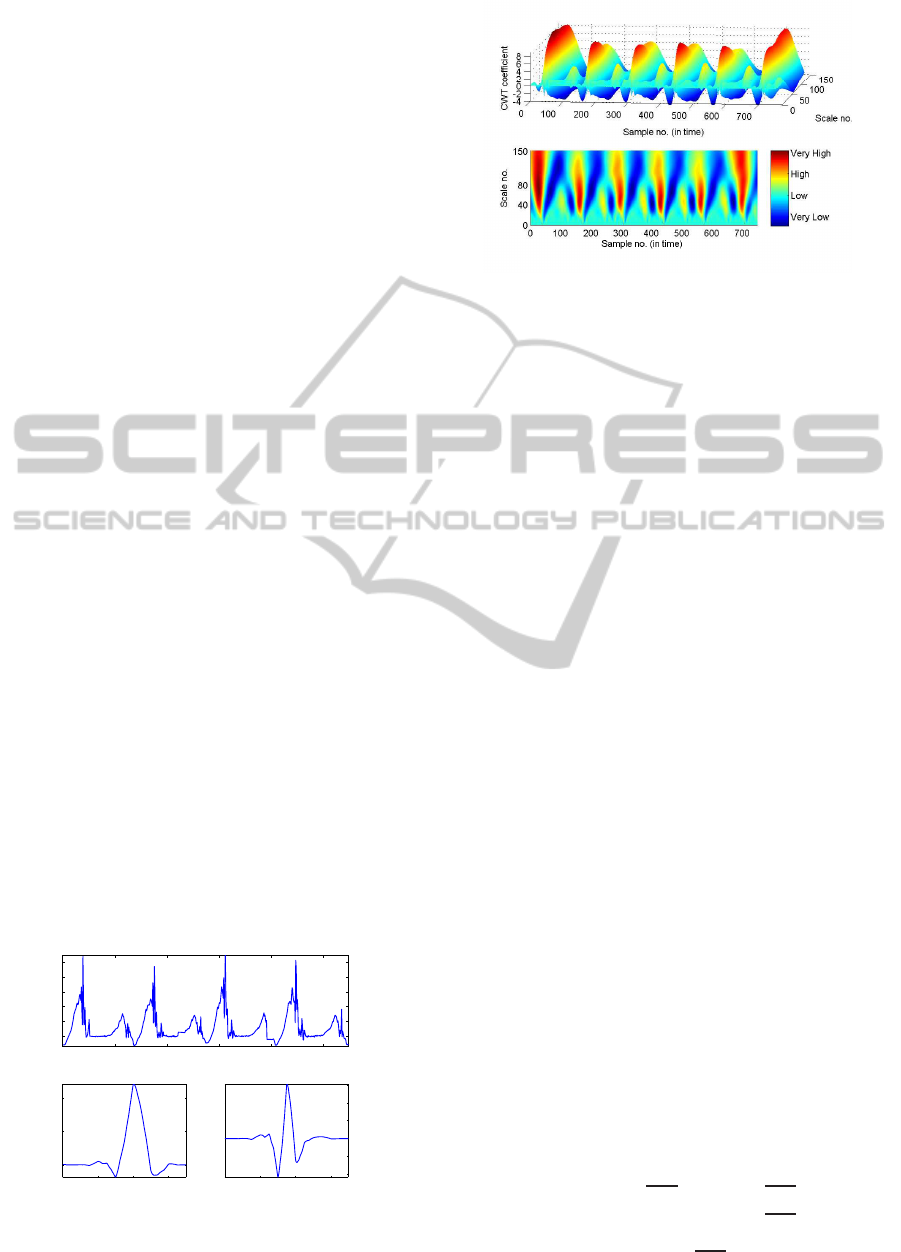
appropriate scales for further analysis. As shown in
Figure 2, the information on lower scales corresponds
to high frequency noise and artifacts which can be ex-
0 100 200 300 400 500
1
2
3
4
5
6
Sample no.
Amplitude
Resultant Acceleration signal
HS HS HS HS
TO TO TOTO
0 2 4 6
0
0.5
1
Scaling function − sym4
0 2 4 6
−1
−0.5
0
0.5
1
1.5
Wavelet function − sym4
Figure 1: (a) HS and TO regions in the resultant accelera-
tion signal from outdoor walking. (b) Scaling and wavelet
functions of sym4 wavelet.
Figure 2: CWT coefficients of the resultant acc. signal.
cluded. This is one of the many advantages of CWT
analysis as no pre-processing of the signal like noise
filtering or smoothing is required. The scales that
are chosen for further analysis are where the CWT
coefficients for the matched HS region are high and
form sharp ridges. In this case, as shown in Figure
2, the CWT coefficients are very high between scales
40 to 80. Thus they are chosen for further analysis
and these scale bounds are applied to the resultant ac-
celeration signals of all subjects. EK
3
is used in the
statistical diagnosis of stride time to automatically de-
tect the inconsistent HS and TO regions (explained in
Section 3.3.2 and 3.3.3).
3.3 Identification of Gait Events
3.3.1 Detecting the good HS
According to Eq.1, the CWT of the acceleration sig-
nal results in a CWT coefficients matrix or CCM that
is based on the scale and location parameters of the
sym4 wavelet. Each row of this matrix corresponds
to a chosen scale of the wavelet while each column
corresponds to that sample of the acceleration signal
where the wavelet is positioned or located. Thus an
element in this matrix represents the correlation be-
tween the wavelet and a signal sample at a givenscale.
The CCM matrix has a size mxn where m is the total
number of chosen scales and n is the total length of
the vector of the samples of the acceleration signal.
The maximum coefficient value in each column of the
CCM matrix represents the best matching for that sig-
nal sample from all chosen scales. A vector MC
1xn
is
defined which contains the maximum coefficient val-
ues from all n columns. A rough envelope (RE) of the
HS regions is obtained by subtracting the mean of MC
from MC and retaining all non-negative values from
the result (refer Figure 3a):
RE
1xn
=
(
MC−
MC if MC −MC ≥ 0
0 if MC−MC < 0
(2)
where MC = max(CCM) and MC = mean(MC).
BIOSIGNALS2014-InternationalConferenceonBio-inspiredSystemsandSignalProcessing
200
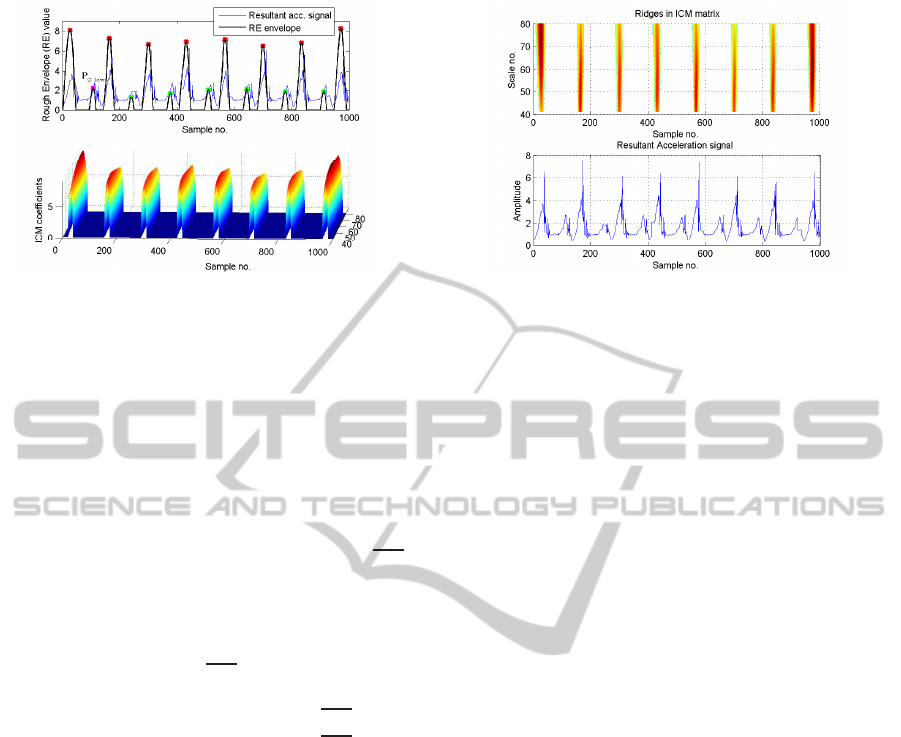
Figure 3: (a) Rough envelope (RE) of the HS and TO re-
gions. Red and green dots represent peaks that belong to
the C
high
and C
low
clusters respectively. The magenta dot
represents P
C−low
. (b) Coefficients of the ICM matrix.
Then all local maxima points or peaks in the rough
envelope are found and separated into two clusters us-
ing k-means clustering. One cluster, C
high
, comprises
high-valued peaks located in the HS regions while the
other cluster, C
low
, comprises low-valued peaks from
the TO regions (Figure 3a). The peak with the highest
value in the C
low
cluster is identified and labeled as
P
C−low
. All coefficients greater than (P
C−low
+
MC)
in the CWT coefficients matrix would approximately
correspond to only the HS regions. Thus an interme-
diate coefficients matrix (ICM
mxn
) is created from the
original CWT coefficients matrix by setting all coef-
ficients less than (P
C−low
+
MC) to zero:
ICM =
(
CCM if CCM > (P
C−low
+
MC)
0 if CCM 6 (P
C−low
+ MC)
(3)
The ICM coefficients (shown in Figure 3b) rep-
resent the probable HS event with sharp ridges. By
computing the local maxima along the columns in the
ICM matrix, the ridges that correspond to the occur-
rence of HS events are obtained, as shown in Figure 4.
The mean of local maxima points making each ridge
in the ICM matrix gives the good HS events in the
resultant acceleration signal. For a good quality sig-
nal with a high signal to noise ratio (SNR), all HSs
will probably be identified in this step which was the
case with the indoor walking dataset. However, the
acceleration signals collected during outdoor walking
were highly noisy with poor SNR. For such signals,
it is observed that few HS and TO regions are irregu-
larly shaped, i.e. they look different from the regular
HS and TO regions due to signal corruption, sampling
effects or other factors influencing noise (some exam-
ples are shown in Figures 5 and 6). Due to their irreg-
ular and inconsistent shape, these noisy HS regions
do not match with the sym4 wavelet as much as the
other regular HS regions and lead to lower peaks that
Figure 4: Ridges in the ICM matrix that correspond to HS.
do not fall in the C
high
cluster. As a result, the ridges
corresponding to these noisy HSs do not appear in the
ICM matrix and are undetected in this step. Similarly
it might be that the noisy TO regions might get in-
correctly identified as HS due to high peaks that fall
in the C
high
cluster. Using EK
3
, a statistical analysis
of stride time allows us to automatically detect these
irregular HS and TO regions and identify them cor-
rectly. Henceforth the terms ‘noisy HS’ and ‘noisy
TO’ are used to represent the HSs that were unde-
tected and TOs that were misidentified as HSs, in this
step, respectively.
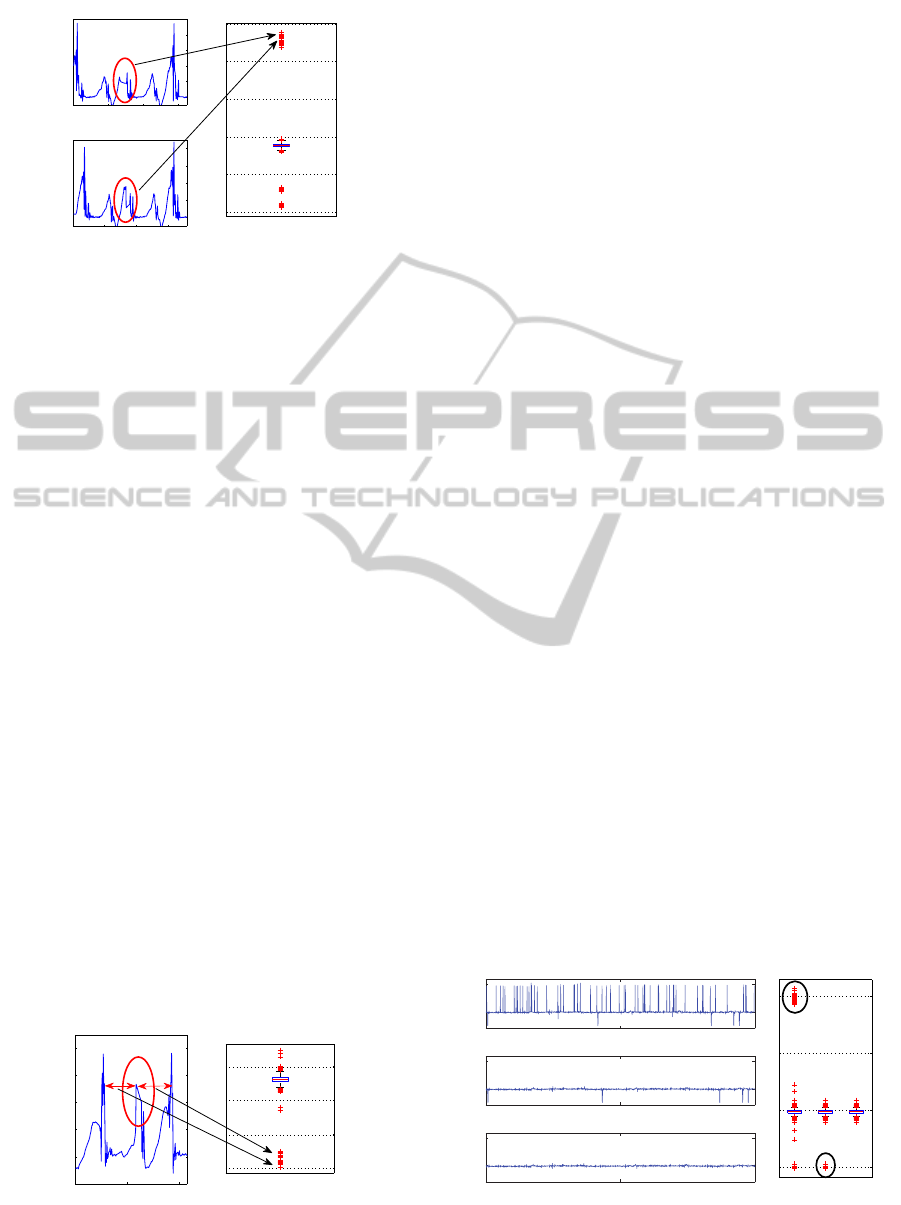
3.3.2 Locating the Noisy HS Events
The ridges corresponding to the noisy HS regions go
undetected in the previous step. An automated way to
find these missed HSs is by statistically investigating
stride time. Stride time is defined as the periodic time
between any two gait events such as HS. Using EK
2,3
it can be deduced that the stride time values which are
greater than 1.5 times the median stride time (appear
as high outliers in the boxplot of stride time in Figure
5) correspond to the noisy HSs. From each of these
high outliers, the HS event before and after the missed
HS event can be identified by referring to the vector
of good HSs obtained in Section 3.3.1. A temporal
boundary can be set to search for the missed ridges of
the noisy HSs in the CCM matrix:
bound
low
= HS
bef ore
+ Q1
bound
high
= HS
after
+ Q3 (4)
where HS
bef ore
and HS
after
are the HS events before
and after the missed HS and Q1 and Q3 are the 1st
and 3rd quartiles of stride time. The mean of the local
maxima points making each of these missed ridges in
the CCM matrix gives the location of the noisy HS
events which are appended to the vector of HSs. The
stride time is recomputed at the end of this step.
IdentificationofGaitEventsusingExpertKnowledgeandContinuousWaveletTransformAnalysis
201
0 100 200 300
1
2
3
4
5
6
Examples of noisy HS regions
Amplitude
Time (in samples)
0 100 200 300
1
2
3
4
5
Amplitude
Time (in samples)
50
100
150
200
250
300
1
Stride time (in samples) after
detecting the good HSs
Figure 5: Examples of noisy HS regions (circled in red) that
can be statistically detected from stride time.
3.3.3 Removing the Noisy TO Events
As explained in Section 3.3.1, the noisy TOs are the
ones which have been misidentified as HS and can be
automatically detected and removed in a similar sta-
tistical fashion as above using EK
3
and stride time.
Figure 6 shows the boxplot of stride time. The noisy
TOs lie in the cluster of outliers below the lower
whisker of stride time. These outliers correspond to
stride time values below (Q1−1.5∗IQR) where Q1
is the first quartile and IQR is the interquartile range
of stride time. A noisy TO always give rise to a con-
secutive outlier pair among these low outliers. Such a
pair consists of one outlier which corresponds to the
distance between the previous HS and the noisy TO
and the other outlier which corresponds to the dis-
tance between this same noisy TO and the next HS.
This pair of outliers would be indexed consecutively
in the vector of HSs because they occur one after the
other as shown in Figure 6. Thus by identifying such
outlier pairs, the noisy TOs that have been misidenti-
fied as HSs are removed from the vector of detected
HSs.
3.3.4 Final HS and TO Events
At the end of executing the previous three steps, the
conclusive HS events are obtained in the given accel-
eration signal. The TOs are detected by looking for
0 100 200
0
1
2
3
4
5
Example of noisy TO region
Time (in samples)
Amplitude
60
90
120
150
1
Stride time (in samples) after
locating the noisy HSs
Figure 6: Example of noisy TO region (circled in red) that
creates an outlier pair in the boxplot of stride time.
the ridges between two HSs in the CCM matrix that
are created by matching of the wavelet with TO re-
gions (Figure 2) .
4 RESULTS
Section 3 presents a four step procedure to systemati-
cally identify the gait events of HS and TO:
1. Detect the good HS events: Identifies the HS from
the ridges in the ICM matrix that correspond to
the consistent and regularly shaped HS regions.
Stride time is computed at the end of this step.
2. Locate the noisy HS events: Detects the missed
HS events in step 1 (that correspond to the irreg-
ularly shaped noisy HS regions) by searching for
the missed ridges in CCM matrix within the de-
fined temporal bounds.
3. Remove TO incorrectly identified as HS: Detects
and removes the irregularly shaped TO regions
misidentified as HS in step 1, by identifying lower
outlier pairs in stride time values that are consec-
utively indexed in the vector of HSs.
4. Final HS and TO events: Conclusive HS and TO
events in the given acceleration signal.
Figure 4 corresponds to step 1 while Figure 7
shows the stride time at the execution of steps 2, 3 and
4; by applying the proposed method on a subject’s ac-
celerometer signal from outdoor walking. The noisy
HSs and TOs are seen as long spikes which subse-
quently get removed after the execution of each step.
The developed algorithm was first applied on an
indoor walking dataset consisting of 6 subjects. Since
these signals had high SNR, steps 1 and 4 were suf-
ficient to detect the HS and TO of all subjects. Table
1 shows the mean absolute error and standard devia-
tion in detecting HS and TO using the proposed al-
gorithm in comparison with the results of symbolic
approach and peak detection reported in (Sant’Anna
0 700 1400
1
2
Step 2: Locate the noisy HS events
0 700 1400
1
2
Stride time (seconds)
Step 3: Remove TO incorrectly identied as HS
0 700 1400
1
2
No. of steps taken (while walking)
Step 4: Final HS and TO events
0.5
1
1.5
2
2 3 4
Stride time (sec.) at each step
Figure 7: Stride time (seconds) at steps 2, 3 and 4 while
processing an outdoor walking acceleration signal.
BIOSIGNALS2014-InternationalConferenceonBio-inspiredSystemsandSignalProcessing
202
and Wickstr¨om, 2010), that were applied to the same
dataset. The errors were calculated by comparing the
detected gait events with the ground truth. In the pro-
posed method there was a constant bias of 5 samples
between the identified TO in the signal and the ground
truth given by the pressure mat. This could be due
to the fact that the pressure mat registers a TO when
the toe leaves the mat to enter the swing phase while
the proposed algorithm detects the TO when the toe
presses against the ground just before the lift, during
which there is highest resultant acceleration in the TO
region. This constant bias has been removed while
computing the mean absolute error and standard de-
viation of TO presented in Table 1.
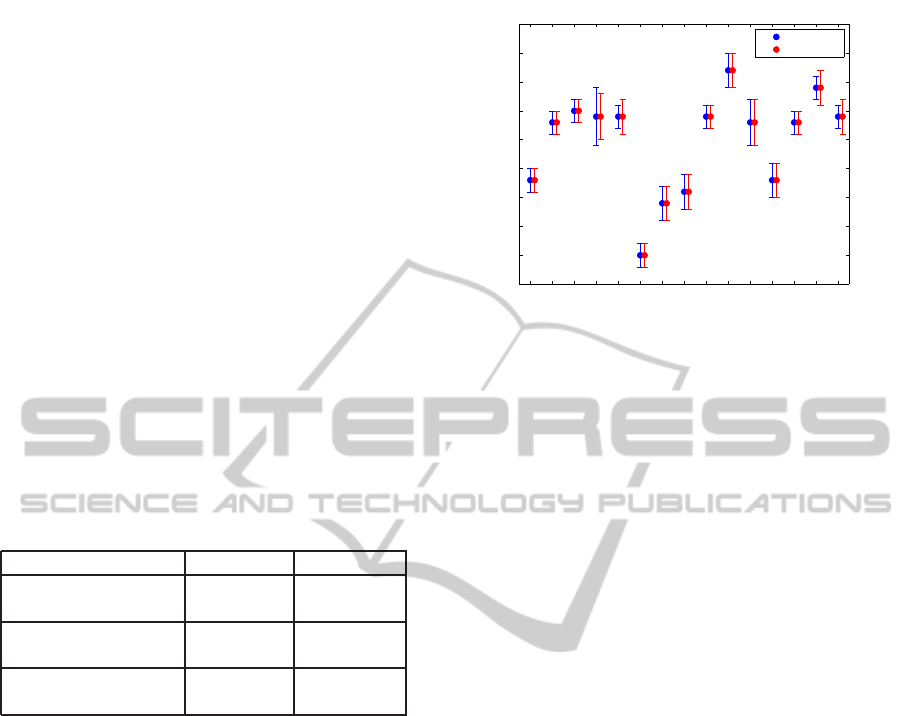
The developed algorithm was then applied to the
outdoor walking data consisting of 15 subjects. Since
these signals had poor SNR, all steps were required to
detect the gait events. Figure 8 shows the mean and
standard deviation of stride time computed for the left
and right leg of each subject for outdoor walking.
Table 1: Mean absolute error (MAE) and standard deviation
(SD) in seconds for different methods applied on the indoor
walking dataset of six subjects.
Method Gait Event MAE (SD)
Proposed Method
HS 0.03 (0.01)
TO 0.01 (0.01)
Symbolic Approach
HS 0.05 (0.04)
TO 0.03 (0.04)
Peak Detection
HS 0.07 (0.10)
TO 0.03 (0.03)
5 CONCLUSIONS & DISCUSSION
Most previous methods on gait event detection have
been developed for data collected indoors during con-
trolled lab experiments that provide gait events for
only a couple of steps. This paper presents a novel
algorithm which combines known gait characteris-
tics with wavelet analysis to robustly identify the gait
events, HS and TO, from accelerometer signals col-
lected in indoor as well as outdoor walking. The de-
veloped method uses resultant accelerometer signal
which eliminates the need to know the specific ori-
entation or alignment of the sensor. For indoor walk-
ing, the proposed algorithm detects gait events with
higher accuracy (Table 1) in comparison to the results
of symbolic approach and peak detection method re-
ported in (Sant’Anna and Wickstr¨om, 2010). Steps 1
and 4 were sufficient to identify the gait events of all
subjects indicating that the data has high SNR.
Analyzing the noisy HSs and TOs in the accel-
eration signals of the outdoor data (examples shown
1 2 3 4 5 6 7 8 9 10 11 12 13 14 15
0.8
0.85
0.9
0.95
1
1.05
1.1
1.15
1.2
1.25
Subject No.
Mean stride time (seconds)
Mean stride time (sec.) and standard deviation for Outdoor Walking
Left Foot
Right Foot
Figure 8: Mean stride time (sec.) and standard deviation for
left and right foot of all 15 subjects for outdoor walking.
in Figure 5 and 6) reveals that it has a much lower
SNR in comparison to the indoor data. The extra steps
needed to detect gait events from outdoor data indi-
cate the uncertainty in applying existing algorithms
developed by using indoor data with high SNR. Due
to lack of foot switches during outdoor walking ex-
periments, the detected gait events could not be com-
pared to ground truth. However, for a healthy subject
walking at their preferred walking speed, the stride
time of both feet should be similar with analogous
mean stride time as presented in Figure 8; thus sub-
stantiating the robustness of the proposed algorithm.
This makes it useful for long-term and continuous
gait monitoring applications. Using foot switches as
ground truth and performing the analysis in real-time
are considered for future work.
The use of gait expert knowledge in the algorithm
allows a robust analysis. Depending on the quality of
the acquired signal and the desired application, it al-
lows the user to decide to either skip or execute steps
2 and 3 (Section 4). This encourages the future pos-
sibility to adapt the proposed methodology to other
types of data and complex gait. Additionally, each of
the four steps of the proposed algorithm provide an
insight into the quality of the collected accelerome-
ter signal which can be further analyzed to define a
‘data quality index’. This could prove useful to clin-
icians and researchers to determine the utility of the
collected data and run diagnostics accordingly.
REFERENCES
Addison, P. S. (2005). Wavelet transforms and the ECG:
A review. Physiological Measurement, 26(5):R155–
R199.
Aminian, K. et al. (2002). Spatio-temporal parameters of
gait measured by an ambulatory system using minia-
IdentificationofGaitEventsusingExpertKnowledgeandContinuousWaveletTransformAnalysis
203

ture gyroscopes. Journal of Biomechanics, 35(5):689–
699.
Aminian, K. et al. (2004). Evaluation of an ambulatory sys-
tem for gait analysis in hip osteoarthritis and after total
hip replacement. Gait & Posture, 20(1):102–107.
Aung, M. et al. (2013). Automated detection of instanta-
neous gait events using time frequency analysis and
manifold embedding. IEEE Transactions on Neural
Systems and Rehabilitation Engineering.
Callisaya, M. L. et al. (2010). Ageing and gait variability
a population-based study of older people. Age and
Ageing, 39(2):191–197.
Desailly, E. et al. (2009). Foot contact event detection using
kinematic data in cerebral palsy children and normal
adults gait. Gait & Posture, 29(1):76 – 80.
Du, P. et al. (2006). Improved peak detection in mass spec-
trum by incorporating continuous wavelet transform-
based pattern matching. Bioinformatics, 22(17):2059–
2065.
Forsman, P. et al. (2009). Wavelet analysis to detect gait
events. In EMBC, pages 424–427.
Gouwanda, D. and Senanayake, S. (2009). Applica-
tion of hybrid multi-resolution wavelet decomposition
method in detecting human walking gait events. In
SOCPAR, pages 580–585.
Hafner, V. and Bachmann, F. (2008). Human-humanoid
walking gait recognition. In Humanoids 2008, pages
598–602.
Hanlon, M. and Anderson, R. (2009). Real-time gait event
detection using wearable sensors. Gait & Posture,
30(4):523–527.
Hausdorff, J. M. (2007). Gait dynamics, fractals and
falls: Finding meaning in the stride-to-stride fluctu-
ations of human walking. Human Movement Science,
26(4):555–589.
Herman, T. et al. (2005). Gait instability and fractal dy-
namics of older adults with a cautious gait: why do
certain older adults walk fearfully? Gait & Posture,
21(2):178–185.
Kavanagh, J. J. and Menz, H. B. (2008). Accelerometry: A
technique for quantifying movement patterns during
walking. Gait & Posture, 28(1):1–15.
Khandelwal, S. and Chevallereau, C. (2013). Estimation
of the trunk attitude of a humanoid by data fusion of
inertial sensors and joint encoders. In CLAWAR, pages
822–830.
Lau, H. and Tong, K. (2008). The reliability of using ac-
celerometer and gyroscope for gait event identifica-
tion on persons with dropped foot. Gait & Posture,
27(2):248–257.
Lee, J. and Park, E. (2011). Quasi real-time gait event detec-
tion using shank-attached gyroscopes. Medical & Bi-
ological Engineering & Computing, 49(6):707–712.
Mallat, S. (1999). A wavelet tour of signal processing. Aca-
demic Press.
Mansfield, A. and Lyons, G. M. (2003). The use of ac-
celerometry to detect heel contact events for use as a
sensor in FES assisted walking. Medical Engineering
& Physics, 25(10):879–885.
McDonough, A. L. et al. (2001). The validity and reliability
of the GAITRite system’s measurements: A prelimi-
nary evaluation. Archives of Physical Medicine and
Rehabilitation, 82(3):419–425.
Miller, A. (2009). Gait event detection using a multilayer
neural network. Gait & Posture, 29(4):542–545.
Mills, P. M. et al. (2007). Agreement between footswitch
and ground reaction force techniques for identifying
gait events: Inter-session repeatability and the effect
of walking speed. Gait & Posture, 26(2):323–326.
Pappas, I. et al. (2001). A reliable gait phase detection sys-
tem. IEEE Transactions on Neural Systems and Reha-
bilitation Engineering, 9(2):113–125.
Rafiee, J. et al. (2011). Wavelet basis functions in biomed-
ical signal processing. Expert Systems with Applica-
tions, 38(5):6190–6201.
Reelick, M. F. et al. (2009). The influence of fear of falling
on gait and balance in older people. Age and Ageing,
38(4):435–440.
Rueterbories, J. et al. (2010). Methods for gait event de-
tection and analysis in ambulatory systems. Medical
Engineering & Physics, 32(6):545–552.
Sant’Anna, A. and Wickstr¨om, N. (2010). A symbol-based
approach to gait analysis from acceleration signals:
Identification and detection of gait events and a new
measure of gait symmetry. IEEE Transactions on
Information Technology in Biomedicine, 14(5):1180–
1187.
Selles, R. et al. (2005). Automated estimation of initial
and terminal contact timing using accelerometers; de-
velopment and validation in transtibial amputees and
controls. IEEE Transactions on Neural Systems and
Rehabilitation Engineering, 13(1):81–88.
Socie, M. J. et al. (2013). Gait variability and disability in
multiple sclerosis. Gait & Posture, 38(1):51–55.
Stolze, H. et al. (2004). Falls in frequent neurological dis-
eases. Journal of Neurology, 251(1):79–84.
Tan, C. W. and Park, S. (2005). Design of accelerometer-
based inertial navigation systems. IEEE Transactions
on Instrumentation and Measurement, 54(6):2520–
2530.
Torrealba, R. et al. (2010). Statistics-based technique for
automated detection of gait events from accelerometer
signals. Electronics Letters, 46(22):1483–1485.
Williamson, R. and Andrews, B. (2000). Gait event detec-
tion for FES using accelerometers and supervised ma-
chine learning. IEEE Transactions on Rehabilitation
Engineering, 8(3):312–319.
Woodman, O. J. (2007). An introduction to inertial naviga-
tion. Technical report, Univ. of Cambridge.
Yang, C. et al. (2009). Comparison of public peak detection
algorithms for MALDI mass spectrometry data analy-
sis. BMC Bioinformatics, 10(1):4.
BIOSIGNALS2014-InternationalConferenceonBio-inspiredSystemsandSignalProcessing
204
