
A Computational Study to Identify TP53 and SREBF2 as Regulation
Mediators of miR-214 in Melanoma Progression
Gianfranco Politano
1
, Alfredo Benso
1,4
, Stefano Di Carlo
1
, Francesca Orso
2,3
,
Alessandro Savino
1,4
and Daniela Taverna
2,3
1
Politecnico di Torino, Torino, Italy
2
Molecular Biotechnology Center (MBC), Torino, Italy
3
Center for Molecular Systems Biology - Universit`a di Torino, Torino, Italy
4
Consorzio Interuniversitario Nazionale per l’Informatica, Verres (AO), Italy
Keywords:
microRNA, miR-214, Melanomas, Biological Pathways, Gene Regulation, Post-transcriptional Regulation.
Abstract:
In the complex world of post-transcriptional regulation, miR-214 is known to control in vitro tumor cell move-
ment and survival to anoikis, as well as in vivo malignant cell extravasation from blood vessels and lung
metastasis formation. miR-214 has also been found to be highly expressed in human melanomas, and to
directly and indirectly regulate several genes involved in tumor progression and in the establishment of dis-
tant metastases (Penna et al., 2011). In this work, we exploit a computational pipeline integrating data from
multiple online data repositories to identify the presence of transcriptional or post-transcriptional regulatory
modules involving miR-214 and a set of 73 previously identified miR-214 regulated genes. We identified 27
putative regulatory modules involving miR-214, NFKB1, SREBPF2, miR-33a and 9 out of the 73 miR-214
modulated genes (ALCAM, POSTN, TFAP2A, ADAM9, NCAM1, SEMA3A, PVRL2, JAG1, EGFR1). As a pre-
liminary experimental validation we focused on 9 out of the 27 identified regulatory modules that involve two
main players, miR-33a and SREBF2. The results confirm the importance of the predictions obtained with the
presented computational approach.
1 INTRODUCTION
Aberrant expression of coding and non-coding genes,
such as microRNAs (miRNAs), occurs in melanomas,
one of the most aggressive human tumors. miRNAs
are 20 to 24 nucleotides long non-coding RNAs in-
volved in the post-transcriptional down-regulation of
protein-coding genes through imperfect base pairing
with their target mRNAs. miRNAs have been impli-
cated as possible key factors in several diseases be-
cause of their capability to affect the simultaneous
expression of multiple genes involved in the cell bi-
ology (Beezhold et al., 2010; Tu et al., 2009; Benso
et al., 2013; Di Carlo et al., 2013; Yuan et al., 2009).
Referring to melanomas, miRNAs such as let-7a/b,
miR-23a/b, miR-148, miR-155, miR-182, miR-200c,
miR-211, miR214 and miR-221/222 have been found
to be differentially expressed in benign melanocytes
versus melanoma cell lines or in benign melanocytic
lesions versus melanomas in human samples. Tar-
gets of some of the above listed miRNAs are well-
known melanoma-associated genes like the oncogene
NRAS, the microphthalmia-associated transcription
factor (MITF), the receptor tyrosine kinase c-KIT, or
the AP-2 transcription factor (TFAP2). We previously
showed that miR-214, the product of an intron of the
Dynamin-3 gene on human chromosome 1, coordi-
nates melanoma metastasis formation by modulating
the expression of over 70 different genes, including 2
activating protein transcription factors (TFAP2A and
TFAP2C) and the adhesion molecule ALCAM (Penna
et al., 2011; Penna et al., 2013). In fact, alterations
in the expression level of some of these genes leads
to downstream effects on a number of key processes
such as apoptosis, proliferation migration and inva-
sion. In order to elucidate the regulatory networks
mediated by miR-214 we designed a computational
pipeline able to search for different classes of regu-
latory modules between miR-214 and the set of 73
modulated proteins. In this analysis we focused on
the interplay between transcription factors (TFs) and
microRNAs (miRNAs) since several studies as (Zhao
49
Politano G., Benso A., Di Carlo S., Orso F., Savino A. and Taverna D..
A Computational Study to Identify TP53 and SREBF2 as Regulation Mediators of miR-214 in Melanoma Progression.
DOI: 10.5220/0004799500490056
In Proceedings of the International Conference on Bioinformatics Models, Methods and Algorithms (BIOINFORMATICS-2014), pages 49-56
ISBN: 978-989-758-012-3
Copyright
c
2014 SCITEPRESS (Science and Technology Publications, Lda.)

et al., 2013) suggested its critical role in cellular reg-
ulation during tumorigenesis. Three different classes
of regulatory modules (see Figure 1) have been ana-
lyzed:
1. Type-0 (direct interactions), where miR-214 di-
rectly down-regulates one of the target proteins;
2. Type-1 (one-level indirect interactions), where
miR-214 down-regulates a Transcription Factor
which eventually regulates one of the targets;
3. Type-2 (two-level indirect interactions), where
miR-214 targets a Transcription Factor regulating
a gene which hosts another miRNA that down-
regulates one of the target proteins.
Although Type-0 and Type-1 interactions may be
quite straightforward to detect, Type-2 interactions
are not immediately evident and require a more com-
plex data integration process. Other types of inter-
actions may be similarly interesting (e.g. three-level
interactions like: miR-214 → TF1 → TF2 → Target
Protein) but have not been considered, at this stage,
because they are a lot more difficult to experimentally
validate. The search process for the three classes of
interactions was completely automated and based on
the integration of heterogeneous data extracted from
different public available repositories. The pipeline
highlighted no interactions of Type-0 and Type-1, and
27 possible Type-2 interactions. An experimental val-
idation of a subset of the identified interactions is
shown in the Results section.
2 METHODS
2.1 Computational Analysis
Searching for the three classes of interactions involv-
ing miR-214 presented in Figure 1 requires the inte-
gration of heterogeneous data sources. This section
introduces the selected public repositories used to re-
trieve the required information as well as the compu-
tational flow followed to integrate these sources and
to search for the chosen regulatory modules.
2.1.1 Data Sources
The following public repositories represent the main
sources of information in our computational process:
• microRNA.org database (Betel et al., 2008) is
used to search for miRNA target genes. Mi-
croRNA.org uses the miRanda algorithm (John
et al., 2004) for target predictions. The algorithm
computes optimal sequence complementarity be-
tween a miRNA and an mRNA using a weighted
dynamic programming algorithm. The overall
database consists of 16,228,619predicted miRNA
target sites in 34,911 distinct 3’UTR from iso-
forms of 19,898 human genes. Predictions are
associated to a mirSVR score, a machine learn-
ing method for ranking miRNA target sites by a
down-regulation score (Betel et al., 2010). The
mirSVR score is a real number that indicates the
prediction confidence (lower negative scores cor-
respond to better predictions). Data from mi-
croRNA.org are available for download in 4 dif-
ferent zipped packages: (1) Good mirSVR score,
Conserved miRNA, (2) Good mirSVR score,
Non-conserved miRNA, (3) Non-good mirSVR
score, Conserved miRNA, (4) Non-good mirSVR
score, Non-conserved miRNA. They are differen-
tiated in terms of mirSVR score (high or low) and
conservation (highly, low conserved). The four
archives have been unified in a single database,
keeping the information of the source archive in a
specific field as well as the related mirSVR score,
in order to be able to filter the retrieved targets and
to work with the most reliable predictions.
It is necessary to point out that the identification
of any regulatory module involving miRNA tar-
gets is always affected by the type-I and type-II
errors embedded in the miRNA target prediction
algorithms, and therefore an experimental valida-
tion, at least of the most promising results, is un-
avoidable.
• Transcription Factor Encyclopedia (Wasser-
man Lab, 2012) and Targetmine (The Mizuguchi
Laboratory, 2013; Chen et al., 2011) have been
used to identify genes Transcription Factors (TF).
TFE provides details of transcription factor bind-
ing sites in close collaboration with Pazar, a pub-
lic database of transcription factors and regula-
tory sequence information. Targetmine contains
only Upstream Transcription Factors. For each
gene, the database retrieves all upstream regula-
tory genes from the AMADEUS and ORegAnno
compiled TF-Target gene sets. Amadeus (Lin-
hart et al., 2013; Linhart et al., 2008) contains
TF and miRNA target sets in human, mouse, D.
Melanogaster, and C. Elegans, collected from the
literature. For each TF it is reported its set of tar-
gets, given as a list of Ensembl gene ids.
• Eutils programming utilities (NCBI, 2013) and
Mirbase.org (mirbase.org, 2013; Griffiths-Jones
et al., 2006) are used for retrieving coordinates
of precursor miRNAs and genes. miRBase is
a searchable database of published miRNA se-
quences and annotations. About 94.5% of the
available mature miRNA sequences considered in
BIOINFORMATICS2014-InternationalConferenceonBioinformaticsModels,MethodsandAlgorithms
50

DNM3
miR-214
TF
Target
Protein
DNM3
miR-214
Target
Protein
TFDNM3
miR-214
miRNA
host
Gene
miRNA
Target
Protein
Type-0
Type-1
Type-2
Figure 1: Three classes of regulatory modules involving miR-214 have been investigated in this paper: Type-0 - direct inter-
actions, Type-1 - one-level indirect interactions, and Type-2 - two-level indirect interactions).
this database have experimental evidence, thus
representing a reliable source of information.
Each miRNA entry in miRBase is correlated with
the related information on the location that is ex-
ploited to identify the host genes.
2.1.2 Computational Flow
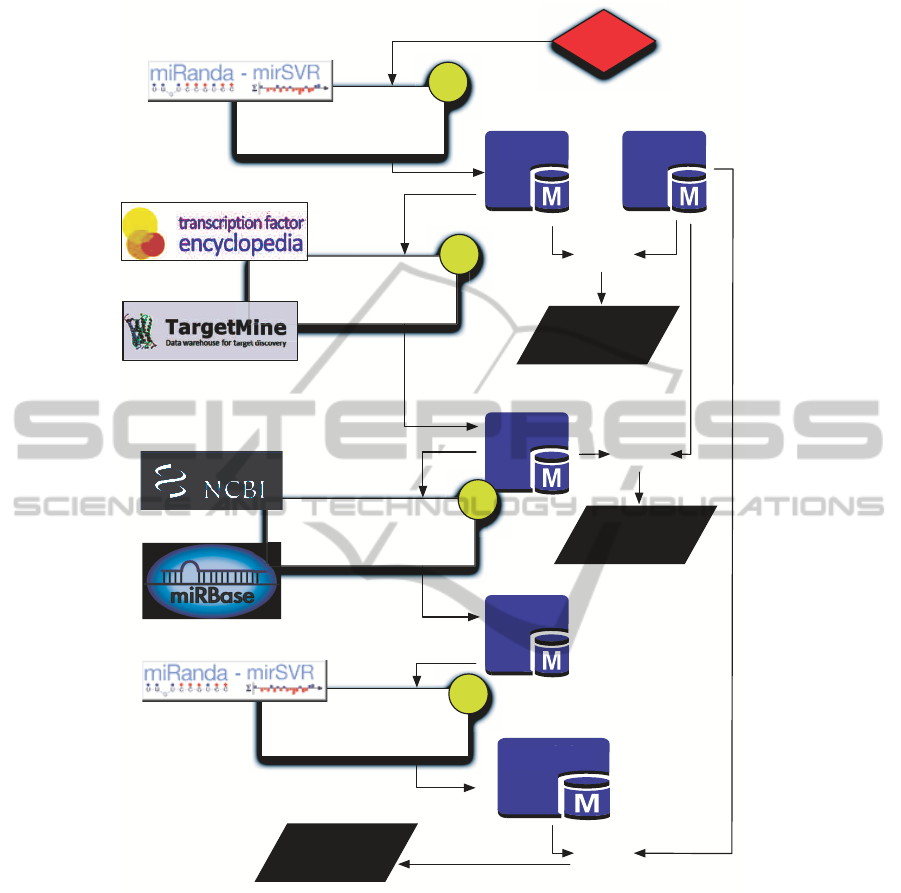
Figure 2 highlights the computational flow imple-
mented to search for miR-214 mediated interactions.
The full pipeline has been developed in PHP language
and coupled with a MySQL database, which mirrors
an optimized subset of data coming from multiple on-
line repositories. As previouslydiscussed, we focused
our analysis on the set of 73 protein-coding genes re-
ported in Table 1. These proteins, denoted as Target
Proteins in Figure 2, have been found to be modulated
in a direct or indirect manner by miR-214 in previ-
ous microarray experimentspresented in (Penna et al.,
2011).
The computational flow is organized into four
main data integrations steps that, starting from miR-
214, search for Type-0, Type-1 and Type-2 interac-
tions.
Step 1 - Detection of Type-0 Interactions. Type-0
interactions require searching for target genes that are
directly regulated by miR-214.
We queried microRNA.org database to search for
miR-214 direct targets. Due to the computational ap-
proach used by microRNA.org to predict miRNA tar-
gets, false positives are in general present in the query
results. To limit these errors we restricted the query to
the ”Good mirSVR score, Conserved miRNA” and to
the ”Good mirSVR score, Non-conserved miRNA”,
which represent the most reliable subsets of computed
targets. Moreover, miRNA targets have been further
Table 1: List of 73 miR-214 modulated genes. In green
and bold the set of proteins that result linked to miR-214
in the discovered regulatory modules. The sign indicates if
the gene was up regulated (+) or down regulated (-) in the
microarray experiments; in red, proteins that do not show
any connection
+ADAM9
-JAM3
+THY1
CD44
ENG
+ALCAM
-LRP6
+TIMP3
CD9
EPCAM
-BMPR1B
+MET
ADAM15
CDH1
ERBB2
-CD40
+MMP2
ADAM8
CDH11
ERBB3
+CD99
+NCAM1
APP
CDH2
EREG
+CEACAM1
-POSTN
ARHGAP12
CDH4
F2
-CEACAM5
+PVRL2
BCAM
CDHR5
FCER2
-EGFR
-SEMA3A
BSG
CLU
FLT1
+HBEGF
-TFAP2A
CD36
CTSD
HRG
-JAG1
-TFAP2C
CD40LG
CX3CL1
ICAM2
IL1R2
LCN2
TIMP1
IL8
LGALS3BP
TIMP2
ITGA3
MITF
VCAM1
ITGA6
PAK2
ITGAV
PODXL
ITGB1
PODXL2
ITGB3
PTEN
JAM1
PVR
JAM2
SELE
KDR
TGFBI
filtered according to their mirSVR score. Such score
is considered meaningful with a cut-off of at most
-0.1, based on the empirical distribution of the ex-
tent of target down-regulation (measured as log-fold
change) that is expected given a mirSVR score (Be-
tel et al., 2010). For scores closer to zero the proba-
bility of meaningful down-regulation drops while the
number of predictions sharply rises (MicroRNA.org,
2013). In order to work with high reliable predictions
we selected only those targets with mirSVR < -0.3.
Then, in order to identify Type-0 interactions, the
full list of obtained miR-214 targets have been inter-
sected with the set of 73 Target Proteins.
Step 2 - Detection of Type-1 Interactions. Start-
ing from the full list of miR-214 targets computed
during Step 1, the identification of Type-1 interac-
tions requires filtering out those targets that have not
AComputationalStudytoIdentifyTP53andSREBF2asRegulationMediatorsofmiR-214inMelanomaProgression
51
miR-214
Search for miRNA target
genes
miR-214
Targets
Target
Proteins
∩
Type-0
interactions
Identify TF and related
targets among miR-214
targets
TF Targets
∩
Type-1
interactions
Search for miRNA hosted by
TF Targets
Intragenic
miRNA
Search for targets of the
Hosted miRNA
microRNA.org
microRNA.org
Intragenic
miRNA Targets
∩
Type-2
interactions
1
2
3
4
Figure 2: The pipeline four steps to investigate the presence of transcriptional or post-transcriptional regulatory pathways.
been identified as Transcription Factors (TF) for other
genes.
Each miR-214 Target is searched both in Tran-
scription Factor Encyclopedia and in TargetMine to
check whether it represents a TF. For each identified
TF the related target gene is then extracted. This step
allows us to build a list of TF Targets that can be in-
tersected with the list of 73 Target proteins to identify
Type-1 interactions.
Steps 3 and 4 - Detection of Type-2 Interactions.
The last two steps of the proposed computational flow
are used to identify Type-2 interactions that represent
the most complex considered mechanism.
For each TF Target identified during Step 2 we
searched for its candidate intragenic miRNAs (Step
3). Intragenic miRNAs represent around 50% of
the mammalian miRNAs. Most of these intragenic
miRNAs are located within introns of protein coding
genes (miRNA host genes) and are referred to as in-
tronic miRNAs, whereas the remaining miRNAs are
overlapping with exons of their host genes and are
thus called exonic miRNAs. Moreover the majority
of intragenic miRNAs are sense strand located, while
only a very small portion is anti-sense strand located.
Our analysis considers intronic and exonic miRNAs
both sense and anti-sense strand located. Intragenic
BIOINFORMATICS2014-InternationalConferenceonBioinformaticsModels,MethodsandAlgorithms
52

miRNAs are retrieved from the miRBase database. To
identify intragenic miRNAs of a given host gene we
first searched for the genomic coordinates of the gene
using e-Utils; with the gene coordinates we searched
in the miRBase database for all miRNAs with coordi-
nates embraced in the ones of the gene.
Similarly to Step 1, for each detected Intragenic
miRNA we then searched microRNA.org for the re-
lated Intragenic miRNA Targets (Step 4), and finally
we filtered out those targets that do not correspond
to any of the 73 target proteins. Each resulting tar-
get protein then corresponds to a Type-2 interaction.
It is important to point out here that the computa-
tional analysis cannot predict the sign of the result-
ing differential expression (up or down regulation).
In fact, following the Type-2 regulatory chain, if miR-
214 is silenced the expression of the target protein is
very likely inhibited. If, instead, miR-214 is over ex-
pressed, the regulatory module ”removes” the inhibi-
tion and allows the target gene expression to possibly
change. The only realistic way to experimentally ver-
ify the presence of the Type-2 regulatory module is to
correlate the over expression of miR-214 with the un-
der expression of the cascade TF → gene → miRNA
that follows miR-214 (see Figure 1). This is obviously
true unless the transcription factor acts as a repressor
of its own target, which is statistically unlikely to hap-
pen. As for now, since public repositories do not pro-
vide this information we can only assume the TF to
be an enhancer of its target.
2.2 Biological Methods
Computational predictions have been validated
against the following biological setup.
2.2.1 Cell Culture
MA-2 cells were provided by R.O. Hynes (Xu et al.,
2008) and maintained as described in (Penna et al.,
2011).
2.2.2 Transient Transfections of Pre-miRs
To obtain transient miR-214 over expression, cells
were plated in 6-well plates at 30-50% confluency
and transfected 24h later using RNAiFect (QIAGEN,
Stanford, CA) reagent, according to manufacturers
instructions, with 75 nM Pre-miR
TM
miRNA Precur-
sor Molecules-Negative Control (a non-specific se-
quence) or Pre-miR-214.
2.2.3 RNA Isolation and qRT-PCR for miRNA
or mRNA Detection
Total RNA was isolated from cells using TRIzol
R
Reagent (Invitrogen Life Technologies, Carlsbad,
CA). qRT-PCRs for miR detection were performed
with TaqMan
R
MicroRNA Assays hsa-miR-33a as-
say ID 002306, U6 snRNA assay ID001973 (all from
Applied Biosystems, Foster City, CA) on 10 ng to-
tal RNA according to the manufacturer’s instruc-
tions. For mRNA detection, 1 ug of DNAse-
treated RNA (DNA-free
TM
kit, Ambion, Austin, TX)
was retrotranscribed with RETROscript
TM
reagents
(Ambion, Austin, TX) and qRT-PCRs were car-
ried out using SREBPF2 gene-specific primers
(FW:gccctggaagtgacagagag, RV: tgctttcccagggagtga)
and the Probe #21 of the Universal Probe Library
(Roche, Mannheim, GmbH) using a 7900HT Fast
Real Time PCR System. Quantitative normalization
was performed on the expression of the U6 small nu-
cleolar RNA or of 18S, for miR or mRNA detection,
respectively. The relative expression levels between
samples were calculated using the comparative delta
CT (threshold cycle number) method (2-DDCT) with
a control sample as the reference point (Bookout and
Mangelsdorf, 2003).
3 RESULTS AND DISCUSSION
The computational pipeline presented in Section 2.1
leaded to the identification of zero Type-0, zero Type-
1, and 27 Type-2 interactions. The fact that no
Type-0 and Type-1 interactions were found does not
mean that they do not exist, but that in the available
databases there is no evidence of their presence.
The 27 Type-2 interactions target 22 out of the
73 considered miR-214 potential interacting proteins,
which have been marked in green in Table 1. The full
list of the 27 identified regulatory modules is shown
in Table 2.
From our predictions, miR-214 influences two
transcription factors: NFKB1 and TP53 (average
mirSVR = -0.4). Seven of the genes regulated by
these two TFs were identified as host genes for miR-
NAs targeting at least one of the 73 miR-214 modu-
lated proteins: APOLD1, BBC3, C11orf10, GDF15,
NFATC2, SREBF2, and SVIL. The hosted miRNAs
are: hsa-mir-33a, hsa-mir-604, hsa-mir-611, hsa-mir-
613, hsa-mir-3189, hsa-mir-3191, and hsa-mir-3194.
The average mirSVR score is significantly low (aver-
age mirSVR < -0.71). The high significance of the
mirSVR scores, resulting from interactions between
the intragenic miRNAs and their target proteins, is
AComputationalStudytoIdentifyTP53andSREBF2asRegulationMediatorsofmiR-214inMelanomaProgression
53

Table 2: The 27 Type-2 regulatory modules related to miR-214 as obtained by the pipeline after data scraping. The set of final
targets (surface protein in the table) is limited to the 73 genes listed in Table 1. The first 9 modules have been experimentally
validated.
miR_214
mirSVR
TF
miRNA_Host
Intragenic_miRNA
Surface Protein
mirSVR
miR-214
-0.4056
NFKB1
SREBF2
hsa-mir-33a
ALCAM
-0.504
miR-214
-0.4056
NFKB1
SREBF2
hsa-mir-33a
POSTN
-0.9944
miR-214
-0.4056
NFKB1
SREBF2
hsa-mir-33a
TFAP2A
-1.3043
miR-214
-0.4056
NFKB1
SREBF2
hsa-mir-33a
ADAM9
-0.8819
miR-214
-0.4056
NFKB1
SREBF2
hsa-mir-33a
NCAM1
-1.1293
miR-214
-0.4056
NFKB1
SREBF2
hsa-mir-33a
SEMA3A
-1.0884
miR-214
-0.4056
NFKB1
SREBF2
hsa-mir-33a
PVRL2
-0.3633
miR-214
-0.4056
NFKB1
SREBF2
hsa-mir-33a
JAG1
-0.7951
miR-214
-0.4056
NFKB1
SREBF2
hsa-mir-33a
EGFR
-0.5771
miR-214
-0.4056
NFKB1
SVIL
hsa-mir-604
MMP2
-0.5526
miR-214
-0.4056
NFKB1
SVIL
hsa-mir-604
CEACAM5
-0.6373
miR-214
-0.4056
NFKB1
C11orf10
hsa-mir-611
THY1
-0.3774
miR-214
-0.4056
NFKB1
C11orf10
hsa-mir-611
NCAM1
-0.4402
miR-214
-0.4056
NFKB1
APOLD1
hsa-mir-613
MET
-0.8579
miR-214
-0.4056
NFKB1
APOLD1
hsa-mir-613
ALCAM
-0.5254
miR-214
-0.4056
NFKB1
APOLD1
hsa-mir-613
TIMP3
-0.582
miR-214
-0.4056
NFKB1
APOLD1
hsa-mir-613
CEACAM1
-0.9242
miR-214
-0.4056
NFKB1
APOLD1
hsa-mir-613
BMPR1B
-0.7156
miR-214
-0.4056
NFKB1
APOLD1
hsa-mir-613
TFAP2C
-0.6921
miR-214
-0.4056
NFKB1
APOLD1
hsa-mir-613
JAG1
-0.4012
miR-214
-0.4056
NFKB1
NFATC2
hsa-mir-3194
CD99
-0.8366
miR-214
-0.4056
NFKB1
NFATC2
hsa-mir-3194
CD40
-0.7136
miR-214
-0.3966
TP53
GDF15
hsa-mir-3189
JAM3
-0.8858
miR-214
-0.3966
TP53
GDF15
hsa-mir-3189
PVRL2
-0.5146
miR-214
-0.3966
TP53
GDF15
hsa-mir-3189
HBEGF
-0.3806
miR-214
-0.3966
TP53
GDF15
hsa-mir-3189
LRP6
-0.6945
miR-214
-0.3966
TP53
BBC3
hsa-mir-3191
HBEGF
-0.8502
particularly evident for TFAP2A, which outperforms
the others with a mirSVR score of -1.3043.
In this work, as a preliminary experimental vali-
dation, we focused our attention on the first 9 identi-
fied regulatory modules involving miR-214, NFKB1,
SREBF2, miR-33a and 9 of the 73 considered pro-
teins (ALCAM, POSTN, TFAP2A, ADAM9, NCAM1,
SEMA3A, PVRL2, JAG1 and EGFR1). We evaluated
miR-33a and SREBPF2 expression levels following
miR-214 over expression in MA-2 melanoma cells
and we observed a decrease in miR-33a and SREBF2
expression as shown in Figure 3.
The observed co-regulation of miR-33a and
SREBPF2 is in agreement with literature data pub-
lished in (Najafi-Shoushtari et al., 2010), thus sup-
porting our computational predictions. The down-
regulation of miR-33a following miR-214 over ex-
pression could contribute to miR-214-mediated cell
invasion, in fact it has been demonstrated that an en-
forced expression of miR-33a inhibits the motility of
lung cancer cells (Rice et al., 2013).
This regulatory module resulted to be very inter-
esting also because SREBPF2 and miR-33a act in
concert to control cholesterol homeostasis (Najafi-
Shoushtari et al., 2010). In fact, SREBPF2 acts by
controlling the expression of many cholesterogenic
and lipogenic genes, such as low-density lipoprotein
Figure 3: miR-33a, and SREBPF2 expression modulations.
(A) miR-33a expression levels tested by qRT-PCR in the
MA-2 melanoma cell line following transfection with miR-
214 precursors or their negative controls (pre-miR-214 or
control). (B) SREBPF2 mRNA expression levels were eval-
uated in MA-2 cells by Real Time PCR analysis 72h fol-
lowing transient transfection with miR-214 precursors or
their negative controls (pre-miR-214 or control). Results
are shown as fold changes (meanSD of triplicates) relative
to controls, normalized on U6 RNA level and 18S, respec-
tively. All experiments performed in our work were tested
for miR-214 modulations; representative results are shown
here.
(LDL) receptor, 3-hydroxy-3-methylglutaryl coen-
zyme A reductase, and fatty acid synthase. Instead,
miR-33a targets the adenosine triphosphate-binding
cassette A1 (ABCA1) cholesterol transporter, a key
mediator of intracellular cholesterol efflux from liver
to apolipoprotein A-I (apoA-I) to obtain high-density
lipoprotein (HDL). Considering that the lipogenic
BIOINFORMATICS2014-InternationalConferenceonBioinformaticsModels,MethodsandAlgorithms
54

pathway is a metabolic hallmark of cancer cells, these
preliminary data suggest a potential role of miR-214
in this aspect of cancer formation and progression.
Our hypothesis is further supported by experimental
results (not shown here), obtained from microarray
analysis in a context of miR-214 over expression.
To look for molecular and cellular functions as-
sociations within the almost 500 differentially ex-
pressed genes detected by microarray analysis com-
paring cells over expressing miR-214 versus con-
trols, we applied an Ingenuity Functional Analy-
sis. The Ingenuity Pathways Knowledge Base (http://
www.ingenuity.com/) is currently the world largest
database of knowledge on biological networks, with
annotations performed by experts. The significance
value obtained with the Functional Analysis for a
dataset is a measure of the likelihood that the associ-
ation between a set of Functional Analysis molecules
in our experiment and a given process or pathway is
due to random chance. The p-value is calculated us-
ing the right-tailed Fisher Exact Test and it consid-
ers both the number of functional analysis molecules
that participate in that function and the total number
of molecules that are known to be associated with
that function in the Ingenuity Knowledge Base. In
our case, the most significant functions associated
to our dataset resulted to be Cellular Assembly and
Organization (7.08E-04 ÷ 3.95E-02, 25 molecules)
and Lipid Metabolism (9.54E-04 ÷ 4.23E-02, 18
molecules).
4 CONCLUSIONS
In this paper we presented the results of a computa-
tional pipeline created for investigating possible reg-
ulatory pathways between miR-214 and a set of 73
proteins previously identified as co-regulated with the
miRNA in melanomas. Thanks to this computational
flow, a set of 27 putativeregulatorypathways has been
identified; a preliminary experimental validation per-
formed on 9 out of the 27 pathways provided interest-
ing insights about the regulatory mechanisms involv-
ing miR-214 in the considered disease. The analy-
sis suggests the involvement of miR-214 in metabolic
pathways that could control metastatization. More-
over, the study highlights the relevance of specific
miR-214 modulated genes, such as ALCAM, HBEGF,
JAG1, NCAM1, and PVRL2, that correspond to sur-
face proteins redundantly regulated by multiple path-
ways. Further laboratory experiments are under way
to complete the validations of the full set of identified
regulatory modules. Nevertheless, the preliminary re-
sults presented in this work already represent a signif-
icant achievement that seems to confirm the quality of
the predictions obtained with the proposed computa-
tional approach.
ACKNOWLEDGEMENTS
This work has been partially supported by grants from
Regione Valle d’Aosta (for the project: ”Open Health
Care Network Analysis” - CUP B15G13000010006),
from the Italian Ministry of Education, University
& Research (MIUR) (for the project MIND - PRIN
2010, and FIRB Giovani RBFR08F2FS-002 FO),
from the Compagnia di San Paolo, Torino (DT), and
from AIRC 2010 (IG 10104 DT).
REFERENCES
Beezhold, K. J., Castranova, V., and Chen, F. (2010). Re-
view microprocessor of microRNAs: regulation and
potential for therapeutic intervention. Molecular Can-
cer, 9(134).
Benso, A., Di Carlo, S., Politano, G., and Savino, A. (2013).
A new mirna motif protects pathways’ expression in
gene regulatory networks. In Proceedings IWBBIO
2013: International Work-Conference on Bioinfor-
matics and Biomedical Engineering, pages 377–384.
Betel, D., Koppal, A., Agius, P., Sander, C., and Leslie, C.
(2010). Comprehensive modeling of microrna targets
predicts functional non-conserved and non-canonical
sites. Genome Biol, 11(8):R90.
Betel, D., Wilson, M., Gabow, A., Marks, D. S., and
Sander, C. (2008). The microRNA.org resource: tar-
gets and expression. Nucleic Acids Res, 36(Database
issue):D149–53.
Bookout, A. L. and Mangelsdorf, D. J. (2003). Quantitative
real-time pcr protocol for analysis of nuclear receptor
signaling pathways. Nuclear receptor signaling, 1.
Chen, Y.-A., Tripathi, L. P., and Mizuguchi, K. (2011). Tar-
getmine, an integrated data warehouse for candidate
gene prioritisation and target discovery. PLoS ONE,
6(3):e17844.
Di Carlo, S., Politano, G., Savino, A., and Benso, A. (2013).
A systematic analysis of a mi-RNA inter-pathway
regulatory motif. Journal of clinical bioinformatics,
3(20).
Griffiths-Jones, S., Grocock, R. J., Van Dongen, S., Bate-
man, A., and Enright, A. J. (2006). miRBase: mi-
croRNA sequences, targets and gene nomenclature.
Nucleic acids research, 34(suppl 1):D140–D144.
John, B., Enright, A., Aravin, A., Tuschl, T., Sander, C., and
Marks, D. (2004). Human microRNA targets. PLoS
biology, 2(11):e363.
Linhart, C., Halperin, Y., and Shamir, R. (2008). Transcrip-
tion factor and microrna motif discovery: the amadeus
platform and a compendium of metazoan target sets.
Genome research, 18(7):1180–1189.
AComputationalStudytoIdentifyTP53andSREBF2asRegulationMediatorsofmiR-214inMelanomaProgression
55

Linhart, C., Halperin, Y., and Shamir, R. (2013). Amadeus.
http://acgt.cs.tau.ac.il/amadeus/download.html.
MicroRNA.org (2013). Microrna.org - release notes. http://
www.microrna.org/microrna/releaseNotes.do.
mirbase.org (2013). mirbase.org. http://www.mirbase.org.
Najafi-Shoushtari, S. H., Kristo, F., Li, Y., Shioda, T.,
Cohen, D. E., Gerszten, R. E., and N¨a¨ar, A. M.
(2010). Microrna-33 and the srebp host genes co-
operate to control cholesterol homeostasis. Science,
328(5985):1566–1569.
NCBI (2013). Entrez programming utilities help. http://
www.ncbi.nlm.nih.gov/books/NBK25501.
Penna, E., Orso, F., Cimino, D., Tenaglia, E., Lembo, A.,
Quaglino, E., Poliseno, L., Haimovic, A., Osella-
Abate, S., De Pitt`a, C., et al. (2011). microrna-
214 contributes to melanoma tumour progression
through suppression of tfap2c. The EMBO journal,
30(10):1990–2007.
Penna, E., Orso, F., Cimino, D., Vercellino, I., Grassi, E.,
Quaglino, E., Turco, E., and Taverna, D. (2013). mir-
214 coordinates melanoma progression by upregulat-
ing alcam through tfap2 and mir-148b downmodula-
tion. Cancer research, 73(13):4098–4111.
Rice, S. J., Lai, S.-C., Wood, L. W., Helsley, K. R., Runkle,
E. A., Winslow, M. M., and Mu, D. (2013). Microrna-
33a mediates the regulation of high mobility group
at-hook 2 gene (hmga2) by thyroid transcription fac-
tor 1 (ttf-1/nkx2–1). Journal of Biological Chemistry,
288(23):16348–16360.
The Mizuguchi Laboratory (2013). Targetmine. http://
targetmine.nibio.go.jp/.
Tu, K., Yu, H., Hua, Y.-J., Li, Y.-Y., Liu, L., Xie, L., and Li,
Y.-X. (2009). Combinatorial network of primary and
secondary microrna-driven regulatory mechanisms.
Nucleic acids research, 37(18):5969–5980.
Wasserman Lab (2012). Transcription factor encyclopedia
(TFe). http://www.cisreg.ca/cgi-bin/tfe/home.pl.
Xu, L., Shen, S. S., Hoshida, Y., Subramanian, A., Ross,
K., Brunet, J.-P., Wagner, S. N., Ramaswamy, S.,
Mesirov, J. P., and Hynes, R. O. (2008). Gene expres-
sion changes in an animal melanoma model correlate
with aggressiveness of human melanoma metastases.
Molecular Cancer Research, 6(5):760–769.
Yuan, X., Liu, C., Yang, P., He, S., Liao, Q., Kang, S., and
Zhao, Y. (2009). Clustered micrornas’ coordination in
regulating protein-protein interaction network. BMC
systems biology, 3(65).
Zhao, M., Sun, J., and Zhao, Z. (2013). Synergetic regu-
latory networks mediated by oncogene-driven micror-
nas and transcription factors in serous ovarian cancer.
Molecular BioSystems, 9(12):3187–3198.
BIOINFORMATICS2014-InternationalConferenceonBioinformaticsModels,MethodsandAlgorithms
56
