
Validation of Numerical Simulation for Subdural Cortical
Stimulation
Using Spherical Phantoms and Anatomically Realistic Head Phantom
Jinmo jeong
1
, Donghyeon Kim
2
, Sangdo Jeong
1
, Jonghyun Lee
1
, Euiheon Chung
1,3
,
Sung Chan Jun
2
and Sohee Kim
1,3
1
Department of Medical System Engineering, Gwangju Institute of Science and Technology, Gwangju, South Korea
2
School of Information and communications, Gwangju Institute of Science and Technology, Gwangju, South Korea
3
School of Mechatronics, Gwangju Institute of Science and Technology, Gwangju, South Korea
Keywords: Cortical Stimulation, Numerical Simulation, Finite Element Method, Brain Phantom.
Abstract: The purpose of this study is to investigate the accuracy of numerical simulation for electric brain stimulation.
For this, we modelled brains using simple computational models with 2 and 3 shells, with and without
realistic head geometry, and performed numerical simulations using finite element method (FEM). The
corresponding head phantoms were constructed for the validation of simulation results. We implanted
stimulation electrodes in the head phantom, and measured the electric potential induced by the electrodes.
When comparing the electric potential obtained from numerical simulations and phantom experiments, both
results showed similar trend and amplitude, with a relative difference of 13.64% on average in the realistic
head model study. This result demonstrates that predicting the electric potential and its gradient (current
density) using computational simulation is reliable with reasonably small deviation from the actual
measurement.
1 INTRODUCTION
Electric brain stimulation (EBS) is known to be
useful in treating brain disorders: essential tremor,
chronic stroke, chronic pain, Parkinson’s disease,
movement disorder, refractory epilepsy, depression,
aphasia, and dystonia as an intervention therapy.
Although EBS is gaining a potential to treat brain
disorders and brain diseases, side effects (seizure
(Bezard et al., 1999)) and mechanisms of EBS are
obscure, and optimal stimulation parameters
(electrode position, amplitude, waveform, and
duration) remain unknown. Animal experiments and
computational studies are essential to answer these
questions. A computational study can provide the
information for estimating the effect of brain
stimulation by the implicit assumption that the
excitability of neurons is linearly proportional to the
magnitude of the current density (or electric field) in
the brain. (Wongsarnpigoon and Grill, 2012; Manola
et al., 2007) analysed the response of the neuron on
invasive brain stimulation with various stimulation
amplitudes and positions using a computational
brain model. (Opitz et al., 2013) generated an
individual brain model and showed a positive
correlation between fMRI and some simulation
results. In general, computational simulation results
are required to be validated. However, there have
been few papers on the validation of simulations.
(Wei and Grill 2005) built a phantom for the
validation of deep brain stimulation and compared
the simulation and phantom results. (Kim et al.,
2010) investigated the effect of head model,
conductivity condition, and position of stimulation
numerically, and constructed a head phantom for
verification. These studies made phantom models
and compared them with simulation results.
However, insufficient brain domain may lead to
ignore unwanted side effects, and using
oversimplified brain structures such as shell model
or smoothed cortex model may not inform the
precise effect of EBS.
The objective of this study is to investigate the
accuracy of the simulation for EBS (more
specifically subdural cortical stimulation (SuCS)).
For the study, we modelled simple sphere models
136
Jeong J., Kim D., Jeong S., Chung E., Jun S., Lee J. and Kim S..
Validation of Numerical Simulation for Subdural Cortical Stimulation - Using Spherical Phantoms and Anatomically Realistic Head Phantom.
DOI: 10.5220/0004796801360141
In Proceedings of the International Conference on Bioinformatics Models, Methods and Algorithms (BIOINFORMATICS-2014), pages 136-141
ISBN: 978-989-758-012-3
Copyright
c
2014 SCITEPRESS (Science and Technology Publications, Lda.)

based on 2- and 3-shells and constructed the
corresponding head phantoms. Based on these
models, we implanted stimulation electrodes in the
head phantom, and measured the electric potential
induced by the electrodes. In the phantom modelling,
we used agarose/NaCl mixture to control the electric
conductivity and the shape of head phantom. In
addition, we made a computational brain model
based on a geometry obtained from magnetic
resonance imaging (MRI) and compared the
simulation and phantom experimental results.
2 METHODS
As the purpose of this study is to validate the
simulation for EBS, especially SuCS, the brain
geometries for simulation and phantom model were
identical. For comparison, we made 3 types of brain
models (2 shells, 3 shells, and 3 shells with realistic
brain geometry). We used similar isotropic
conductivity that was measured through experiments
in the human brain except the 2 shells model (Datta
et al. 2009). Figure 1 shows the schematic view of
each model.
2.1 Simulation Modelling
In general, EBS involves injecting into the brain the
direct electrical current or induced current by
voltage via electrode(s). Maxwell’s equation
explains such electrical behaviour within the brain;
thus, the following Laplace equation governs the
domain in our simulation model Ω:
Ω in 0V)(σ
(1)
Here V and σ are an electrical potential and an
electrical conductivity in Ω, respectively. Assuming
that the electric flux through out of model Ω is
negligibly small (that is, insulated), the Neumann
boundary condition is applied on outer boundaries of
the model as follows:
outer
Ω on 0Jn
(2)
where n and J are the normal vector to the boundary
and the current density, respectively. Further, the
Dirichlet boundary conditions are applied at the
cathode electrode surface ψ
cathode
in the model Ω and
anode electrode surface ψ
anode
as follows:
cathode
Ψon 0V
(3)
anode
0
onVV
(4)
where V
0
is an input voltage magnitude. We applied
simulation voltage V
0
as 5V in the 2 and 3 shell
models. Also, 1V simulation voltage was applied in
the 3 shell model with realistic brain geometry. To
obtain the solution for this numerical problem, we
used the finite element method (FEM). To solve the
boundary value problem using FEM, volume mesh
was generated in an adaptive way: we applied
volume constraint factor to each model component,
so that the mesh was coarse around simple
structures, while a finer mesh was used around
complex structures. The numbers of tetrahedron
elements were 2,189,812 for 2 shells model,
2,154,260 for 3 shells model, 3,026,529 for 3 shells
model with realistic brain geometry. The
convergence of stimulation’ results using finer
model was verified as 2 shells: 0.0098%, 3 shells:
0.0056% and 3 shells with realistic brain: 1.9%. Bi-
conjugate gradient stable solver with incomplete LU
preconditioner was used as the solver. All
simulations were done using COMSOL
Multiphysics 4.3 (COMSOL Inc Burlingtonm, MA).
2.2 Phantom Design and Measurement
For the purpose of validating simulation results, we
constructed the phantoms that correspond to each
simulation model. For modelling Sphere phantoms,
we used ‘mold’ to shape the model’s geometry.
Sphere based models (2 shells and 3 shells) were
made using commercially available plastic sphere
molds. To make a Sphere phantom with 2 and 3
shells, we assembled the phantom from inner layer
to outer layer. At first, the two plastic sphere molds
having different radius were prepared, then we filled
the inner sphere mold using agarose/NaCl mixture.
Figure 1: (a): Production process of the sphere phantom,
(b): Schematic of assembled brain phantom, (c) location of
the electrode, (d) The completed brain phantom.
ValidationofNumericalSimulationforSubduralCorticalStimulation-UsingSphericalPhantomsandAnatomically
RealisticHeadPhantom
137

After producing the inner layer, we put the mold of
the next outer layer in position and then filled with
agarose/NaCl mixture again. At second, we added
the outermost layer using the other plastic sphere
molds which is larger than other molds for make a 3
shells sphere phantom. Figure 1-(a) shows the
process of assembling the sphere phantom. Also, as
shown in Figure 1-(b), magnetic resonance images
(MRI) of human brain were used to generate a mold
for making the 3 shells model with realistic brain
geometry. The MRI data was segmented as skin (3
rd
layer), skull and cerebrospinal fluid (CSF) (2nd
layer), and gray matter and white matter (1st layer).
Then based on the segmented data, we made the
mold using a 3D printer (Inspire 3D Printer, A450).
Figure 1 -(c, d) shows the model phantoms made of
3 shells and 3 shells with realistic brain geometry,
respectively. We placed two stimulation electrodes
for anode and cathode, respectively: the anode on
one side of the sphere and the cathode on the
opposite side of the first one. Especially, in the 3
shells model with realistic brain geometry, two
stimulation electrodes were placed on motor cortex
(figure 1-(c)) and a reference electrode was placed
on bottom of the model. A 5[V] DC voltage was
applied on each model using a function generator
(Agilent, E3631A) and the voltage was measured by
a digital multi-meter (Agilent, 34410A). Electric
potentials induced by the electrodes implanted in the
phantoms were measured at surface, 10mm depth,
and 2cm depth of each phantom and the measuring
points in 2 shells and 3 shells phantom was from 10°
to 170° with 10° interval (figure 2-(a, b)). 3 shells
model with realistic brain geometry had irregular
sensing points and is shown in figure 2-c.
2.3 Conductivity of Phantom Material
One of the methods to assign the conductivity of the
phantom is to adjust the NaCl concentration (mg/ml)
in agarose since the electrical conductivity of
agarose was controlled by changing the
concentration of NaCl((Wongsarnpigoon and Grill
2012; Manola et al., 2007)). In this study, powdered
agarose (Affymetrix, Agarose - LE) and NaCl were
mixed with deionized (DI) water. This solution
including agarose (2.6mg/ml), NaCl (DUKSAN,
Sodium Chloride) and DI water was stirred using a
magnetic stir bar and poured into a regular
hexahedron mold. The dimensions of the mold were
74 mm of length, 25 mm of width and 2.4 mm of
length. The resistance of completed agarose/NaCl
mixture was measured by an impedance
measurement system (Gamry, Reference 600) for
identifying the conductivity of agarose with NaCl,
and then we calculated the conductivity using
equation.
ΩΑℓ/ σ
(5)
Here σ, ℓ, and A is conductivity [S/m], length [m],
and area [m
2
], respectively. Ω is the measured
resistance [ohm]. Thus, the ratio of NaCl
concentration to agarose was estimated and adjusted
to mimic the conductivity of the phantom similar to
that of the human brain.
Table 1 shows the conductivities of each layer in
the phantoms used in this study. The assigned
conductivity for 2 shells was not like actual brain
conductivity. However, the other models had similar
isotropic conductivity that was measured through
experiments in the human brain (Datta et al., 2009).
Figure 2: (a, b): Schematic view of 2 shells and 3shells sphere phantom model, (c): Schematic view of brain phantom model.
The numbers on (c) represents sensing points.
BIOINFORMATICS2014-InternationalConferenceonBioinformaticsModels,MethodsandAlgorithms
138
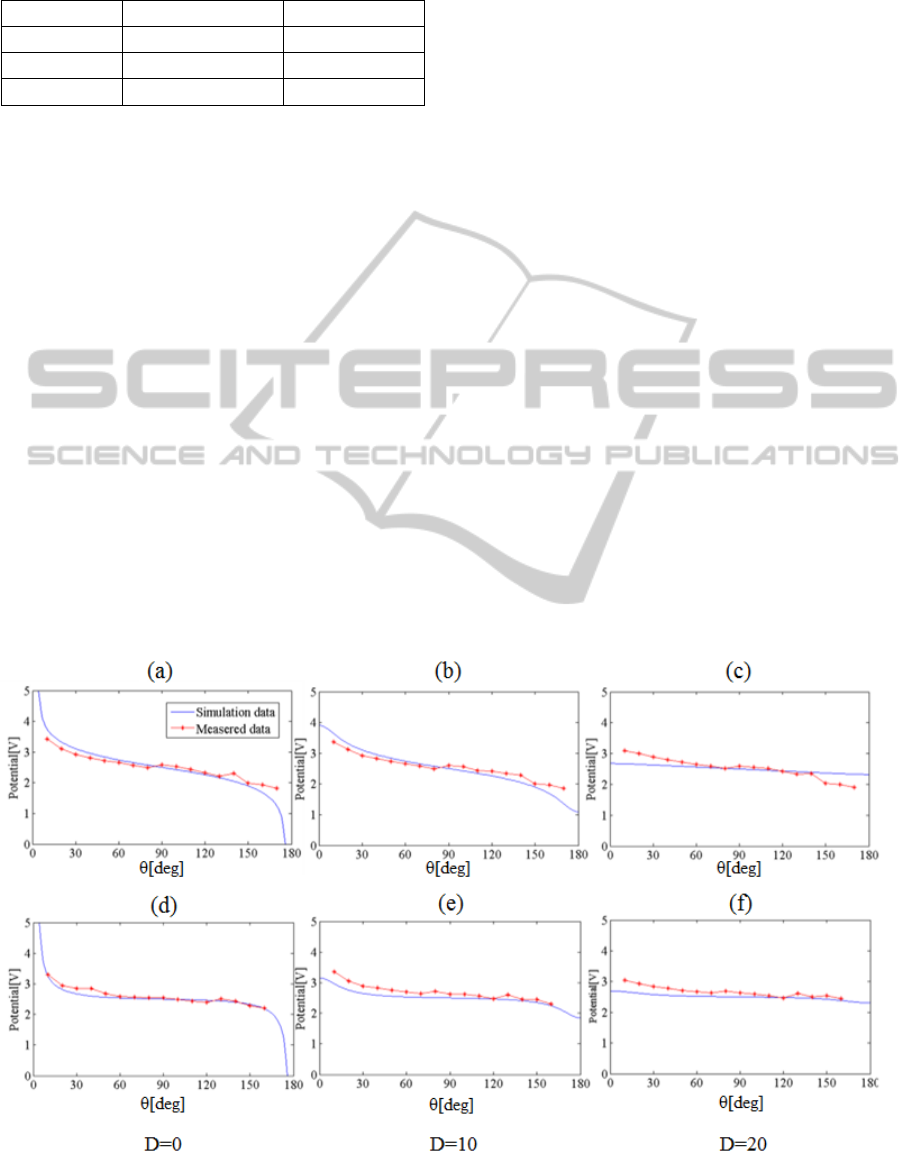
Table 1: The conductivity of each spherical phantom and
simulation model (1
st
layer is central part).
2 shells 3 shells
1
st
layer 0.012 [S/m] 0.214 [S/m]
2
n
d
layer 0.28 [S/m] 0.012 [S/m]
3
rd
layer - 0.470 [S/m]
3 RESULTS
3.1 Sphere Phantom Results versus
Simulation Results
Figure 3-(a-c) shows the result of numerical
simulation and phantom experiment using 2 shells
sphere model. When we measured the electric
potential with polar angles from 10° to 170° on a
basis of the center of shells with 10° interval, the
slope of electric potential was steep around the
electrodes and flat far away from the electrodes.
Also, there was small variation in electric potential
when measured at points deep inside the brain model.
Overall behaviour between simulation and phantom
experiment were similar and the relative difference
was quite low (4.68% on average). Even in the
steepest area (θ: 0~30°, d: 0~10mm), the phantom
experimental result was in good agreement with the
result of simulation. Furthermore, when a more
complicated 3-shells brain model was used, we
could see a relative difference of 7.18% on average
between the simulation and experimental results,
obtained at 3 different depths, as shown in figure 3-
(d-f). When comparing the simulation results of 2
shells and 3 shells sphere models, there was a
difference in magnitude of electric potential of
0.21[V] on average. However, they showed the same
shape of curve. The difference between the result of
simulation and phantom experiment was within
8.82%.
3.2 Realistic Head Results versus
Simulation Results
Figure 4 shows the electric potential at 13 different
points on surface of the head model, 10mm depth,
and 20mm depth obtained from the simulation and
phantom experiment. Most of the electric potential
from both simulation and experimental results was
around 0.87[V]. Also, from simulation, the electric
potential in the upper area of model (around
implanted electrodes; sensing point 9, 10, 11, 12,
and 13) was higher, 0.90[V] on average, when
compared to other measurement points where
0.86[V] on average was obtained. From phantom
experiment, however, the potentials at point 11, 12,
and 13 were below the average potential: potential at
point 11 was 0.86[V], 0.81[V] at point 12, and
0.84[V] at point 13 while the average potential was
0.87[V] along the depth). The average relative
Figure 3 Above: Results of the comparative experiment using 2 shells sphere model, (a): surface (b): 10mm (c): 20mm,
Below: Results of the comparative experiment using 3 shells sphere model, (d): surface (e): 10mm (f): 20mm.
ValidationofNumericalSimulationforSubduralCorticalStimulation-UsingSphericalPhantomsandAnatomically
RealisticHeadPhantom
139

Figure 4: Results of the comparative experiment using brain model, (a): surface (b): 10mm (c): 20 mm.
difference between the results was 6.02%. Relatively
higher differences were observed at the points 11, 12,
and 13: 10.60%, 11.03%, and 10.33% on average
with depth, respectively. When considering relative
difference with respect to the depth of measurement,
there was little difference among the potentials
obtained at different depths (surface: 6.23%; 10mm:
5.57%; 3cm: 6.19%).
4 DISCUSSION
We performed a number of brain phantom studies to
evaluate the accuracy of numerical simulation for
EBS. All the results (2 and 3 layer sphere models,
and 3 shells with realistic head geometry) showed
good agreements in electric potential between
simulation and phantom experiments (average
relative difference: 4.57% in 2 shells; 7.09% in 3
shells; 6.03% in 3 shells with realistic geometry) and
the trend of voltage between simulation and
phantom study was similar among results.
In relative difference view, it was low at between
electrodes and high at around anode and cathode
(around anode: 8.43%, between electrodes: 4.10%,
and around cathode: 9.85% in average with models
and depth) when we examined the relative difference
between simulation and experiment according to
different measurement points in 2 shells and 3 shells
models (polar angles: from 0° to 30°, between
electrodes: 40° to 140°, around cathode: 150° to
180°). Also, these differences are even seen in the 3
shells model with realistic brain geometry. From the
result of simulation using 3 shells with realistic brain
geometry, we could see the higher potential at point
9, 10, 11, 12, and 13 because of its position and
these points have higher relative difference than the
other points. Although, there was little difference
between simulation and phantom experimental
results, there were several limitations for validating
simulation results. First, due to a small displacement
of measuring point, there was a larger relative
difference around electrode. So far, there are reports
which tried to measure electric potential on
phantom. However, they reported the accuracy of
measured electric potential was not good because of
poor spatial control over placement of the measuring
sensor (Jung et al., 2013; Suesserman et al., 1991).
To overcome the problem, coordinate-based
measuring machine is needed. As well, generated
water screen arising in the phantom model due to
solidification of agarose/NaCl mixture has another
possibility for the difference between the simulation
and experimental results. Second, in the 3 shells
with realistic geometry phantom, the variation of
electric potential at sensing point evaluated by
numerical stimulation was not big; also the variation
of electric potential at sensing point measured by
phantom was not big. Both results mean that we
chose measuring sensing points having similar
electrical potential. To compare the both results as
aspect of validation for result of simulation, choice
the sensing points set which having big variance is
very important. As a further study, thus, we are
working on the measurements with the realistic head
phantom focusing on the vicinity of stimulation
electrodes where the gradient of potential is large as
the target region of stimulation is generally near
stimulation electrode. Furthermore similar phantom
study with varying dynamic voltage or current
instead of applying static voltage or current would
provide more insight into the realistic electrical
stimulation practice.
5 CONCLUSIONS
In this paper, we systematically compared numerical
simulation and experimental phantom results to
validate simulation tools for subdural cortical
BIOINFORMATICS2014-InternationalConferenceonBioinformaticsModels,MethodsandAlgorithms
140

stimulation. Based on our results, we could see good
agreements between simulated and measured
electrical potential in both simple spherical phantom
and realistic head phantom experiments. These
results provide a convincing justification for
investigating the effects of EBS using computational
models.
ACKNOWLEDGEMENTS
This work was supported by the Institute of Medical
System Engineering (iMSE) in the GIST.
REFERENCES
Bezard, E. et al., 1999. Cortical Stimulation and Epileptic
Seizure: A Study of the Potential Risk in Primates.
Neurosurgery, 45(2).
Datta, A. et al., 2009. Gyri -precise head model of
transcranial DC stimulation: Improved spatial focality
using a ring electrode versus conventional rectangular
pad. Brain stimulation, 2(4), pp.201–207.
Jung, Y. et al., 2013. An image-guided transcranial direct
current stimulation system: a pilot phantom study.
Physiological measurement, 937.
Kim, D.-H. et al., 2010. Distortion of the electric field
distribution induced in the brain during transcranial
magnetic stimulation. IET Science, Measurement &
Technology, 4(1), p.12.
Manola, L. et al., 2007. Anodal vs cathodal stimulation of
motor cortex: A modeling study. Clinical
Neurophysiology, 118(2), pp.464–474.
Opitz, A. et al., 2013. Physiological observations validate
finite element models for estimating subject-specific
electric field distributions induced by transcranial
magnetic stimulation of the human motor cortex.
NeuroImage, 81, pp.253–64.
Suesserman, M. F., Spelman, F. a & Rubinstein, J.T., 1991.
In vitro measurement and characterization of current
density profiles produced by non-recessed, simple
recessed, and radially varying recessed stimulating
electrodes. IEEE transactions on bio-medical
engineering, 38(5), pp.401–8.
Wei, X. F. & Grill, W. M., 2005. Current density
distributions, field distributions and impedance
analysis of segmented deep brain stimulation
electrodes. Journal of neural engineering, 2(4),
pp.139–47.
Wongsarnpigoon, A. & Grill, W. M., 2012. Computer-
based model of epidural motor cortex stimulation:
effects of electrode position and geometry on
activation of cortical neurons. Clinical
neurophysiology : official journal of the International
Federation of Clinical Neurophysiology, 123(1),
pp.160–72.
ValidationofNumericalSimulationforSubduralCorticalStimulation-UsingSphericalPhantomsandAnatomically
RealisticHeadPhantom
141
