
Coherence and Phase Locking Disruption in Electromyograms of
Patients with Amyotrophic Lateral Sclerosis
Mafalda Camara
1
, Mamede de Carvalho
3
, Tiago Ara
´
ujo
1, 2
, Hugo Gamboa
1, 2
and Carla Quint
˜
ao
1, 4
1
Faculdade de Ci
ˆ
encias e Tecnologia, Universidade Nova de Lisboa, Lisbon, Portugal
2
PLUX - Wireless Biosignals, Lisbon, Portugal
3
Instituto de Medicina Molecular, Faculty of Medicine, University of Lisbon, Lisbon, Portugal
4
Institute of Biophysics and Biomedical Engineering, Faculty of Sciences, University of Lisbon, Lisbon, Portugal
Keywords:
Contra and Ipsilateral, Coherence, Beta-band, Phase Locking Factor (PLF), Amyotrophic Lateral Sclerosis
(ALS), Electromyography (EMG).
Abstract:
In motor neuron disease, the aim of therapy is to prevent or slow neuronal degeneration and early diagnosis
is thus essential. Hypothesising that beta-band (15−30 Hz) is a measure of pathways integrity as shown
in literature, coherence and phase locking factor (PLF) could be used as an electrophysiological indicator
of upper and lower neuron integrity in patients with amyotrophic lateral sclerosis (ALS). In this work are
applied such tools in different variable situations. Coherence and PLF analysis was computed for EMG signals
registered from 2 groups: control subjects and ALS patients. The data was recorded during instants of steady
contraction for both contra and ipsilateral acquisitions. Ipsilateral coherence and PLF was computed for one
member of each group and results present significant differences between both groups. Contrarily, contralateral
acquisitions were performed on 6 members of each group and both coherence and PLF results present no
significant differences. So, while control subjects present no neuronal or muscular disorders and therefore
higher synchrony and coherence for beta-band EMG signals, patients with ALS do not present synchronism
or coherence in any frequency, specially for beta-band. All results allowed to conclude that contralateral
coherence is not a good measure of corticospinal pathways integrity. However, ipsilateral acquisitions show
promising results and it is possible to affirm that ipsilateral measurements may reflect neuronal degeneration.
For future work is suggested a deeper analysis of PLF, that appear to have potential as a quantitative test of
upper and lower neuron integrity related to ALS.
1 INTRODUCTION
Amyotrophic lateral sclerosis, one of the major neu-
rodegenerative diseases, is a progressive incurable
motor neuron disorder, fatal in all cases. Associ-
ated therapy involves slowing down or even prevent-
ing neuronal degeneration. Since the effectiveness of
this medication depends on an early diagnosis, many
efforts have been made to find accurate indicators of
this disease. As a general rule, patients with ALS are
diagnosed when there is already extensive motor neu-
ron degeneration present, since the diagnosis is ham-
pered by the impossibility to access the corticospinal
tract.
Some motor cortex cells are capable of synchro-
nizing their discharge with local oscillations in a
15−30 Hz range of frequency, known as beta-band.
This synchronism happens during rest or steady con-
traction but is not common during movement. Despite
all the research on this subject, there is no agreement
on which function might induce such periodic activity
(Baker et al., 2006). Some oscillatory cortical activity
involves pyramidal neurones and is reflected in the de-
scending drive to the muscles, being distributed to ag-
onist and antagonist muscles, which can be observed
in the EMG of these muscle pairs through coherence
in beta-band (Cordivari et al., 2002). Corticomuscular
coherence measures contributions from both ascend-
ing and descending pathways, which was proved by
phase analysis, suggest that muscles led the cortical
recordings (de Carvalho, 2012). The timing of syn-
chronism is dependent on the intrinsic properties of
the inhibitory interneurons and their conduction de-
lay (Jackson et al., 2004). In both upper and down
motor neuron disease, the focus is to prevent, if pos-
sible, or slow neuronal degeneration. Based on the
163
Camara M., de Carvalho M., Araújo T., Gamboa H. and Quintão C..
Coherence and Phase Locking Disruption in Electromyograms of Patients with Amyotrophic Lateral Sclerosis.
DOI: 10.5220/0004749901630170
In Proceedings of the International Conference on Bio-inspired Systems and Signal Processing (BIOSIGNALS-2014), pages 163-170
ISBN: 978-989-758-011-6
Copyright
c
2014 SCITEPRESS (Science and Technology Publications, Lda.)

hypothesize that beta-band coherence could be used
as an indicator of neuronal integrity, the aim of this
work is to obtain coherence values averaged for each
population and evaluate if significant differences were
present between them. Therefore, find a way of an
early diagnose for ALS, resorting to contra or ipsi-
lalateral acquisitions.
1.1 Amyotrophic Lateral Sclerosis
This pathology is one of the major neurodegener-
ative diseases, a progressive disorder that involves
widespread degeneration of the motor system neu-
rons. Regions affected undergo destruction of layer
V pyramidal neurons from the motor cortex to the an-
terior horn of the spinal cord. To diagnose such a
disease it is necessary to find upper and lower mo-
tor neuron degeneration in multiple regions: bulbar,
cervical, thoracic and lumbar. This disorder is char-
acterized by the neurological regions affected, but
there are common features observed in all patients
such as a rapidly progressive weakness, muscle at-
rophy, muscle cramps, fasciculations, muscle spas-
ticity, difficulties in breathing (dysponea), difficulties
in swallowing (dysphagia) and difficulties in speak-
ing (dysarthria). Patients tend to lose their abilities
to control voluntary movements and symptoms tend
to greatly reduce their quality of life (Kiernan et al.,
2011).
1.2 Electromyography and Beta-band
Voluntary movement is associated with the presence
of rhythmic activity in motor cortex. Beta-band, com-
prising a range of frequencies from 15 to 30 Hz, ap-
pears to vary its magnitude prior and during volun-
tary movements and is associated with the attempt to
perform certain tasks (Halliday et al., 1998). In this
same frequency band, cortical activity and motor unit
firing are correlated during sustained voluntary con-
tractions. Intermuscular coherence (EMG - EMG) be-
tween different muscle groups appears to detect char-
acteristics of the same rhythmic processes, suggesting
a common drive from corticospinal pathways. The
precise function and genesis of these same cortical os-
cillations still remains elusive (Marsden et al., 2000).
Motor units from muscle pairs can be modulated by a
descending 15 - 30 Hz drive. So, this frequency band
oscillations are mediated via corticospinal pathways,
originating from sensorimotor cortex and are coher-
ent with muscles (Marsden et al., 2000; Nishimura
et al., 2009). These oscillations may arise in mo-
tor systems in order to promote synchronous neuronal
firing between neurons populations that are spatially
distributed but functionally related, providing means
of linking different neuronal populations (Marsden
et al., 2000). Coherent activity may represent a com-
mon element in coding activity in simultaneous active
motor centres. Cortical areas involved in the same
motor task may be coherent with each other. Active
muscles show coherence around beta-band, reflecting
the activity of neuronal structures involved in driving
the spinal motoneurons (Nishimura et al., 2009). Co-
herence has demonstrated that some of these oscilla-
tions are probably transmitted via pyramidal tract to
activate muscles and may induce the same rhythm on
them (Nishimura et al., 2009).
1.3 Coherence
Coherence analysis of motor unit firing behaviour
can provide information about the organization of
networks responsible for driving spinal motoneurons
during task performance. It also assesses common
presynaptic inputs that synchronize motor units pop-
ulations. In the human body, different activities may
be characterized by functional activities in distinct
circuits, due to muscles discharges at a certain fre-
quency. Some of these oscillating frequencies let to
spinal motoneurones (Grosse et al., 2002). Coherence
is a measure of the linear correlation between the fre-
quencies presented in two signals, being usually com-
puted using discrete Fourier transforms. As a function
of frequency (λ), for the rectified x and y signals, auto
spectra f
x,x
(λ), f
y,y
(λ) and cross spectra f
x,y
(λ) are
calculated to assess measures of correlation (Farmer
et al., 2007; Grosse et al., 2004). Cross-correlation is
assessed by coherence function - |R
x,y
(λ)|
2
- defined
as the squared magnitude of cross spectrum, normal-
ized by the product of the two auto spectra as show in
equation 1.
|R
x,y
(λ)|
2
=
| f
x,y
(λ)|
2
| f
x,x
(λ) f
y,y
(λ)|
(1)
1.4 Phase Locking Factor
During oscillatory activity, neurons fire syn-
chronously. Therefore, common target cells will
receive neural activity synchronously and so, os-
cillations play an important role for the timing of
neural activity (Klimesch et al., 2008). On the
assumption that coherence between two signals exists
for beta-band, it would be interesting to investigate if
both signals are synchronized within this frequency
range. I.e. if the phase difference between the signals
is kept constant. To evaluate such behaviour, one
can determine the phase locking factor between both
BIOSIGNALS2014-InternationalConferenceonBio-inspiredSystemsandSignalProcessing
164
signals, using Hilbert transforms. For signals x and y,
φ
x
(t) and φ
y
(t) represent signals phase dependency
on time, respectively, for t = 1, ..., T . PLF between
both signals is defined by (Almeida et al., 2011):
ρ
xy
≡ |
1
T
T
∑
t=1
e
i[φ
jx
(t)−φ
y
(t)]
| = |he
i[φ
x
(t)−φ
y
(t)]
i| (2)
PLF assumes values from 0 to 1. 0 stands for
signals entirely asynchronous, with phases randomly
distributed; 1 stands for signals perfectly synchro-
nized and with a constant phase lag. Values between 0
and 1 represent partial synchrony. To perform the PLF
computation it is necessary to isolate the frequencies
of interest, applying a band-pass filter with a narrow
band centred on each value of frequency in study.
2 ACQUISITIONS
2.1 Subjects
Focussing on previous published results (Fisher et al.,
2012), ipsilateral measurements were performed on
1 member from the group of patients and 1 mem-
ber from the group of control. Contralateral measure-
ments required the existence of two different groups
of subjects: group of 6 patients presenting ALS and
a control group of 6 subjects. All participants from
the control group do not present any known neuronal
or muscular disease, whereas patients with ALS had
been diagnosed within less than one year. For patients
with ALS that were in a more advanced stage of the
disease, presenting more difficulties that limited their
own movement control, it was impossible to collect
an analysable EMG signal.
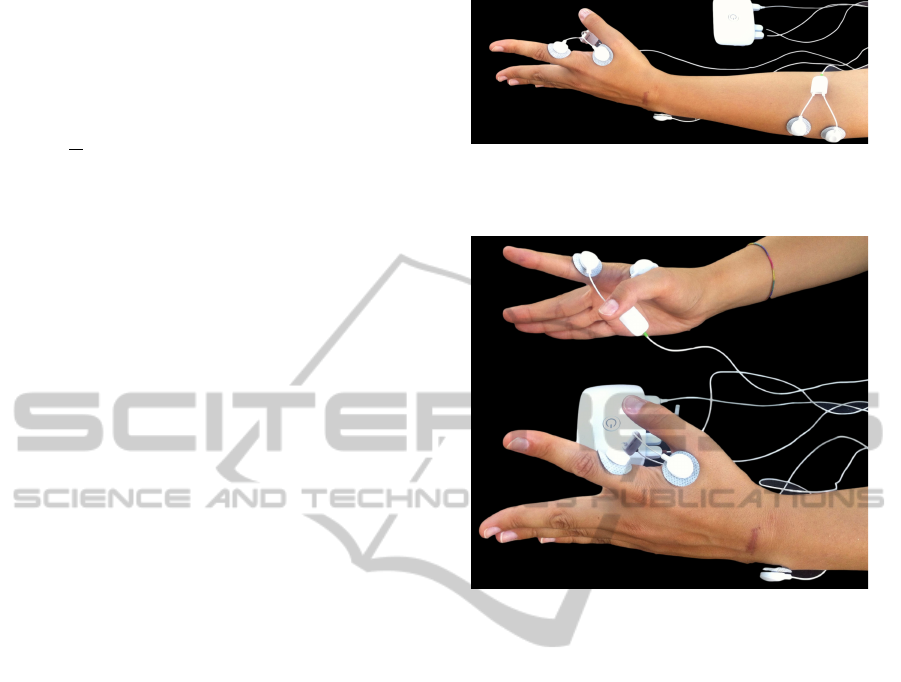
2.2 Recordings
For each ipsilateral acquisition, two signals were si-
multaneously acquired from each subject using EMG
sensors attached to a bioPlux device, as observed in
figure 1. For both right and left hand, signals were
collected using two sensors attached to first dorsal
interosseus muscle; for both right and left forearm,
signals were collected using two sensors attached to
extensor digitorum communis muscle. Ground was
placed in ulna bone inferior extremity, where no mus-
cle activity is present.
For each contralateral measurement, two signals
were simultaneously acquired from each subject, us-
ing two EMG sensors attached to a bioPlux device.
Each sensor (one for each hand) has two connected
Figure 1: Ipsilateral acquisitions experimental setup for left
member: Bioplux research device, placement of two EMG
sensors and ground.
Figure 2: Contralateral acquisitions experimental setup:
Bioplux research device, placement of two EMG sensors
and ground.
electrodes placed in first dorsal interosseus muscle.
Ground was placed as in ipsilateral recordings. Sur-
face electrodes placements are shown in figure 2.
The used device collects real time biosignals at a
frequency rate of 5 kHz and EMG sensors have sec-
ond order band pass filter with cutoff frequencies of
25 and 450 Hz . Data is transmitted via bluetooth to a
computer, where the signals can be saved and visual-
ized.
2.3 Acquisition Protocol
Subjects were asked to seat and place both hands on
a desk, 10 cm away from each other in a parallel po-
sition and with hand palms facing each other in 90
degrees of flexion with the elbow. Subjects had to el-
evate both index fingers vertically with a maximum
articular amplitude in a direction opposite to the other
fingers position, hold that position for 3 seconds while
maintaining a certain force/pressure and then return
to the initial position, where it remains for 3 seconds
while relaxing as much as possible. This movement
was repeated for 5 minutes or less according to max-
imum time tolerated by the patients. The coordinated
movement was guided by a programmed sound and
CoherenceandPhaseLockingDisruptioninElectromyogramsofPatientswithAmyotrophicLateralSclerosis
165

both fingers had to be as much coordinated as possi-
ble one to another. The protocol was used for both
contra and ipsilateral acquisitions.
3 SIGNAL PROCESSING
The acquired signals were processed using Python
language. Signals were filtered by a third order But-
terworth band pass filter of 30−2000 Hz. In order to
extract information about coherence and PLF, inter-
vals of contraction common to both signals had to be
isolated from intervals of relaxation, since coherence
is better estimated during periods of steady contrac-
tion (Fisher et al., 2012). Signals presenting higher
amount of noise will conceal real information, inhibit-
ing to distinguished contractions from relaxation in-
tervals. This and the differences among individual
signals, does not allow to predefine an onset value
common to all signals. So, instead of using a method
based on the EMG signal envelope, a method based
on statistical model was used to define contractions
onset. Initially, more than one value was assigned to
both on and offset for each contraction. In order to ob-
tain the correct on and offset for each contraction, the
excessive ones were removed when: (1) the number
of samples between the on and offset is too short or
(2) when the number of samples between the off and
following onset is too short. To guarantee that these
signals have common intervals of contractions, it is
chosen, for each contraction, the highest value from
both onsets and the lowest from both offsets.
3.1 Coherence Processing
A first analysis was performed using a long interval
of contraction record. The signal was divided on two
equal epochs, and the coherence between them was
computed. Regarding the EMG signals, they were
full-wave rectified before any fast Fourier transform
(FFT) analysis. Sampling frequency is placed as 5
kHz, the nonequispaced parameter of the FFT (NFFT)
as 2048, and the value that dictates the dependency
between FFT windows as 1024. Defining all this pa-
rameters enables to compute coherence.
Coherence is reported in two different ways. First,
to provide a visual representation of coherence de-
pendency on frequency (in the imaginary domain),
coherence mean values among intervals of contrac-
tion for a given muscle pair was performed across all
patients within a group of subjects. This allows to
obtain precise coherence values for each patient ac-
quisition based on averaging multiple independent in-
stants of data. Second, to provide an estimation of
coherence dependency on frequency across the popu-
lation of each group, mean coherence was calculated
for the same values of frequency for a given muscle
pair among all subjects within the same group. To as-
sure that the wanted band of frequency was present in
both signals of each patient, frequency spectra were
computed for all instants of contraction and then av-
eraged to present an individual spectrum for each pa-
tient.
3.2 Phase Locking Factor Processing
Since the beta-band frequencies seem to be the most
relevant for this study, PLF was calculated for specific
values of frequency f within this same band [15, 30]
Hz with a resolution of 1 Hz. This procedure was per-
formed among both control and patient groups. Each
signal was band pass filtered [ f − 2, f + 2] Hz, be-
ing f the analysed frequency. Instants of contraction
where again isolated and for each, PLF between each
pair of contra and ipsilateral measurements was cal-
culated. To present a final value for each member of
each group, PLF was averaged between all contrac-
tions within the same acquisition. This procedure, is
performed as many times as the number of the anal-
ysed frequencies. PLF was averaged among all mem-
bers within the same group to present a PLF value,
dependent on frequency choice, for a population.
4 VALIDATION
4.1 Synthetic Electromyography
For validation of the algorithms, synthetic EMG sig-
nals were used to compute coherence. To prove that
coherence exists between two signals linearly depen-
dent on each other for particular values of frequency,
sets of signals were constructed and defined by the
following equation:
signal = (sin(t × 2π f ) + k)× n(t) × mod(t) (3)
where t is a sequence of integer numbers, incre-
mented by one unit, with a desirable length; t is re-
ferred in seconds by dividing the desirable length for
5000, to take into account the sampling frequency.
n(t) represents Gaussian noise (µ = 0 and σ = 1), k
is the signal envelope, f is the signal’s frequency and
the portion mod(t) represents the rest of the division
of t by 6 bigger then 3 - guaranteeing instants of sim-
ulated contraction and relaxation of 3000 ms.
Multiple signals were created, choosing t : 8, 80
or 391s and f : 10, 20 or 40 Hz. Number of sam-
ples were chosen to provide signals with 1, 13 and 65
BIOSIGNALS2014-InternationalConferenceonBio-inspiredSystemsandSignalProcessing
166
instants of contractions to decide the more appropri-
ate time sampling for acquisitions. Frequency values
were chosen taken into account that beta-band is be-
ing studied.
For all created signals, coherence was calculated
between two of the same type signals (simulating both
right and left hand). Coherence defined by equation 3
is performed for instants of contraction and then aver-
aged for the entire measurement. Coherence results
do not present any dependency on the choice of f
value, since it assumes one for that same frequency
and nearly 0 for the remaining.
On the contrary, coherence results seem to depend
on the choice of signals length. Two types of sig-
nals were performed, both defined by equation 3, with
common value of 40 Hz for f but with different value
of t. First, signals with 65 instants of contraction, and
second signals with 1 instant of contraction; two sets
of signals, with different portions of n(t), were cre-
ated to test coherence between them. Results of mean
coherence for these pair of signals allow to affirm that
the higher the signals length, the more accurate are
the coherence results. Since noise is randomly dis-
tributed, averaging coherence of greater amount of in-
stants of contraction, tends to reduce the SNR. There-
fore, the use of long acquisitions increases the preci-
sion of coherence.
5 RESULTS AND DISCUSSION
5.1 Coherence Analysis
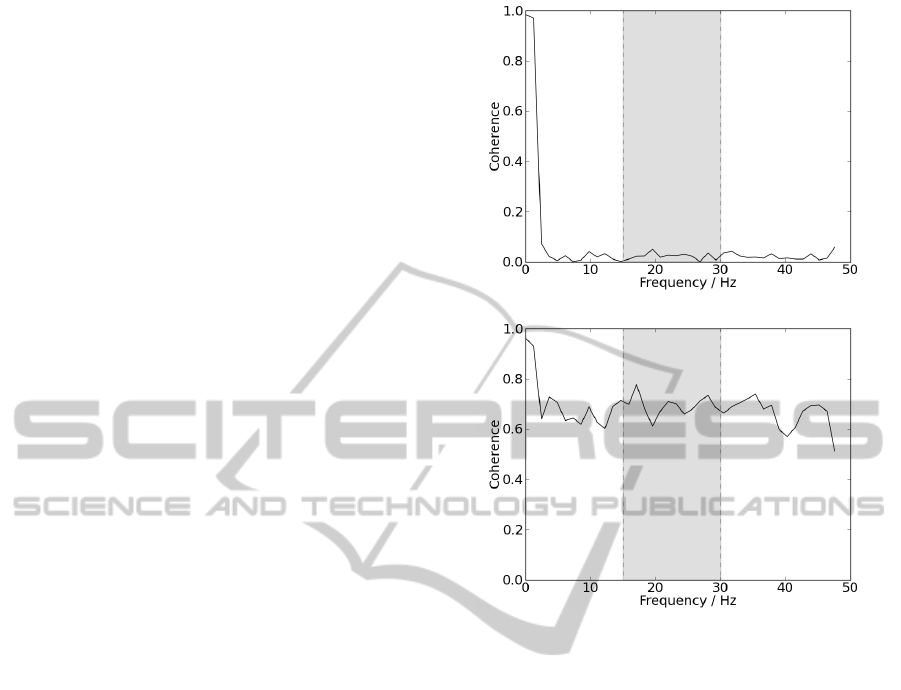
5.1.1 Ipsilateral
For both simultaneously acquired signals, ipsilateral
coherence was analysed for instants of contraction us-
ing NFFT as 4096. Graphical representation, for a
patient and a control subject, is shown in figure 3.
Analysing results, it is possible to observe that the sig-
nal acquired from the patient presents coherence near
0 for all frequencies, while coherence from the con-
trol subject presents higher values for most presented
frequencies, despite the fact that beta-band is not dis-
tinguished from the remaining frequencies.
Differences are significant since for beta-band, co-
herence mean value for the patient was 0.024 ± 0.013
and for the control subject 0.694 ± 0.040. Patient re-
sults would be expected since coherence in beta-band
is not visible for ALS. On the other hand, results from
the control group are not expected since coherence
values were higher than those observed in literature.
Differences in results may be explained by differences
in acquisition protocol, used algorithm or parameters.
(a)
(b)
Figure 3: (a) Ipsilateral coherence acquired from a patient.
(b) Ipsilateral coherence acquired from a control subject.
Delimited by the grey box, are represented the frequencies
corresponding to beta-band.
5.1.2 Contralateral
Prior to coherence analysis, the presence of beta-band
frequencies was tested, recurring to frequency spectra
analysis. Instants of muscular contraction were iso-
lated and full-wave rectified. The power spectrum
was calculated and averaged within all contractions;
these frequency spectra were performed by PSD cal-
culus. Graphical representations of these results for
patients group are shown in figure 4(a), and for con-
trol group in figure 4(b), both with NFFT as 2048.
In figure 4, results show a higher presence of beta-
band frequencies, since they appear more enhanced
than the remaining, for the majority of all results from
both hands and groups. When the frequency spectra
reveal the presence of beta frequencies, one can evalu-
ate the values of coherence within these band frequen-
cies. As shown in 5.1, ipsilateral coherence appears
to be a precise indicator of neuronal degeneration de-
velopment. Contralateral coherence is tested to check
whether results are similar to those obtained for ipsi-
lateral acquisitions. Contralateral coherence between
CoherenceandPhaseLockingDisruptioninElectromyogramsofPatientswithAmyotrophicLateralSclerosis
167
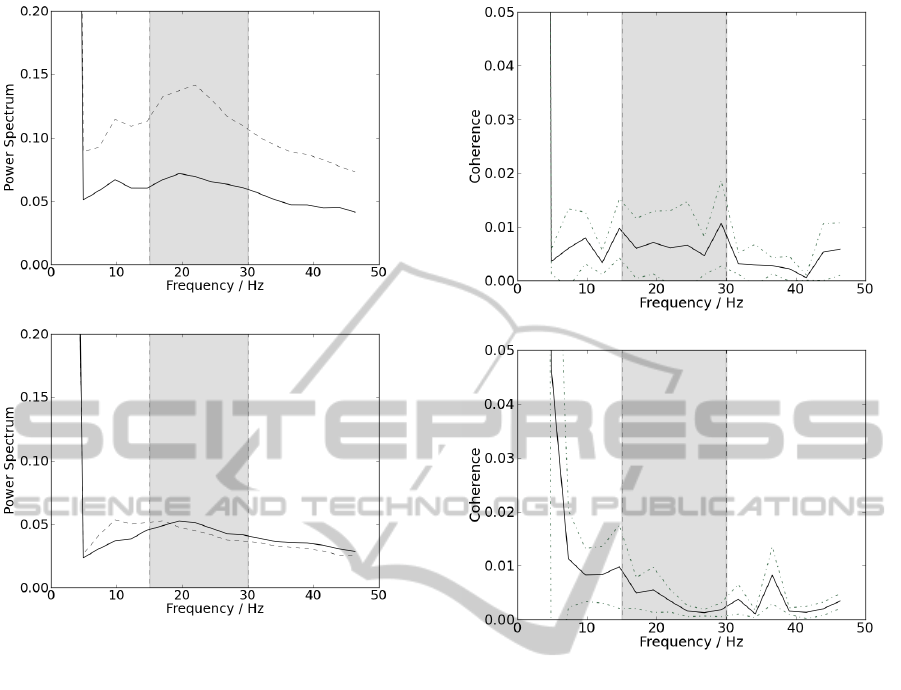
(a)
(b)
Figure 4: Representation of the power spectra. Results col-
lected from the left hand are represent by the dotted line
and results collected from the right hand are represent by
the straight line; delimited by the grey box, are represented
the frequencies corresponding to beta band. (a) Results for
the group of control and (b) for the group of patients.
both interosseous muscles, one from each side, are
shown for patients and control subjects groups in fig-
ures 5(a) and 5(b), respectively.
Results from the control group are not entirely
similar to those observed in literature. Coherence val-
ues for the beta-band frequencies do not stand out
from the ones presented in the remaining frequen-
cies. There was no significant intermuscular coher-
ence present on any of the two groups for beta-band.
Pooled coherence value for the patients group was
0.0069 ± 0.0019 and for the control group 0.0031 ±
0.0017. Coherence was present within significance
(in the same order of magnitude found in literature),
but not higher on the beta-band than the remaining
other frequencies. The analysis from the group of pa-
tients shows a behaviour similar with the group of pa-
tients. Contralateral coherence between coactivated
muscles from left and right side is not considered sig-
nificant within the beta-band. Therefore, despite the
possible presence of these frequencies (beta-band) on
(a)
(b)
Figure 5: (a) Contralateral coherence acquired from a pa-
tient. (b) Contralateral coherence acquired from a control
subject. Delimited by the grey box, are represented the fre-
quencies corresponding to beta-band.
both signals, they do not significantly depend linearly
from each other.
5.2 PLF Analysis
5.2.1 Ipsilateral
To present a final value for each member of each
group, PLF was averaged between all contractions
within the same acquisition, for each value of fre-
quency among beta-band. Therefore, this procedure
is performed as many times as the number of studied
frequencies. PLF was averaged among all members
within the same group to present pooled results, for
ipsilateral measurements. The frequencies of interest
and its respective PLF values are represented in figure
6.
The results in figure 6(a) are similar to those ob-
tained in 5.1.2. PLF values do not stand out from the
remaining in beta-band and do not assume significant
BIOSIGNALS2014-InternationalConferenceonBio-inspiredSystemsandSignalProcessing
168
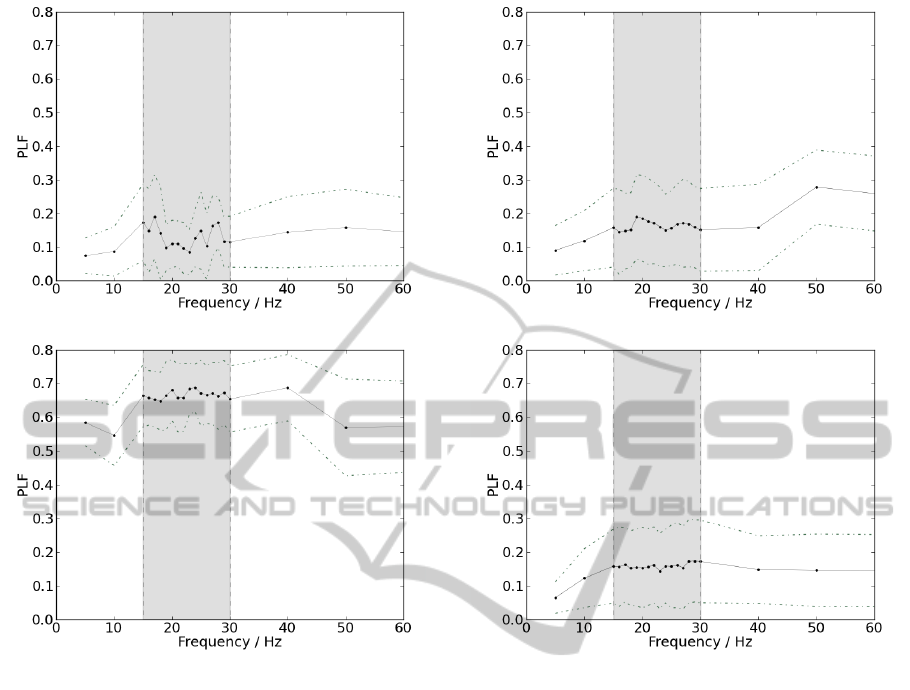
(a)
(b)
Figure 6: Schematic representation of mean PLF values as a
function of frequency, for ipsilateral acquisitions, depicted
as a straight line; standard deviation is displayed as a dotted
line. Delimited by the grey box are represented the frequen-
cies corresponding to beta-band. (a) Results from the group
of patients. (b) Results from the control group.
values for any frequency. On the other hand, observ-
ing figure 6(b), PLF assumes much higher values and
beta-band frequencies appears to stand out from the
remaining. Differences are significant since for beta-
band, PLF mean value for the patient was 0.131 ±
0.031 and for the control subject 0.6664 ± 0.0093.
5.2.2 Contralateral
Mean PLF values for the beta band in contralateral
signals, as a function of frequency, are presented in
figure 7, for the group of patients and group of con-
trol in 7(a) and 7(b), respectively. As observed in both
graphical representations of figure 7, PLF values do
not significantly stand out for the beta-band frequen-
cies, since for beta-band, PLF pooled value for the
patients group was 0.1169 ± 0.0068 and for the con-
trol subject 0.1169 ± 0.0057.
(a)
(b)
Figure 7: Schematic representation of mean PLF values as
a function of frequency, for contralateral acquisitions, de-
picted as a straight line; standard deviation is displayed as
a dotted line. Delimited by the grey box are represented the
frequencies corresponding to beta-band. (a) Results from
the group of patients. (b) Results from the control group.
6 CONCLUSIONS
Synthetic EMG signals with a specific known value of
frequency were used to test coherence between two
signals of the same type, to find whether coherence
among them is present for that frequency. For two
simulated signals of instants of contraction and relax-
ation with the same frequency, mean coherence be-
tween them for instants of contraction, are close to
1 for the specific frequency and near 0 for the re-
maining. Varying signals frequency value does not
change coherence general trends. Altering these sig-
nals length, changes the number of instants of con-
traction used to present final averaged coherence, and
the lower the number of samples, the higher will be
the influence of noise.
Both coherence and PLF analysis in ipsilateral
CoherenceandPhaseLockingDisruptioninElectromyogramsofPatientswithAmyotrophicLateralSclerosis
169

acquisitions present significant differences between
both groups of patients, as already proved by previ-
ous publications (Fisher et al., 2012). Results from
the group of patients present no significant differ-
ences from the results obtained for contra lateral ac-
quisitions while the group of subjects, presents higher
values of PLF and coherence for all frequencies, es-
pecially for beta-band. So, it is possible to assume
that while control subjects present no neuronal or
muscular anomalies and therefore higher synchrony
for beta-band, patients with ALS do not present syn-
chrony in any frequency, specially for beta-band. All
results allow to conclude that ipsilateral analysis is
a good measure of corticospinal pathways integrity.
Frequency spectrums were performed for contra lat-
eral acquisitions and it was demonstrated that beta-
band frequencies are present in instants of steady con-
traction. But, as proved by coherence and PLF analy-
sis beta-band frequencies in contralateral acquisitions
was not present in neither for patients or control sub-
jects. Neither differences or significance values were
found for both control and patients. Therefore, it is to
conclude that contra lateral frequency analysis is not a
good marker for beta-band frequencies studies. Com-
paring both methods used to study frequency domain,
PLF analysis may be seen as a more practical method
since it requires smaller sections of data, compared
to coherence. On the other hand, PLF can only be
analysed for a specific value of frequency, while co-
herence is analyzed for the range of frequencies pre-
sented on data. To conclude, as further work is sug-
gested to rely on the possibility of using PLF analysis
to observe beta-band and assess about neuronal path-
ways integrity in ipsilateral acquisitions. Therefore, it
seems possible that studying PLF serves as a method
of diagnosing ALS.
REFERENCES
Almeida, M., Vig
´
ario, R., and Bioucas-Dias, J. (2011).
Phase locked matrix factorization. In Proc. of the EU-
SIPCO Conference.
Baker, S. N., Chiu, M., and Fetz, E. E. (2006). Afferent
encoding of central oscillations in the monkey arm.
Journal of neurophysiology, 95(6):3904–3910.
Cordivari, C., Lees, A. J., Misra, V. P., and Brown, P.
(2002). Emg–emg coherence in writer’s cramp. Move-
ment disorders, 17(5):1011–1016.
de Carvalho, M. (2012). Testing upper motor neuron func-
tion in amyotrophic lateral sclerosis: the most difficult
task of neurophysiology. Brain, 135(9):2581–2582.
Farmer, S. F., Gibbs, J., Halliday, D. M., Harrison, L. M.,
James, L. M., Mayston, M. J., and Stephens, J. A.
(2007). Changes in emg coherence between long and
short thumb abductor muscles during human develop-
ment. The Journal of physiology, 579(2):389–402.
Fisher, K. M., Zaaimi, B., Williams, T. L., Baker, S. N.,
and Baker, M. R. (2012). Beta-band intermuscular
coherence: a novel biomarker of upper motor neu-
ron dysfunction in motor neuron disease. Brain,
135(9):2849–2864.
Grosse, P., Cassidy, M., Brown, P., et al. (2002). Eeg-emg,
meg-emg and emg-emg frequency analysis: physi-
ological principles and clinical applications. Clin-
ical neurophysiology: official journal of the In-
ternational Federation of Clinical Neurophysiology,
113(10):1523.
Grosse, P., Edwards, M., Tijssen, M., Schrag, A., Lees,
A. J., Bhatia, K., and Brown, P. (2004). Patterns of
emg–emg coherence in limb dystonia. Movement dis-
orders, 19(7):758–769.
Halliday, D. M., Conway, B. A., Farmer, S. F., and Rosen-
berg, J. R. (1998). Using electroencephalography
to study functional coupling between cortical activity
and electromyograms during voluntary contractions in
humans. Neuroscience letters, 241(1):5–8.
Jackson, A., Spinks, R., Freeman, T., Wolpert, D., and
Lemon, R. (2004). Rhythm generation in monkey mo-
tor cortex explored using pyramidal tract stimulation.
The Journal of Physiology, 541(3):685–699.
Kiernan, M. C., Vucic, S., Cheah, B. C., Turner, M. R.,
Eisen, A., Hardiman, O., Burrell, J. R., and Zoing,
M. C. (2011). Amyotrophic lateral sclerosis. The
Lancet, 377(9769):942–955.
Klimesch, W., Freunberger, R., Sauseng, P., and Gruber, W.
(2008). A short review of slow phase synchronization
and memory: evidence for control processes in differ-
ent memory systems? Brain research, 1235:31–44.
Marsden, J., Ashby, P., Limousin-Dowsey, P., Rothwell, J.,
and Brown, P. (2000). Coherence between cerebellar
thalamus, cortex and muscle in man cerebellar thala-
mus interactions. Brain, 123(7):1459–1470.
Nishimura, Y., Morichika, Y., and Isa, T. (2009). A sub-
cortical oscillatory network contributes to recovery
of hand dexterity after spinal cord injury. Brain,
132(3):709–721.
BIOSIGNALS2014-InternationalConferenceonBio-inspiredSystemsandSignalProcessing
170
