Event Clustering of Lifelog Image Sequence using Emotional and Image
Similarity Features
Photchara Ratsamee, Yasushi Mae, Masaru Kojima, Mitsuhiro Horade, Kazuto Kamiyama
and Tatsuo Arai
Graduate School of Engineering Science, Osaka University, 1− 3, Machikaneyama-cho, Toyonaka, Osaka, Japan
Keywords:
Lifelog Image Clustering, Rank-order Distance based Clustering and High Variance Event.
Abstract:
Lifelog image clustering is the process of grouping images into events based on image similarities. Until
now, groups of images with low variance can be easily clustered, but clustering images with high variance
is still a problem. In this paper, we challenge the problem of high variance, and present a methodology
to accurately cluster images into their corresponding events. We introduce a new approach based on rank-
order distance techniques using a combination of image similarity and an emotional feature measured from
a biosensor. We demonstrate that emotional features along with rank-order distance based clustering can
be used to cluster groups of images with low, medium, and high variance. Experimental evidence suggests
that compared to average clustering precision rate (65.2%) from approaches that only consider image visual
features, our technique achieves a higher precision rate (85.5%) when emotional features are integrated.
1 INTRODUCTION
Lifelogging (Bush, 2001) is a concept of recording
human daily activity using wearable sensors. For ex-
ample, a camera mounted on human head were used
to capture images along with GPS for human local-
ization. Currently, concept of lifelog, especially vi-
sual lifeloging, has been applied in many applications
such as memory recall for Alzheimer patient (Hodges
et al., 2006), summary of daily activities as a visual
diary or human attention analysis (Noris et al., 2011).
Since lifelog image sequences contain many im-
ages (average 2,000 images per day), they need to be
managed into a proper group (event) to retrieve by the
users in the future. Images with same content should
be properly grouped. Nowadays, there are many prac-
tical techniques that solved image clustering problem
in video or general photo clustering domain. The con-
ventional technique in video processing is based on
a scene change detection (Meng et al., 1995), which
detects the boundary frames between two consecutive
video shots. As referred in many publications, e.g.
(Yang and Cheng, 2012), shot boundary detection al-
gorithms basically detect the discontinuities in motion
activity and changes in pixel value histogram distribu-
tion between two consecutive frames. However, con-
ventional scene change detection is not applicable for
the lifelog image sequences because images from a
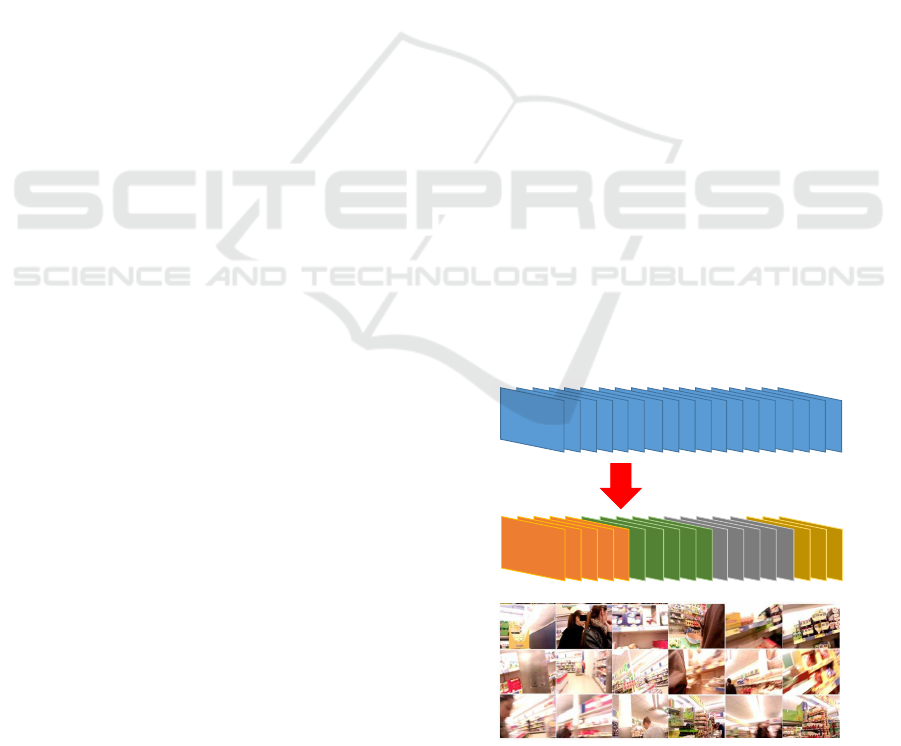
Lifelog
seq
Event Segmentation
(Image clustering)
Figure 1: (upper) Conceptual idea of lifelog image clus-
tering process. (lower) Example of lifelog image sequence
obtained from lifelog device. This kind of high variance im-
age sequence has difficulty in image clustering using related
features between consecutive frames.
visual lifelog device are passively captured in larger
discrete time intervals, e.g. 1 frame every 30 s (0.03
fps) which is relatively low when compared to video
processing (frame rate of video are usually at 24−30
fps). Two consecutive images might have a totally dif-
ference in term of image content (high variance event
as seen in Fig.1).
618
Ratsamee P., Mae Y., Kojima M., Horade M., Kamiyama K. and Arai T..
Event Clustering of Lifelog Image Sequence using Emotional and Image Similarity Features.
DOI: 10.5220/0004741206180624
In Proceedings of the 9th International Conference on Computer Vision Theory and Applications (VISAPP-2014), pages 618-624
ISBN: 978-989-758-003-1
Copyright
c
2014 SCITEPRESS (Science and Technology Publications, Lda.)

(b)
(a)
(c)
Figure 2: Possible type of event occurred in lifelog image
sequence (a) low variance event (b) medium variance event
and (c) high variance event.
Commercial visual lifelogging devices are avail-
able, such as Sensecam (Hodges et al., 2006). It was
used in many scenarios such as visual diary,and mem-
ory assistance. Hierarchical clustering (Kuli´c et al.,
2011) is one approach that particularly applies to im-
age clustering problem. However, the number of fi-
nal clusters i.e. the number of actual events need to
be known before clustering technique is applied. In
K-mean or X-means clustering (Blighe et al., 2008)
method, the number of clusters is predefined. Later,
Wang et al. (Wang and Smeaton, 2012) improve K-
mean clustering by utilizing PCA to identify the most
appropriate number of clusters.
The image clustering in lifelog domain also uses
the benefit of additional sensors to help in the seg-
mentation process. For example, Doherty et al. (Do-
herty et al., 2008; Doherty et al., 2007) investigate
Sensecam and proposed an image clustering frame-
work using multiple image features with the tempera-
ture readings, light measuring, and accelerometer val-
ues to help the event segmentation process. In (Blighe
et al., 2008), cellular data such as GSM from mobile
phone was fused with image features. Connaire et al.
(Conaire et al., 2007) use 3 features which are block-
based cross-correlation, accelerometer value, and the
distribution of the histogram information and spatial
information.
So far, images are clustered based on their abso-
lute distance from similarity features between consec-
utive images and data from additional sensors. How-
ever, many unsolved problems still remained in the
lifelog processing domain. Lifelog image sequences
are not intentionally captured and taken under un-
controlled environments. Three types of events, pre-
sented in Fig. 2, are expected to exist in the lifelog
image sequence which are:
1. Low Variance Event. The group of images that
usually have similar content. Examples are siting
in the room or using a computer.
2. Medium Variance Event. The group in which al-
most all images have similar content. However,
some images have different content but do not
considered as noise. The example of this type of
event is cooking since human are usually focus on
the cooking platform but sometime need to move
to refrigerator to take some ingredient.
3. High Variance Event. The group in which almost
all images have different content but are consid-
ered to be in the same event, for example, shop-
ping or sight seeing.
We define similarity in term of image features (i.e.
texture and color), as detailed in the Section 4. Many
sub clusters are formed when differentcontent images
exist in between similar images in medium to high
variance event. Furthermore, another problem of im-
age clustering is a highly subjectiveissue. When users
cluster images by themselves, they consider semantic
meaning, feeling or characteristic of event.
The objective of this study is to automatically and
accurately cluster lifelog images into a number of
events that mostly match the group of images clus-
tered by the user. We propose a lifelog image clus-
tering method based on not only image similarity
features but also emotional features. To detect hu-
man emotion, we utilize wearable bio-sensors (Wag-
ner et al., 2005) that the user will wear alongside the
camera. The wearable biosensor quantifies excite-
ment by measuring physiological responses in skin
conductance. All similarity features are integrated
as an absolute distance. Finally, Rank-order distance
based clustering algorithm (Zhu et al., 2011), which
uses the degree of similarity, are applied for lifelog
image clustering.
This paper is structured as follows: Section 2
presents our proposed lifelog image clustering using
image similarity and emotional features. We describe
the evaluation of our proposed method in Section 3.
Section 4 describes experiments and results of lifelog
image segmentation. Finally, conclusion and future
work are discussed in Section 5.
2 METHODOLOGY
We investigate a user when he/she manually clus-
ters event from the enormous amount of images for
ground truth. We notice that the users use their mem-
ory and feeling to group images into event. Based on
this evidence, we design a method for lifelog image
clustering based on image similarity and emotional
features. The structure of the proposed lifelog image
clustering is shown in Fig. 3.
EventClusteringofLifelogImageSequenceusingEmotionalandImageSimilarityFeatures
619
Input
Camera
(Images
Sequence)
Biosensor
(EDA signal)
Feature
Extraction
SURF
Color histogram
Frame index
Emotion state
Rank Order
Distance based
Clustering
Event Set
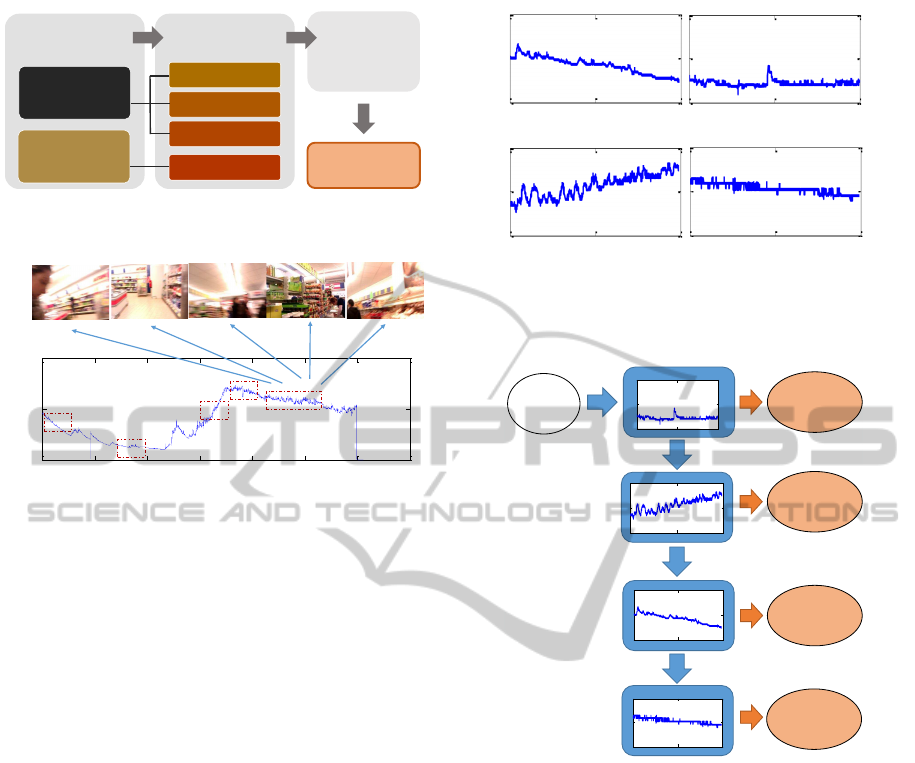
Figure 3: The structure of the proposed lifelog image clus-
tering.
0 1000 2000 3000 4000 5000 6000 7000
0
5
10
Time (s)
EDA (uS)
(a)
(b) (c)
(d)
Figure 4: The EDA data from biosensor with correspond
to image sequence. Even the images are visually different,
the pattern of EDA data provides significant clue for image
clustering.
2.1 Image Similarity Features
We extract 3 image similarity criteria which are the
number of Speeded Up Robust Features (SURF) (Bay
et al., 2006) matching points, color histogram inter-
section and frame number distance.
1. SURF Matching Points (m
1
): High SURF match-
ing points imply directly to the similarity between
images.
2. Color Histogram Intersection (m
2
): Apart from
the matching point, high overlapping of color his-
togram also implies high degree of similarity.
3. Frame Distance (m
3
): Closer frame have higher
chance to contain similar contents or similar
scenes than frames that are further away.
2.2 Emotional Feature (m
4
)
Only image similarity features are not sufficient to
cluster medium and high variance events. We add clue
about human emotion such as exciting or relaxing pat-
tern for lifelog image clustering.
Different persons will have different EDA charac-
teristic and pattern. We use Support Vector Machine
(SVM) to learn the emotion state pattern presented in
Fig. 5. For this work, we predefine 4 patterns for
emotional states which are
(a)
(b)
(c) (d)
Figure 5: The class of emotional state corresponded to EDA
signal in Fig. 4 which are (a) Relaxing (b) Inactive (c) Ex-
citing and (d) Active.
Input
EDA
signal
0 500 1000
0.1
0.15
0.2
(a) Resting
1000 0 500 1000
5
6
7
(b) Incresingly Exciting
0 500 1000
2
3
4
(c) Relaxing
Inactive
Exciting
Relaxing
(b) Incresingly Exciting
0 500 1000
5
5.5
6
(d) Exciting
Active
Figure 6: The SVM cascading classification of emotional
state from input EDA data.
1. Relaxing: when EDA data decreases from high
level to low level.
2. Inactive: when EDA data remains at the low level.
3. Exciting: when EDA data increases from low
level to high level
4. Active: when EDA data remains at the high level.
The window of pattern is applied for learning and
classifying to over EDA signal. The window con-
figuration will be discussed in Section 4.1. Because
SVM classifier was basically designed for binary lin-
ear classification, Multi-SVM classifier are used to
classify emotional patterns. The decision tree of SVM
is shown in Fig. 6. Each classifier in the decision tree
classifies only the target pattern. The first classifier
is used to separate resting state out of others. After-
ward, the excitement state and getting excited state
will be classified on to the next classifier respectively.
VISAPP2014-InternationalConferenceonComputerVisionTheoryandApplications
620
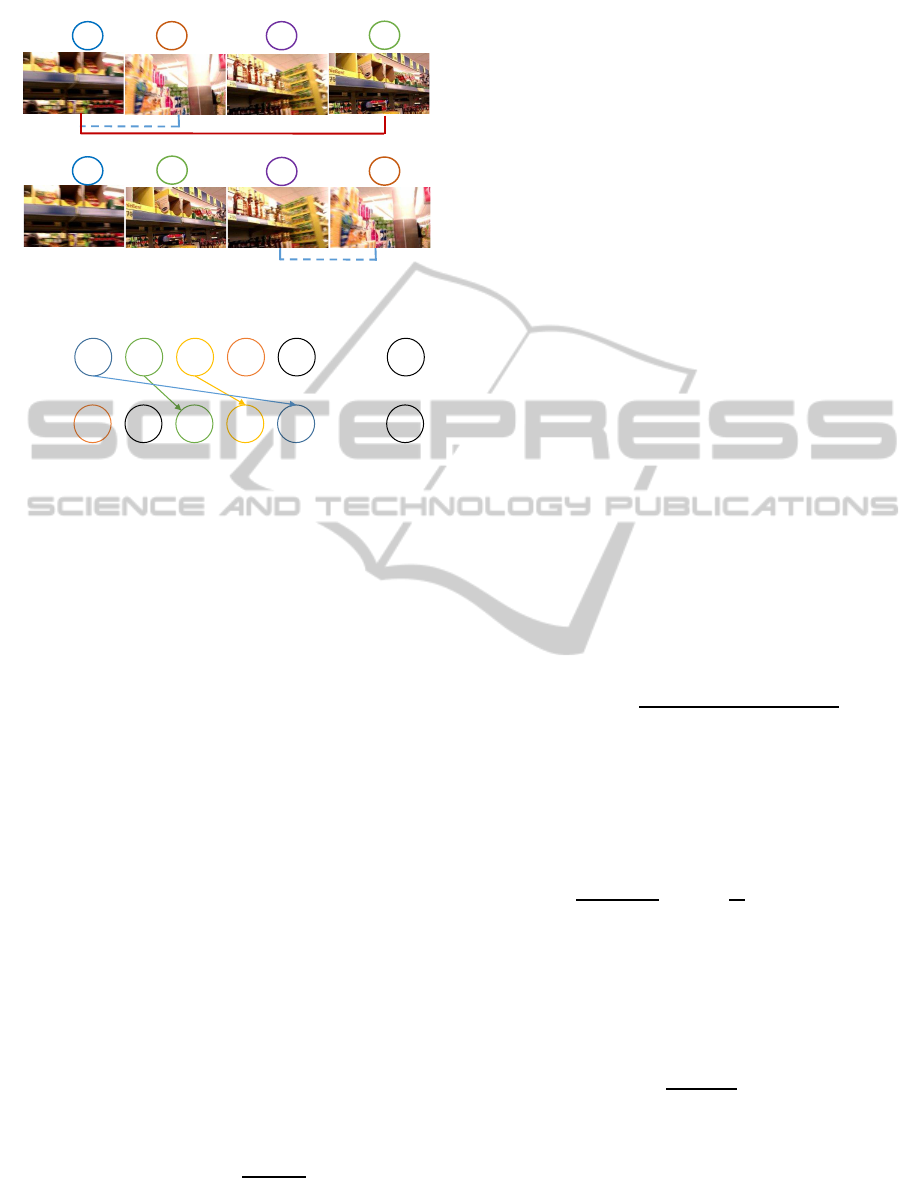
a
Image
b
Image
closer
d
Image
c
Image
Images sequence sorted by absolute distance
(b)
(a)
a
Image
d
Image
c
Image
b
Image
Figure 7: (a) The problem of absolute distance (b) Sorted
images sequence.
:
i j
C C
S
:
j i
C C
S
Order: 0 1 2 3 4
…
…
(1)
i j
C C
f
(2)
i j
C C
f
(0)
i j
C C
f
i
C
i
C
j
C
j
C
d
n
l
C
x
C
l
C
x
C
Figure 8: Rank-order distance calculation.
For accuracy, different person will have their own cal-
ibration and training data.
To integrate emotional feature with image similar-
ity features, we compare emotional state of two im-
ages. If the emotional state is the same, we assign
probability equal to 1, otherwise 0.5 will be given.
By using this multi-classifier, new pattern of emotion
can be easily added to decision tree.
2.3 Rank-order Distance Clustering
In our work, we complement image similarity fea-
tures and emotional feature with Rank-order distance
clustering to address non-uniform distribution prob-
lem in dynamic event. Rank-order distance clustering
was done in (Zhu et al., 2011)for face tagging appli-
cation. in this paper, we will briefly explain how to
apply with lifelog images sequence. Firstly, we use
3 image similarity and 1 emotional features to deter-
mine the absolute distance. Superposition principle
is used to integrate all the features. Weighting fac-
tor, w
i
, is introduced to each measurement and fea-
ture. Hence, the absolute distance (d
a
(k)) is com-
puted from the features (m
1
− m
4
) at each sampling
time and is computed by
d
a
(C
i
,C
j
) =
4
∑
i=1
w
i
m
i
(k)
η
i
, (1)
where m
i
(k) is the feature i of frame k. η
i
is the vari-
ance of each feature i in each event used for normal-
ization. Therefore, d
a
(k) is ranged from 0 - 1. This
technique can be extended easily when the number of
features increased. After calculating the scores of all
images in the event, we sort the image by absolute
distance (Fig. 7(b)). As presented in Fig. 7(a), us-
ing only absolute distance in scene change detection
might lead to failed clustering. This is why rank-order
distance (which considered similarity between 2 im-
ages with relative to others) is applicable to this study.
Rank-order distance based clustering is an iterative
clustering algorithm to merge sub-clusters using the
combination of a rank-order distance and a normal-
ized distance. Clustering algorithm runs as follow:
1. Initially, we assign each image to a single cluster.
2. From Fig. 8, each 2 clusters (C
i
and C
j
) are consid-
ered at a time. Therefore, we have 2 sequences (S
C
i
C
j
and S
C
j
C
i
) which start from cluster C
i
and C
j
respec-
tively.
3. Calculate asymmetric Rank-order distance
Dr(C
i
,C
j
) which is computed as
Dr(C
i
,C
j
) =
C
j
∑
n
d
=0
S
C
j
C
i
f
C
i
C
j
(n
d
)
(2)
where f
C
i
C
j
(n
d
) is the n
d
cluster in S
C
i
C
j
. Hence,
S
C
j
C
i
f
C
i
C
j
(n
d
)
is the order of the cluster f
C
i
C
j
(n
d
)
in S
C
j
C
i
. Symmetric Rank-order distance DR(C
i
,C
j
)
is computed as
DR(C
i
,C
j
) =
Dr(C
i
,C
j
) + Dr(C
j
,C
i
)
min(S
C
i
C
j
(C
j
), S
C
j
C
i
(C
i
))
(3)
4. Calculate Normalized distance DN(C
i
,C
j
). First,
we find φ(C
i
,C
j
) which is the average distance of im-
ages in two clusters to top K neighbors. φ(C
i
,C
j
) is
defined as
φ(C
i
,C
j
) =
1
|C
i
| +
C
j
∑
im∈C
i
∪C
j
1
K
K
∑
k=1
d
a
(im, f
im
(k))
(4)
im refers to images in the set of im ∈ C
i
∪C
j
. K is
the number of nearest neighbors. |C
i
| and
C
j
are the
number of images in C
i
and C
j
. Finally, normalized
distance DN(C
i
,C
j
) is found to be
DN(C
i
,C
j
) =
1
φ(C
i
,C
j
)
d
a
(C
i
,C
j
) (5)
5. Merge any cluster pair if DR(C
i
,C
j
) < T
R
and
DN(C
i
,C
j
) < T
N
. T
R
and T
N
are constant threshold.
6. Update clusters and cluster distances, and repeat
step 2. The algorithm stops when no cluster can be
merged.
EventClusteringofLifelogImageSequenceusingEmotionalandImageSimilarityFeatures
621

3 EVALUATION METHODS
We used the following terms to describe the utilized
methods. Our proposed image clustering method
(Rank-order Distance based clustering using a com-
bination of image similarity and emotional features)
is labeled as ‘RODE’. Scene change detection(Meng
et al., 1995) technique is labeled as ‘SC’ and with
additional emotional feature is is labeled as ‘SCE’.
As a comparison, we implemented K-mean cluster-
ing (Blighe et al., 2008), which is labeled as ‘KM’
and ‘KME’ for K-mean clustering with emotional fea-
ture. Finally, the ground truth in this study is the im-
age clustering from user, labeled as ‘USER’.
To evaluate the accuracy of each method, the im-
age clustering result (‘ROD’,‘KM’,‘SC’) and the im-
age clustering from user (‘USER’), are compared.
Considering direct comparison method, each cluster
should contain as many correct images as possible.
In this work, we follow the evaluation framework
based on similarity criteria described in (Zhu et al.,
2011). The precision (Ps) of clustering algorithm can
be measured by
Ps =
C
correct
C
total
(6)
whereC
correct
is number of clustered images in correct
group. C
total
is the number of images from USER
cluster.
4 EXPERIMENTS AND RESULTS
4.1 Experiment Setup
In our experiment, 6 participants wore the smartphone
(an Android phone with an automatic capturing ap-
plication)and biosensor for some of amount of time
(average 3 hours). Each participant is recorded over
a time period of 3.5 weeks. There are 25,451 im-
ages in 253 log events. Datasets range from daily
life activities for example using labtop, watching TV,
or shopping to more special ones such as traveling
and sightseeing. A sample of lifelog event set is
shown in Fig. 1. The proportions of the low, mid-
dle and high variance events are 41.2%, 23.2%, and
35.6% respectively. The lifelog image quality is var-
ied from high to low since it is unintentionally cap-
tured. The implemented image clustering and evalua-
tion method run on MATLAB in PC (E5420 2.50 GHz
Xeon CPU, 4096M RAM, NVIDIA Quadro FX 1700
graphic card). The processing time of each frame and
the evaluation process varies between 10 ms to 25 ms,
depending on the number of SURF keypoints in the
image stream and number of pairs between each clus-
ter and top neighbors considered in clustering pro-
cess. Biosensor are set to be time-synchronized with
the images from automatic capturing software.
In both emotion recognition and image clustering
method, there are several parameters that have to be
considered. To classify event into low, medium and
high variance event, we consider the average normal-
ized absolute distance d
a
between each consecutive
frames in that event. The criteria is as follow
1. Low Variance Event: when d
a
> 0.7
2. Medium Variance Event: when 0.4 < d
a
< 0.7
3. High Variance Event: when d
a
< 0.4
The window that apply for SVM learning and
classification is set to be within the interval 0-1.5 sec.
The low and high level are set to be from 0-2.5 µS
and 4.5 - 10 µS respectively. The dominant features
in SVM are slope, peak value and distance between
peaks. For ROD clustering algorithm, Rank-Order
distance threshold T
R
, Normalized distance threshold
T
N
and the number of top neighbors K are set to be
10, 1, and 8 in all experiments.
4.2 Experiment Results
In this section, we present the results and advan-
tages of our proposed image clustering method. SC
and KM image clustering are implemented to ana-
lyze the clustering performance compared to our pro-
posed ROD image clustering. The comparison of im-
age clustering using only image similarity features is
presented in Fig 9(a) and using combination of im-
age similarity features and emotional feature is pre-
sented in Fig. 9(b). As number of images increased,
the precision of each algorithms are decreased when
high variance event are processed and increased when
low variance event are processed.
By integrating the emotional features from biosen-
sor, all clustering techniques outperform the result
when using only the visual features. The example of
image that cluster by RODE technique are presented
in Fig. 10. Our proposed RODE clustering method
achieves 93.33%, 86.8%, and 76.5% of precision rate
in low, medium and high variance event. Other meth-
ods such as SC and KM clustering also achieve better
results with 55.7% and 26.7% of precision rate in high
variance event segmentation respectively.
The quality of the proposed image clustering re-
sult can also be measured by the number of perfect
cluster. As presented in Table 1, our proposed RODE
method achieve highest perfect clustering (52.1%)
when compare to others (44.7% in KME and 32.6%
VISAPP2014-InternationalConferenceonComputerVisionTheoryandApplications
622
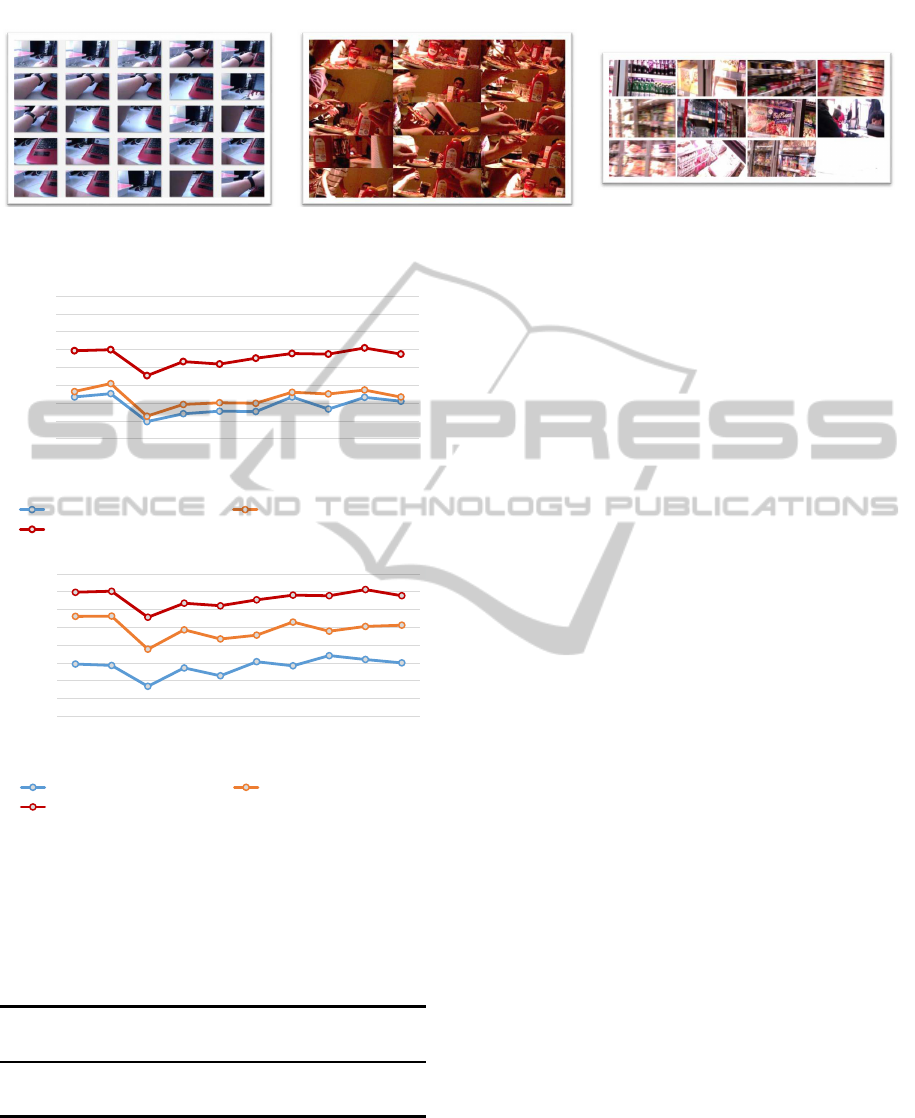
Low variance Event Medium variance Event High variance Event
Figure 10: The example of image clustering using our proposed method (RODE image clustering).
20
30
40
50
60
70
80
90
100
1000 2000 3000 4000 5000 6000 7000 8000 9000 10000
Precision(%)
Number of Images
Scene Change Detection (SC) K-Mean (KM)
Rank-Order Distance (ROD)
20
30
40
50
60
70
80
90
100
1000 2000 3000 4000 5000 6000 7000 8000 9000 10000
Precision(%)
Number of Images
Scene Change Detection (SC) K-Mean (KM)
Rank-Order Distance (ROD)
(a)
(b)
Figure 9: The precision result (Ps) from (a) scene change
detection, K-mean, and rank-order clustering algorithm us-
ing only image similarity features (b) scene change detec-
tion, K-mean, and rank-order clustering algorithm using
emotional feature and image similarity features.
Table 1: The percentage of average precision (Ps) and per-
fect cluster (Pc) of each image clustering methods.
Image clustering method
SC KM ROD SCE KME RODE
Ps 38.7 42.5 65.2 47.7 69.1 85.5
Pc 19.1 22.7 33.0 32.6 44.7 52.1
in SCE). The results confirm that emotional relation-
ship between each image in the cluster is a meaningful
clue for clustering process.
5 CONCLUSIONS
We propose a lifelog image clustering based on im-
age similarity and emotional features. The visual
variance in lifelog image sequence varies depending
on how much surrounding context changes. Using
only image similarity features can be clustered only
in low variance events. To solve high variance of
visual information, we introduce emotional feature
from biosensor in clustering process. Human emo-
tional state (exciting or relaxing) together with image
similarity features are processed in rank-order dis-
tance based clustering to solve medium and high vari-
ance cluster. ROD image clustering using only im-
age similarity features were achieved with the aver-
age precision of 65.2%. Our proposed RODE method
achievedlifelog image clustering with an average pre-
cision rate of 85.5%. Especially, medium and high
variance event clustering was improved from 51.8%
to 76.5% and from 59.1% to 86.8% respectively.
ACKNOWLEDGEMENTS
We would like to thank the 6 volunteering students
for data collection, ground truth labeling and scoring
and Ubiqlog software from Computer Vision Lab in
Computer Vision Lab, Vienna University of Technol-
ogy(TU Wien), Austria. Special thank to Amornched
Jinda-apiraksa who provided valuable comments on
this work.
REFERENCES
Bay, H., Tuytelaars, T., and Van Gool, L. (2006). Surf:
Speeded up robust features. pages 404–417. Springer.
Blighe, M., O’Connor, N. E., Rehatschek, H., and Kien-
ast, G. (2008). Identifying different settings in a vi-
sual diary. In Image Analysis for Multimedia Interac-
tive Services, 2008. WIAMIS’08. Ninth International
Workshop on, pages 24–27. IEEE.
EventClusteringofLifelogImageSequenceusingEmotionalandImageSimilarityFeatures
623

Bush, V. (2001). As we may think. pages 141–59.
Conaire, C. O., O’Connor, N. E., Smeaton, A. F., and
Jones, G. J. (2007). Organising a daily visual diary
using multifeature clustering. In Electronic Imaging
2007, volume 6506, pages 65060C–65060C–11. In-
ternational Society for Optics and Photonics.
Doherty, A. R., Byrne, D., Smeaton, A. F., Jones, G., and
Hughes, M. (2008). Investigating keyframe selection
methods in the novel domain of passively captured vi-
sual lifelogs. In Proceedings of the international con-
ference on Content-based image and video retrieval,
pages 259–268. ACM.
Doherty, A. R., Smeaton, A. F., Lee, K., and Ellis, D. P.
(2007). Multimodal segmentation of lifelog data.
In Large Scale Semantic Access to Content (Text,
Image, Video, and Sound), pages 21–38. LE CEN-
TRE DE HAUTES ETUDES INTERNATIONALES
D’INFORMATIQUE DOCUMENTAIRE.
Hodges, S., Williams, L., Berry, E., Izadi, S., Srinivasan,
J., Butler, A., Smyth, G., Kapur, N., and Wood, K.
(2006). Sensecam: A retrospective memory aid. Ubi-
Comp: Ubiquitous Computing, pages 177–193.
Kuli´c, D., Takano, W., and Nakamura, Y. (2011). Towards
lifelong learning and organization of whole body mo-
tion patterns. In Robotics Research, pages 87–97.
Springer.
Meng, J., Juan, Y., and Chang, S.-F. (1995). Scene change
detection in an mpeg-compressed video sequence. In
IS&T/SPIE’s Symposium on Electronic Imaging: Sci-
ence & Technology, pages 14–25. International Soci-
ety for Optics and Photonics.
Noris, B., Barker, M., Nadel, J., Hentsch, F., Ansermet, F.,
and Billard, A. (2011). Measuring gaze of children
with autism spectrum disorders in naturalistic interac-
tions. In International Conference of Engineering in
Medicine and Biology Society (EMBC), pages 5356–
5359. IEEE.
Wagner, J., Kim, J., and Andr´e, E. (2005). From physiologi-
cal signals to emotions: Implementing and comparing
selected methods for feature extraction and classifica-
tion. In International Conference on Multimedia and
Expo, pages 940–943. IEEE.
Wang, P. and Smeaton, A. F. (2012). Semantics-based selec-
tion of everyday concepts in visual lifelogging. Inter-
national Journal of Multimedia Information Retrieval,
1(2):87–101.
Yang, C. K. and Cheng, S. C. (2012). A novel algorithm for
key frames selection. Applied Mechanics and Materi-
als, 182:2025–2029.
Zhu, C., Wen, F., and Sun, J. (2011). A rank-order distance
based clustering algorithm for face tagging. In IEEE
Conference on Computer Vision and Pattern Recogni-
tion (CVPR), pages 481–488. IEEE.
VISAPP2014-InternationalConferenceonComputerVisionTheoryandApplications
624
