
Towards a Large Integrated Model of Signal Transduction and Gene
Regulation Events in Mammalian Cells
Liam G. Fearnley
1
, Mark A. Ragan
2
and Lars K. Nielsen
1
1
Australian Institute for Bioengineering and Nanotechnology, The University of Queensland, Brisbane, Australia
2
Institute for Molecular Bioscience, The University of Queensland, Brisbane, Australia
Keywords:
Signal Transduction, Transcription, Translation, Modelling, Large Scale Models.
Abstract:
Recent work has generated whole-cell and whole-process models capable of predicting phenotype in simple
organisms. The approaches used are hindered in higher organisms and more-complex cells by a lack of kinetic
parameters for reactions and events, and the difficulty of measuring and estimating these. Here, we outline a
large, two-process model capable of predicting the effects of gene expression on a signal transduction network.
Our method models signal transduction and the processes involved in gene expression as two separate systems,
solved iteratively. We show that this approach is sufficient to capture functionally significant behaviour result-
ing from common network motifs. We further demonstrate that our method is scalable and efficient to the size
of the largest signal transduction databases currently available. This approach enables analysis and prediction
in the absence of kinetic data, but is itself held back by the lack of detailed large-scale gene expression models.
However, research consortia such as ENCODE and FANTOM are rapidly adding to the knowledge of tran-
scriptional regulation, and we anticipate that incorporating this data into our regulatory model could allow the
modelling of complex cellular phenomena such as the structured progression seen in cellular differentiation.
1 INTRODUCTION
The recent development of the first computational
model of an entire cell was a watershed moment in
computational biology. This model simulated indi-
vidual processes within a cell using detailed kinetic
models, integrating and updating the points at which
they interacted at discrete time intervals (Karr et al.,
2012). However, such an approach is currently lim-
ited to small organisms such as Mycobacterium gen-
italium for one major reason — data describing re-
action dynamics are simply not available for the vast
majority of processes, and measuring or estimating
these parameters is practically impossible in more-
complex cells.
In higher organisms, computational models of
signal transduction have been successfully used to
predict in vivo phenotype and signalling activity in
individual signalling pathways, including T-cell re-
ceptor signalling (Saez-Rodriguez et al., 2007), and
Wnt/MAPK signalling (Handorf and Klipp, 2012),
EGFR/ErbB signalling (Samaga et al., 2009), and
Wnt/β-catenin signalling (Kofahl and Wolf, 2010)..
With up to 500 participant entities, these models rep-
resent a relatively small fraction of the data held in
rapidly expanding, community-curated databases of
signal transduction. The Reactome database already
covers more than 7500 participants (Matthews et al.,
2008), and contains approximately 20% of proteins
annotated as signal transducers in the Gene Ontology
(via DAVID (Huang et al., 2009) analysis).
Most signal transduction models are time-
parameterized (i.e., contain some estimate of how fast
a given event proceeds). These models (e.g. (Chen
et al., 2009)) use ordinary differential equations to
represent simple three-parameter (initial species con-
centration, forward rate constant, reverse rate con-
stant) models of kinetics, with estimated and fitted
values. Due to the previously discussed lack of mea-
sured reaction dynamics and kinetics, using such a
technique to model the Reactome network would re-
quire the elucidation of at least 11,600 thermody-
namic and kinetic constants and additional param-
eters in each experimental system. Even using a
vastly simpler model, such as a Boolean system with
priority classes and/or reaction timinings(e.g. (Saez-
Rodriguez et al., 2007)) requires the fitting of thou-
sands of parameters and implicit comparison of sev-
eral million pairs of reaction rates. Direct measure-
ments to determine this number of parameters is not
117
G. Fearnley L., A. Ragan M. and K. Nielsen L..
Towards a Large Integrated Model of Signal Transduction and Gene Regulation Events in Mammalian Cells.
DOI: 10.5220/0004739601170122
In Proceedings of the International Conference on Bioinformatics Models, Methods and Algorithms (BIOINFORMATICS-2014), pages 117-122
ISBN: 978-989-758-012-3
Copyright
c
2014 SCITEPRESS (Science and Technology Publications, Lda.)
feasible using current technology. As a result, statisti-
cal techniques have been developed (Heinrich et al.,
2002) to estimate and fit models to observed data,
however the attendant risk of statistical over-fit and
over-parameterisation present significant problems at
scale.
As an alternative, time-invariant models of signal
transduction have been proposed (e.g. (Haus et al.,
2009)). These are composed of a set of partic-
ipant entities and their interactions represented as
Boolean variables and statements respectively, with
no reaction timings. It has been shown that such
models are capable of modelling systems at sizes
equivalent to the largest current signal transduction
databases (Fearnley and Nielsen, 2012). However,
signal transduction produces activated transcription
factors which control gene expression. This includes
the expression of signals and components of the sig-
nal transduction system itself. Indeed, many impor-
tant biological phenomena can be captured only by
combined transduction-transcription models, includ-
ing gene-level feedback control (e.g., SOCS in the
JAK-STAT pathway (Naka et al., 1997)) and cellular
differentiation (where new signals and components of
the transduction system are unveiled gradually over
time).
In this study, we explored a simplified model that
captures both transduction and transcription without
requiring parameterisation, guided by the insight that
signal transduction occurs on a relatively fast time-
scale (seconds or tens of seconds) compared to the
processes of transcription and translation (tens of
minutes). We demonstrate that our technique can
handle common regulatory circuits without the need
for any parameterisation, and further show its com-
putational tractability with increases in model size of
the scale needed to deal with transcription data aris-
ing from projects such as ENCODE (The ENCODE
Project Consortium, 2011). In doing so, we demon-
strate one possible mechanism for dealing with the
challenge of parameterisation.
2 METHODOLOGY
2.1 Formulation of a Sequentially
Integrated Model
Our modelling approach splits the processes of sig-
nal transduction and gene expression into two repeat-
ing stages which are modelled sequentially and sepa-
rately by first obtaining a signal transduction network
state, then determining resulting changes to gene ex-
Integrated Model
Signal Transduction
(PATHLOGIC-S)
Transcriptional
Update Rules
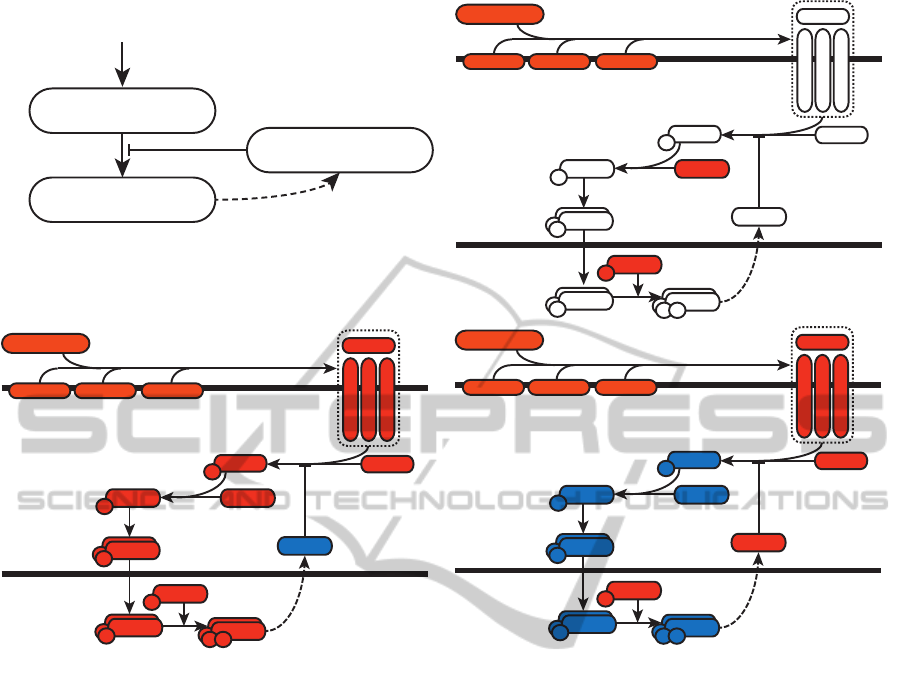
Figure 1: Overview of the sequentially integrated model. A
signal transduction model with relevant experimental condi-
tions is instantiated from a database and solved. This state
is then fixed, and the activities of transcription factors in
this state are passed to the transcription update rules. These
rules are applied, generating a list of states of transcription-
ally regulated proteins, feeding into a new instance of the
signal transduction model, which is solved prior to reappli-
cation of transcriptional update rules. This process repeats
until some termination criteria is reached.
pression. These changes are then re-applied to the
signalling system (Figure 1). Each of the two sub-
models is assumed to be time-invariant(i.e. the events
occur synchronously).
2.2 Signal Transduction Model
We begin by intialising the signal transduction model
with prior knowledge about network state (such as the
presence or absence of certain proteins or complexes
under some condition), and then simulate signalling
(using the PATHLOGIC-S specification (Fearnleyand
Nielsen, 2012)), obtaining a stable state. This model
is built using databases with data available in BioPAX
Level 3 (BioPAX Consortium, 2006) format. These
data are converted into systems of logical statements
for each signal in the data as described in (Fearnley
and Nielsen, 2012). These statements take the general
form:
_
¬inhibitors∨
^
activators → event (1)
_
event →
^
signal (2)
BIOINFORMATICS2014-InternationalConferenceonBioinformaticsModels,MethodsandAlgorithms
118
This system of statements can then be convertedinto a
set of constraints for use with an integer programming
solver (Haus et al., 2009), with a user-specified objec-
tive function (here, we use a function that maximises
the number of active signal transduction events). The
initial state of entities within the network is set from
user input (and may be partially specified). The in-
teger programming problem is then solved to provide
the initial network state, s
i
.
2.3 Transcription and Translation
Model
After the state of the signal transduction system, s
i
,
is fixed, the observed transcription factor activity is
transferred to the transcription model (a set of tran-
scriptional update rules). Current models of gene
regulation are insufficiently detailed (e.g. lack infor-
mation about the post-translational modifications re-
quired to ‘activate’ a transcription factor) for integra-
tion to the signal transduction system. We derived
a simple model from the BioPAX Level 3 data, not-
ing that a more-complex model (i.e. from a genetic
regulatory network inference tool) could be used its
place. In this, a set of update rules for each protein
under transcriptional control is derived and evaluated
by summing the activities of its inhibitors and pro-
moters:
activity =
1 if
∑
promoters
−
∑
inhibitors
> 0
0 else
(3)
A new instance of the signal transduction problem
s
i+1
is instantiated as previously described. Once the
transcription and translation update rules have been
applied, s
i+1
is solved to determine a successor state
s
i+2
, and the process repeats until a termination condi-
tion is met. The first termination condition used is full
network oscillation, i.e. whether a state has been pre-
viously encountered. If it has, the process terminates
as an oscillation has been detected. Alternatively, the
process can be terminated at a user-defined number of
steps to prevent runaway computations.
3 PRELIMINARY RESULTS
The signal transduction sub-model predicts the re-
sult of signal stimuli using the largest available reac-
tion systems. The prediction generated by this sub-
model is analogous to a long-exposure view of the
state of signals in the system, showing the net ac-
tivity over each process’ assigned time period. We
model transcription and translation using state update
a)
b)
c)
d)
ERα
Estrogen TFF1Complement C3
Estrogen-ERα Estrogen-ERα
homodimer
ERα
Estrogen TFF1Complement C3
Estrogen-ERα Estrogen-ERα
homodimer
ERα
Estrogen TFF1Complement C3
Estrogen-ERα Estrogen-ERα
homodimer
ERα
Estrogen TFF1Complement C3
Estrogen-ERα Estrogen-ERα
homodimer
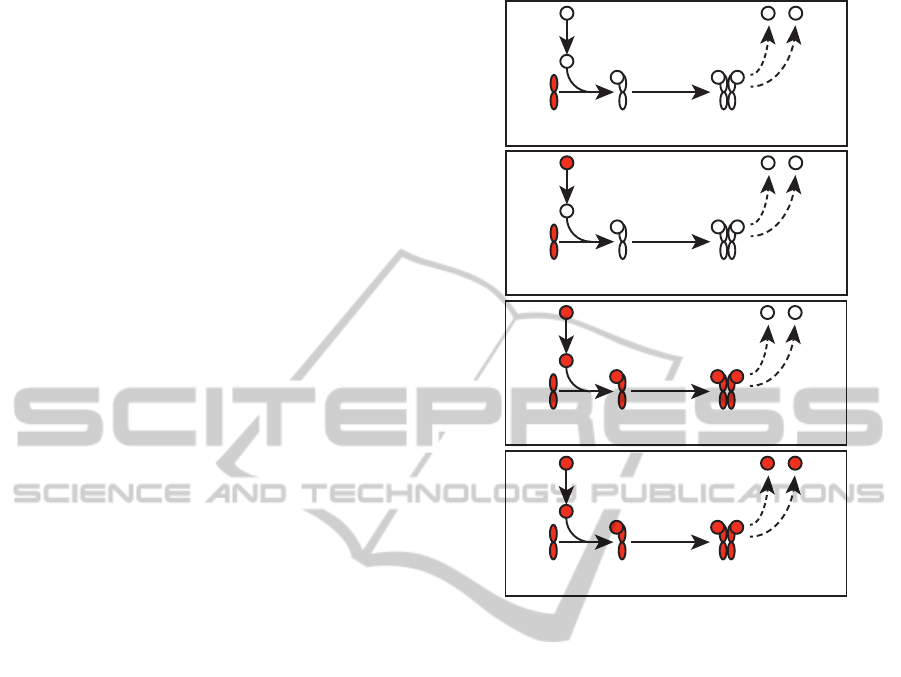
Figure 2: Estrogen binds dimerised estrogen receptor,
which promotes transcription of TFF1 and C3 in this sub-
network of the broader signal transduction dataset. Tran-
scription shown as a dashed line. 2a shows the initial state
of the signalling model, with presence of estrogen receptor.
2b shows introduction of estrogen to the system, and 2c sig-
nal transduction following state 2b. This consists of binding
of estrogen to estrogen receptor α and subsequent dimeri-
sation. 2d shows the result of transcriptional update —
estrogen-receptor complex promotes transcription of TFF1
and C3 (resulting signalling activity not shown).
rules analogous to those used in Boolean GRNs (de
Jong, 2002). We evaluated the effectiveness of this
approach on two key network behaviours — that of
subnetwork activation, and that of the transcription-
ally mediated feedback loop. Further, we tested to
see whether the approach was scalable to the size of
large databases of signal transduction.
3.1 Subnetwork Activation
The estrogen nuclear receptor signalling system is
well-characterised, having been implicated in a num-
ber of cancer types (Schwartz et al., 2005; Keen and
Davidson, 2003). We consider a subnetwork of a val-
idated estrogen receptor alpha (ERα) network (NCI-
Nature Pathway Interaction Database, 2012) cover-
ing the regulation of transcription of trefoil factor 1
TowardsaLargeIntegratedModelofSignalTransductionandGeneRegulationEventsinMammalianCells
119

(TFF1, UniProt:P04155) and complement C3 (C3,
UniProt:P01024) by estrogen bound to ERα (Fig-
ure 2). Simulation requires the establishment of the
initial network state and introduction of stimulus.
Subequent signal transduction is predicted and a sta-
ble state is reached, involving the activation of a tran-
scription factor that enables signalling through a pre-
viously inaccessible set of reactions (Figure 2).
3.2 Feedback Mechanisms
A more-complex case occurs in the form of tran-
scriptionally mediated negative feedback. This oc-
curs when a transcription factor causes production of
a protein that inhibits its own activation (Figure 3a).
The resulting oscillation in transcription factor activ-
ity is similar to that in negative feedback in signal
transduction (when not transcriptionally mediated),
but over a much longer time interval.
An example of negative feedback of the type de-
scribed in Figure 3a is encountered in the set of seven
interactions described in the interleukin signalling
pathway from the Panther Pathways database (Pan-
ther Pathways, 2012) (Figure 3b). Interleukin bound
to its receptors and a signalling subunit catalyse the
phosphorylation of members of the JAK family (In-
terPro:IPR016251), which in turn catalyse the phos-
phorylation of members of the STAT protein fam-
ily (InterPro:IPR001217). These events result in the
transcription of several protein families, including
members of the SOCS family (InterPro:IPR022252).
SOCS proteins inhibit JAK-mediated phosphoryla-
tion of STAT (as mediated by JAK) (Levy and Dar-
nell, 2002).
We initialise our model with the presence of JAK
and STAT in the cytoplasm, phosphorylated ERK in
the nucleus, and the proteins required for formation
of the interleukin-receptor complex (Figure 3b). The
initial signalling network solution yields the expected
activation of dimeric diphosphorylated STAT in the
nucleus (Figure 3c), which triggers the transcription
rule that activates SOCS transcription. The presence
of SOCS then inhibits the phosphorylation of STAT,
resulting in the inactivation of STAT-mediated sig-
nalling (Figure 3d). This in turn results in the absence
of diphosphorylated STAT, which deactivates trans-
lation of SOCS. This behaviour is predicted by our
modelling approach in the form of an oscillation be-
tween solutions equivalent to the signalling network
network states (Figure 3c and 3d).
The levels of SOCS protein expression have been
experimentally characterised over a period of 5.25
hours (Yoshiura et al., 2007) in a population of syn-
chronized C3H10T1/2 mouse fibroblast cells. The
Boolean model predicts regular, periodic oscillation
between high and low levels of SOCS family pro-
tein, which is observed experimentally with a peri-
odicity close to that implied by the model. The model
we used is untrained and does not require the exten-
sive parameter estimation necessary for an equivalent
ODE-based model. It should, however, be noted that
experimentally observed SOCS concentrations in the
model system also display a trend towards an overall
increase over time. Our modelling approach cannot
predict this due to the discretisation of signal concen-
trations into ’present’ and ’absent’ states inherent in a
Boolean representation.
3.3 Performance and Scalability
This approach can be used on both small and large
datasets. In the case of the ERα network and the
JAK-STAT-SOCS negative feedback mechanism, the
time required for computation to meet termination
criteria was on the order of 2-6 milliseconds. It
has been shown that the underlying method of sig-
nal transduction modelling (PATHLOGIC-S) is ca-
pable of efficiently enumerating network states for
very large networks such as Reactome (Fearnley and
Nielsen, 2012). We used randomly generated tran-
scription update rules in order to test the feasibility of
using our modelling approach with large systems (in
the absence of sufficiently large regulatory networks).
These rules consisted of assignment of between 0-
10 targets to known human transcription factors in
the system. We generated 50 such random assign-
ments, and obtained an average step execution time
(that taken for one signal transduction computation
and one application of update rules) of 6.3 seconds
on a standard desktop computer.
4 DISCUSSION
The difficulty of using and interpreting information
describing signal transduction events increases with
the amount of detail available. The recent rise and
expansion of large-scale, single-database repositories
of data such as Reactome, Panther, PID, and Path-
way Commons has driven the development of large-
scale signal transduction models an order of mag-
nitude larger than their precursors. However, these
models are incapable of modelling interesting biolog-
ical phenomena dependent on the interactions of other
processes (such as gene expression) with the signal
transduction system.
The development of methods that periodically in-
tegrate multiple process models have enabled the
BIOINFORMATICS2014-InternationalConferenceonBioinformaticsModels,MethodsandAlgorithms
120
a)
Activator
Transcription Factor
Inhibitor
Interleukin
JAK
p
STAT
SOCS
Cytosol
Nucleus
b)
Receptor Subunits
JAK
Interleukin-Receptor
Complex
STAT
p
STAT
p
STAT
p
STAT
p
STAT
p
STAT
p
STAT
p p
ERK
p
Interleukin
JAK
p
STAT
SOCS
Cytosol
Nucleus
b)
Receptor Subunits
JAK
Interleukin-Receptor
Complex
STAT
p
ERK
p
p
STAT
p
STAT
p
STAT
p
STAT
p
STAT
p
STAT
p
Interleukin
JAK
p
STAT
SOCS
Cytosol
Nucleus
b)
Receptor Subunits
JAK
Interleukin-Receptor
Complex
STAT
p
ERK
p
p
STAT
p
STAT
p
STAT
p
STAT
p
STAT
p
STAT
p
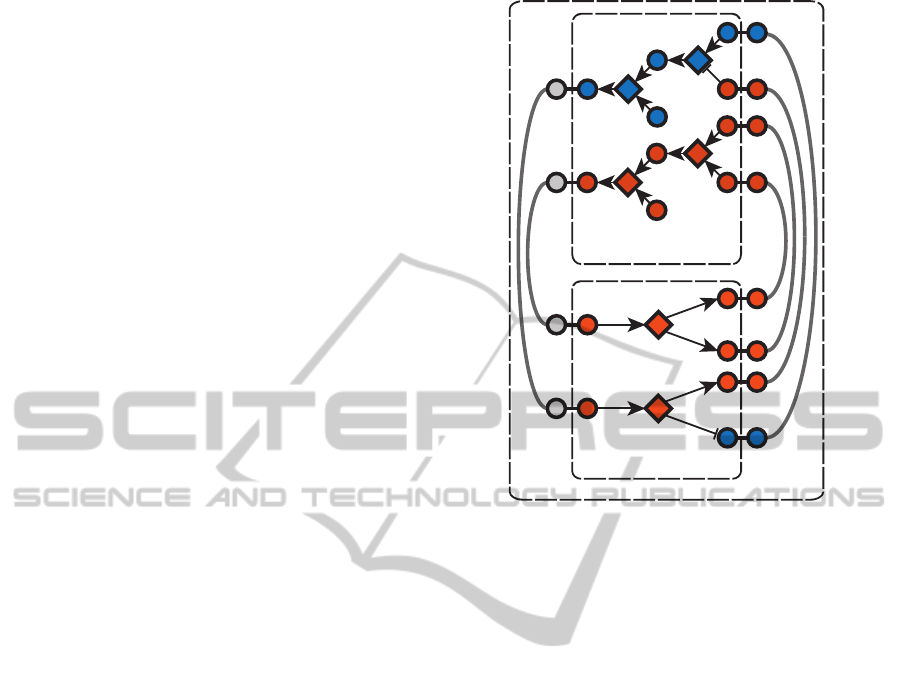
Figure 3: The general form of a transcriptionally mediated negative feedback loop consists of a transcription factor that
controls expression of an inhibitor of its own activation 3a. Vermilion species are currently active, blue are inactive, and
no state is assigned when the node background is white. ATP and ADP states not shown. 3b describes network topology
and initial conditions for the solver (Panther Pathways, 2012). 3c shows the initial solution prior to incorporation of the
transcriptional effect of diphosphorylated STAT (the dashed line, which represents STAT acting as a promoter for SOCS
transcription). 3d shows the second solution of the network following transcription. The system oscillates between 3c and 3d
as the activity of diphosphorylated STAT is toggled by the negative feedback loop.
modeling of entire simple organisms. Such methods
hold great promise, but are hindered by a lack of avail-
able reaction kinetic data and the difficulty inherent in
fitting or measuring these. Here we describe a method
that uses a broad estimate of the kinetics of entire pro-
cesses (ie, the time taken to reach a stable state in a
system of biochemical reactions) rather than that of
their components in order to predict phenotype, with
promising initial results.
There are two assumptions inherent with this tech-
nique. Firstly, there is an assumption that the post-
translational modifications in the signal transduction
system reach a stable state in a time-scale an order
of magnitude faster than the process of gene expres-
sion. Secondly, it assumes that the combined pro-
cesses of gene expression and signal transduction can
be approximated as occurring asynchronously given
two individual process models that are synchronously
updated (albiet over a period of time, to some stable
state). The extent to which these assumptions hold
at the scale of a large scale experimental system is
uncertain, and will require significant ongoing valida-
tion and refinement. As more data about the kinetics
of these events becomes available, we anticipate the
transformation of the model into a set of sub-process
models of varying granularity and size, eventually be-
coming a system of ODEs as the kinetic landscape is
explored, following the example laid out in simpler
organisms (Karr et al., 2012).
For now, we have demonstrated that an approach
lacking any kinetic parameters bar the broadest ap-
proximation of entire processes is capable of captur-
ing the essence of oscillatory regulatory motifs such
as the STAT/SOCS negative feedback system, and
that the system is computationally tractable as the
size of the model increases. It is an open question
whether large-scale signal transduction models com-
bined with large-scale models of gene expression pro-
TowardsaLargeIntegratedModelofSignalTransductionandGeneRegulationEventsinMammalianCells
121

duce biologically meaningful results, due to the afore-
mentioned lack of gene expression data and models.
Datasets describing the activities of gene expression
are becoming available as projects such as ENCODE
and FANTOM5 begin to publish results. We antici-
pate that once such data are available, our model for-
mulation may be used to simulate cellular-scale sig-
nal transduction over time. We hypothesise that the
sequential, synchronised predictions of gene expres-
sion that our modelling technique generates will map
to the structured progression seen in differentiating
cells, and prove a valuable explanatory and predictive
tool in such contexts.
REFERENCES
BioPAX Consortium (2006). BioPAX: Biological pathways
exchange. Available online at http://www.biopax.org.
Retrieved June 2011.
Chen, W. W., Schoeberl, B., Jasper, P. J., Niepel, M.,
Nielsen, U. B., Lauffenburger, D. A., and Sorger,
P. K. (2009). Input-output behavior of ErbB signaling
pathways as revealed by a mass action model trained
against dynamic data. Mol. Syst. Biol., 5:239.
de Jong, H. (2002). Modeling and simulation of genetic
regulatory systems: a literature review. J. Comput.
Biol., 9(1):67–103.
Fearnley, L. G. and Nielsen, L. K. (2012). PATHLOGIC-S:
a scalable Boolean framework for modelling cellular
signalling. PLoS One, 7(8):e41977.
Handorf, T. and Klipp, E. (2012). Modeling mechanistic
biological networks: an advanced boolean approach.
Bioinformatics, 28(4):557–563.
Haus, U.-U., Niermann, K., Truemper, K., and Weisman-
tel, R. (2009). Logic integer programming models for
signaling networks. J. Comput. Biol., 16(5):725–743.
Heinrich, R., Neel, B. G., and Rapoport, T. A. (2002).
Mathematical models of protein kinase signal trans-
duction. Mol. Cell, 9(5):957–970.
Huang, D. W., Sherman, B. T., and Lempicki, R. A. (2009).
Systematic and integrative analysis of large gene lists
using david bioinformatics resources. Nat. Protoc.,
4(1):44–57.
Karr, J., Sanghvi, J., Macklin, D., Gutschow, M., Jacobs, J.,
Bolival, B., Assad-Garcia, N., Glass, J., and Covert,
M. (2012). A whole-cell computational model pre-
dicts phenotype from genotype.
Keen, J. C. and Davidson, N. E. (2003). The biology of
breast carcinoma. Cancer, 97(3 Suppl):825–833.
Kofahl, B. and Wolf, J. (2010). Mathematical modelling
of Wnt/β-catenin signalling. Biochem. Soc. Trans.,
38(5):1281–1285.
Levy, D. E. and Darnell, J. E. (2002). STATs: transcrip-
tional control and biological impact. Nat. Rev. Mol.
Cell Biol., 3(9):651–662.
Matthews, L., Gopinath, G., Gillespie, M., Caudy, M.,
Croft, D., de Bono, B., Garapati, P., Hemish, J., Herm-
jakob, H., Jassal, B., Kanapin, A., Lewis, S., Mahajan,
S., May, B., Schmidt, E., Vastrik, I., Wu, G., Birney,
E., Stein, L., and D’Eustachio, P. (2008). Reactome
knowledgebase of biological pathways and processes.
Nucleic Acids Res., 37:D619–22. PMID: 18981052.
Naka, T., Narazaki, M., Hirata, M., Matsumoto, T., Mi-
namoto, S., Aono, A., Nishimoto, N., Kajita, T., Taga,
T., Yoshizaki, K., Akira, S., and Kishimoto, T. (1997).
Structure and function of a new STAT-induced STAT
inhibitor. Nature, 387(6636):924–929.
NCI-Nature Pathway Interaction Database (2012). Vali-
dated estrogen receptor alpha network.
Panther Pathways (2012). Interleukin signaling pathway.
Retrieved December, 2012.
Saez-Rodriguez, J., Simeoni, L., Lindquist, J. A., Hemen-
way, R., Bommhardt, U., Arndt, B., Haus, U.-
U., Weismantel, R., Gilles, E. D., Klamt, S., and
Schraven, B. (2007). A logical model provides in-
sights into T-cell receptor signaling. PLoS Comput.
Biol., 3(8):e163.
Samaga, R., Saez-Rodriguez, J., Alexopoulos, L. G.,
Sorger, P. K., and Klamt, S. (2009). The logic
of EGFR/ErbB signaling: theoretical properties and
analysis of high-throughput data. PLoS Comput. Biol.,
5(8):e1000438.
Schwartz, A. G., Prysak, G. M., Murphy, V., Lonardo, F.,
Pass, H., Schwartz, J., and Brooks, S. (2005). Nu-
clear estrogen receptor beta in lung cancer: expression
and survival differences by sex. Clin. Cancer Res.,
11(20):7280–7287.
The ENCODE Project Consortium (2011). A user’s guide
to the Encyclopedia of DNA Elements (ENCODE).
PLoS Biol., 9(4):e1001046.
Yoshiura, S., Ohtsuka, T., Takenaka, Y., Nagahara, H.,
Yoshikawa, K., and Kageyama, R. (2007). Ultradian
oscillations of Stat, Smad, and Hes1 expression in re-
sponse to serum. PNAS, 104(27):11292–11297.
BIOINFORMATICS2014-InternationalConferenceonBioinformaticsModels,MethodsandAlgorithms
122
