
Signal Quality in Dry Electrode EEG and the Relation to
Skin-electrode Contact Impedance Magnitude
Alexandra-Maria T
˘
aut¸an
1
, Vojkan Mihajlovi
´
c
2
, Yun-Hsuan Chen
3
, Bernard Grundlehner
2
,
Julien Penders
2
and Wouter Serdijn
1
1
Faculty of Electrical Engineering M & CS, Delft University of Technology, Mekelweg 4, 2628 CD Delft, The Netherlands
2
Holst Centre / imec-nl, 5656 AE Eindhoven, The Netherlands
3
imec, Kapeldreef 75, 3001 Leuven, Belgium
Keywords:
EEG, Dry Electrodes, Gel Electrodes, Signal Quality, Evaluation Framework, SSVEPs, Skin-electrode
Contact Impedance, SNR, Correlations, Coherence.
Abstract:
Current EEG research approaches are focusing on developing new dry electrode EEG (electroencephalogram)
systems providing a high enough signal quality for a wide range of applications. This study proposes several
parameters for evaluating signal quality of dry electrodes and relates the results to skin-electrode contact
impedance magnitude values. The EEG recordings of a Ag/AgCl pinned electrode and a flexible polymer
pinned electrode are evaluated through a comparison to conductive gel electrode recordings. The experimental
setup was made up of two EEG acquisition systems connected in parallel. The protocol included open eyes,
closed eyes and steady-state visually evoked potentials (SSVEP) sessions in both seated and walking in place
conditions. The parameters used for evaluation were signal correlations, signal coherence and signal-to-noise
ratios (SNRs). Results showed that the three proposed parameters provided equivalent outcome for signal
quality estimation for the same recordings. There was no relation reported between the defined signal quality
and the skin-electrode contact impedance in either dry or gel electrodes, although high impedance variations
were present among subjects. However, larger impedance magnitude and impedance magnitude variations,
and lower signal quality is observed for dry electrodes compared to gel ones.
1 INTRODUCTION
Research in the field of medical technology is
currently focusing on developing devices that
can facilitate disease prevention and remote
monitoring for an easier, more successful patient
treatment, while also reducing costs. Due to its
non-invasive nature and high temporal resolution,
scalp electroencephalographic signals (EEGs)
have good prospects for many applications.
Electrical activity of the brain can be useful in
the diagnosis and monitoring of several neurological
conditions, including the detection of epileptic
seizures, diagnosis of sleep disorders or stroke
rehabilitation (Teplan, 2002). Other applications
include brain computer interfaces (BCIs) used either
in rehabilitation of impaired individuals or for
communication with locked in patients (Minguez
et al., 2009), cognitive enhancement trainings
for ADHD (Moriyama et al., 2012), and remote
monitoring of drivers (Lin et al., 2005).
Currently available EEG technologies are mostly
used in controlled research and clinical environments.
One of the biggest limitation comes from the
electrodes used to obtain good signal quality. A
widely accepted method of acquiring high quality
EEG signals is through conductive gel electrodes and
involves skin preparation. Skin preparation includes
skin abrasion and cleansing to remove dead cells from
the top layer of the epidermis, causing a decrease
in the skin-electrode contact impedance. After this
step, the electrodes with conductive gel are applied.
This procedure is cumbersome, uncomfortable and
can be painful for the patient. If proper care is not
taken, adjacent electrodes might get short circuited
in high electrode density montages. Moreover, the
conductive paste might dry over time, increasing
the skin-electrode contact impedance. Therefore, to
ensure proper EEG recordings, a trained technician
is required for both gel electrode application and for
maintenance throughout the entire measurement.
Several research groups are focusing on
12
Tautan A., Mihajlovic V., Chen Y., Grundlehner B., Penders J. and Serdijn W..
Signal Quality in Dry Electrode EEG and the Relation to Skin-electrode Contact Impedance Magnitude.
DOI: 10.5220/0004738700120022
In Proceedings of the International Conference on Biomedical Electronics and Devices (BIODEVICES-2014), pages 12-22
ISBN: 978-989-758-013-0
Copyright
c
2014 SCITEPRESS (Science and Technology Publications, Lda.)

improving dry sensor technologies to develop a
more practical, easy-to-use, EEG measurement
system. Although several types of dry electrodes
are already commercially available, EEG users
and clinicians are reluctant to adopt them in their
regular practices as the lack of conductive gel
implies a higher skin-electrode contact impedance
and makes the recordings more susceptible to noise
and interference. To this day, the quality of these
electrode types has not been proven to reach that of
the standard gel electrodes. Hence, there is a need
to develop a method of testing the quality of the
signal obtained from the newly designed biomedical
sensors.
A literature survey on the available state-of-the-art
EEG signal quality evaluation methods revealed that
several protocols are available but there is no clear
consensus on the best evaluation procedure (T
˘
aut¸an
et al., 2013). The lack of agreement on what high
EEG signal quality means comes from the fact that
different applications require high quality in different
aspects of the EEG signal, i.e., a signal that provides
good performance in BCIs might prove insufficient
for clinical diagnosis. A general purpose evaluation
framework should take into account as many signal
features as possible, from the time, frequency and
spatial domain, to ensure a good quality for a wider
variety of applications.
Due to the temporal, spatial and subject variability
of the EEG signal, all procedures of evaluating dry
electrode recordings make use of a comparison to
gel electrode recordings through either a parallel
method (the two sensor types record concurrently)
or a serial method (the two sensor types record in
turn from the same scalp positions) (Ruffini et al.,
2008). Most encountered parameters for evaluating
EEG signal quality are dry-gel signal correlations
and comparisons of the power spectral densities
(Ruffini et al., 2008; Gargiulo et al., 2010; Estepp
et al., 2005). Other evaluation parameters include
signal-to-noise ratios of steady-state visually evoked
potentials (Chi et al., 2012) and deflection amplitudes
of P300 components of event related potentials
(ERPs) (Zander et al., 2011). Performance of the
electrodes in several applications, such as BCIs and
cognitive monitoring, are also used as an indication
of signal quality (Estepp et al., 2005; Gargiulo et al.,
2010; Sellers et al., 2009).
When using gel electrodes, it is generally
considered that the signal quality is good when
the impedance magnitude value measured is low
(typically below 5kΩ). Only one study found in
literature reported that EEG signal quality did not
modify when skin abrasion was not used and the
skin-electrode contact impedance reached values of
40kΩ (Ferree et al., 2001). However, it is not known
whether even higher impedance, or difference in
impedance among electrodes would result in a lower
signal quality. Also, to the best of our knowledge,
the relation between signal quality and skin-electrode
contact impedance is not addressed in the case of dry
electrodes. We believe that since the impedance is
much higher and since it can be quite different among
electrodes it can also be used to estimate the signal
quality obtained.
This paper builds on a previous study of EEG
signal quality evaluation (T
˘
aut¸an et al., 2013),
improving the experimental setup and incorporating
skin-electrode contact impedance measurements. In
our previous study, several parameters were defined
to characterize signal quality. The limitations we tried
to overcome in this evaluation are the accuracy of
the visual stimulation rendering, the synchronization
of the stimulation with the recordings and improper
contact of the electrodes with the scalp for some
subjects due to inadequate headset design. The
procedures used for signal quality evaluation include
open eyes, closed eyes and steady-state-visually
evoked potentials (SSVEPs) recordings performed
both while the participant is seated and walking.
The parameters defined to quantify signal quality
include: signal correlations, signal coherence and
signal-to-noise ratios.
The paper is organized as follows. The second
section describes the experimental setup, the protocol
and the data analysis methods. In the third
section, results are presented and discussed. Lastly,
conclusions are drawn and suggestions for further
research are presented.
2 METHODS
2.1 Experimental Setup
The materials used to build the experimental setup are
the following:
• 6 standard gel-filled Ag/AgCl cup electrodes
(10mm diameter) used as a reference system
• 4 BioPac EL120 Ag/AgCl dry pin electrodes
(10.2mm diameter with 12 pins of 1mm width)
used as test electrodes
• 4 conductive polymer electrodes with flexible pins
(13mm diameter with 15 pins of 1.2mm width)
used as test electrodes (Chen et al., 2013)
• wireless EEG headset used as rigid support for the
dry electrodes (Patki et al., 2012)
SignalQualityinDryElectrodeEEGandtheRelationtoSkin-electrodeContactImpedanceMagnitude
13

• EEG boxed system used for connecting the gel
electrodes (Mihajlovi
´
c et al., 2013)
• PC for recording and displaying visual
stimulation
This setup is consistent with that found in the
previous work: a parallel measurement system is
used to make a comparison between signals recorded
with dry and gel electrodes. Here, different tools
are used to incorporate impedance measurements
and to improve the shortcomings of the previous
setup by providing more accurate stimulation and
better synchronization. To prove the validity of
the developed evaluation framework, two types of
dry electrodes are tested: Ag/AgCl and polymer
electrodes.
2.1.1 Data Acquisition and Stimulation Display
EEG signals and impedance data are acquired
concurrently from dry and gel electrodes using
the EEG v2.0 wireless headset and boxed system,
respectively. These two systems include the same
electronics, ensuring that all signals are collected in
the same way. Each measurement system contains the
following: proprietary active electrodes, EEG analog
front-end application-specific integrated circuits
(ASIC) with an input impedance of 1.2 GΩ at 10Hz
and a built-in current generator, microcontroller,
radio and power management circuitry (Patki et al.,
2012).
These systems enable continuous skin-electrode
contact impedance monitoring per channel. This is
done by injecting a square wave current at a frequency
of 1024 Hz through the active electrode front ends
(Patki et al., 2012). The amplitude of the wave is set
manually by the operator for each subject according
to his/her skin characteristics and the electrodes
used. Typical values are 10nA, 20nA or 50nA.
Impedance magnitude is obtained by combining the
demodulated first harmonic of the in-phase and
quadrature components of the impedance signals.
The acquisition system is limited by the 5mV
dynamic range of the input amplifier. In order to keep
the acquired signal unattenuated, the maximum input
resistance is 500kΩ when the injected current is at the
minimum of 10nA.
Functions from the MatLab Psychtoolbox were
used to obtain accurate rendering of the SSVEP,
while taking into account the different processes
running in the background (Brainard, 1997). Since
both EEG systems communicate wirelessly to their
corresponding receivers, time synchronization is
performed in the software through a Matlab script.
The script handles the data packets received from both
systems and synchronizes them with respect to each
other and to the rendered stimuli.
2.1.2 Electrode Positions
As the framework aims at comparing dry and gel
sensors, the electrode arrangement is extremely
important. First, consistency in positioning must be
maintained between participants. Second, relevant
locations should be chosen according to the type of
information that needs to be obtained (from the type
of sensory information provided as stimuli). Third,
the EEG signal represents the summed activity of
millions of neurons and thus the spatial variability
introduced should be accounted for.
To this end, the electrode configuration is similar
to that presented by (Estepp et al., 2005). Two
groups of one dry electrode and two gel electrodes
were placed on the scalp of the participant on
the vertices of an equilateral triangle with a 2cm
edge (Fig. 1). The dry electrodes were positioned
using the EEG headset. They were centred at
the Cz and Pz positions of the standard 10-20
International Positioning system. The gel electrodes
were positioned with the help of metal markers.
Separate reference and ground electrodes are used
for the dry and gel systems to avoid any additional
differences introduced by the different skin-electrode
contact impedance. The two references are placed
close together behind the right ear, while the two
ground electrodes are located behind the left ear.
Comparisons are made between the dry test
electrode and one of the gel electrodes placed in its
vicinity. To give an estimate of the effects of spatial
variability, the same computations are made between
the two adjacent gel electrodes.
Figure 1: Electrode positioning system. The yellow circles
represent dry electrodes, whereas the blue circles are gel
electrodes.
BIODEVICES2014-InternationalConferenceonBiomedicalElectronicsandDevices
14

2.2 Protocol
Six subjects (all male) aged between 25 and 37 years
volunteered for participation in the experiment. After
being informed of the content of the experiment and
making sure that they do not present any skin allergies
or disorders triggered by oscillatory light stimuli,
participants signed a consent form. All of them
presented normal or corrected to normal sight.
The protocol was approved by the internal review
board of Holst Centre. The total experimentation
time per participant amounted to 60 minutes. The
participants were comfortably seated at a distance
of 50 cm from the LCD display where the visual
stimulation was presented. They were advised to
avoid movement as much as possible to reduce the
appearance of motion artifacts. First, the wireless
headset was equipped with the four Ag/AgCl dry
electrodes and was mounted on the head of the
participant. After that, the skin was abraded to
eliminate dead cells and the gel electrodes were
applied. The quality of the recordings was checked
by the operator through visual inspection of the
obtained signal. Also, setting the appropriate value
of the injected current such that the system can
perform reliable impedance measurement was done
by the operator. Then, the first recording stage was
performed. In the second stage, the Ag/AgCl dry
electrodes were replaced with the polymer electrodes
and the same protocol was repeated. The protocol
consisted of the following paradigms: continuous
recordings and SSVEP stimulation.
2.2.1 Continuous Recordings
Continuous EEG recordings are obtained from four
paradigms. In the first one, the participant had to
keep his/her eyes open for approximately 1 minute
(open eyes) while seated. In the second one, the
participant had to close his/her eyes for about 1
minute (closed eyes) while seated. For the last two
paradigms the subject performed the same two actions
while walking in place for about 1 minute.
2.2.2 SSVEP Stimulation
The stimulation in this case was a white flickering
square centered on a black screen. The stimulation
frequency was 4Hz. This value was chosen to have
the first harmonic of the response outside the alpha
range (8-13Hz) and so avoid interference. Subjects
had to observe the stimulation for approximately 1
minute in two conditions: once while seated (SSVEP
seated) and once while walking in place (SSVEP
walking).
2.3 Data Analysis
Data processing was performed in Matlab. In the
pre-processing stage, both the EEG and impedance
signals were band pass filtered between 2-30Hz. A
Chebyshev type II filter was applied forward and
backwards on the data to eliminate distortion (Acunzo
et al., 2012). Severe artifacts are removed from all
recordings. This is done manually by the operator
with the help of a thresholding algorithm based on the
standard deviation of the signal (T
˘
aut¸an et al., 2013).
The comparison of the dry and gel recordings
should provide information from both the time and
frequency domain. Thus, several parameters were
computed in both domains: signal correlations (time),
signal coherence (frequency) and SNR (frequency).
For validation of the framework, mean skin-electrode
contact impedance values are also reported and they
are compared to the signal quality obtained at each
electrode. This section presents the methods used for
defining and computing these parameters.
2.3.1 Signal Correlations
Pearson’s product moment correlations are used
to quantify the similarity between the dry and
wet recordings as they provide information on the
time coupling and wave morphology (Guevara and
Corsi-Cabrera, 1996). Correlation coefficients are
computed between dry-gel electrode pairs (1-5, 2-7)
and also between gel-gel pairs (5-6, 7-8) on the open
eyes and closed eyes recordings.
2.3.2 Signal Coherence
While signal correlations give an idea of the time
domain similarity of two signals, signal coherence
shows the stability of the similarity by looking at
the frequency content. They provide information on
the changes in power and phase of the signals with
respect to each other, disregarding signal polarity
(Guevara and Corsi-Cabrera, 1996). The coherence
function between the two signals is computed using
Welch’s method on a window of 1 second and with
a window overlap of 75%. The mean coherence is
computed over the band between 2-30Hz. Values are
obtained for the dry-gel pairs (1-5, 2-7) and for the
gel-gel pairs (5-6, 7-8) on the open eyes and closed
eyes recordings.
2.3.3 Signal-to-Noise Ratio
A signal-to-noise ratio (SNR) is defined to quantify
the level of contamination of the recordings observed
in the frequency spectrum. The alpha wave peaks and
SignalQualityinDryElectrodeEEGandtheRelationtoSkin-electrodeContactImpedanceMagnitude
15

Table 1: Mean correlation values across participants.
Cz Pz
Paradigm 1-5 1-6 5-6 2-7 2-8 7-8
Open eyes seated 0.77 0.75 0.93 0.71 0.70 0.91
Electrode A Closed eyes seated 0.82 0.81 0.97 0.80 0.78 0.94
Ag/AgCl Open eyes walking 0.27 0.29 0.78 0.30 0.32 0.83
Closed eyes walking 0.43 0.42 0.79 0.46 0.43 0.79
Open eyes seated 0.48 0.37 0.85 0.46 0.46 0.93
Electrode B Closed eyes seated 0.60 0.59 0.96 0.53 0.50 0.95
Polymer Open eyes walking 0.35 0.29 0.83 0.32 0.26 0.71
Closed eyes walking 0.50 0.41 0.80 0.44 0.24 0.65
the SSVEP responses are stronger when less noise
is present on the recordings and thus can be used to
estimate the difference in noise content of the dry and
gel electrode signals. Assuming that the noise signal
is proportional to the standard deviation of the signal
(Mihajlovi
´
c et al., 2012), the following definition is
proposed:
SNR =
mean(PSD
band o f interest
)
mean(PSD
signal band−band o f interest
)
(1)
The signal power is defined as the mean power
spectral density (PSD) in the band of interest, while
the noise power is the mean PSD outside this band.
For the closed eyes recordings, the band of interest
corresponds to the alpha band (8-13Hz) while for
the SSVEP recordings, it is between the following
intervals: 3-5, 7-9, 11-13, 15-17 corresponding to the
stimulation frequency and its harmonics. The PSD
of all recordings is computed with Welch’s spectrum
estimation method on a 1 second window with 75%
window overlap.
2.3.4 Impedance Value Analysis
For the analysis of the impedance data, the magnitude
is extracted from the in-phase and quadrature
components of the impedance signal by taking into
account the amplitude of the injected current. Mean
values and standard deviations are reported for all dry
and gel electrodes.
3 RESULTS
3.1 Signal Correlations
Mean correlation values across participants are
presented in Table 1, classified according to the
electrode types tested and the paradigms used for
recording. In the case of the Ag/AgCl test electrodes,
one participant was excluded due to improper contact
of the gel electrodes. For the polymer electrodes,
recordings on the Cz site of one participant, for
the walking paradigms, were excluded also due
to improper gel electrode contact. Additionally,
measurements with polymer electrodes could not be
performed on two of the subjects as the skin-electrode
contact impedance was higher than the limit imposed
by the amplifier. An example of the signals obtained
with different electrodes in seated and walking
conditions can be seen in Fig. 2a-d.
Gel-gel signal comparisons resulted in high values
for the correlation coefficients in the case of the seated
paradigms, indicating a strong similarity between the
recordings. These values are useful in estimating
the effect of spatial variability on the content of
the signal. Stronger correlations are reported when
the participants had their eyes closed, due to the
increased alpha activity. For the walking paradigms,
the coefficients decreased due to the motion artifacts
introduced and ranged between 0.65 to 0.83. Also,
differences in correlation for eyes closed and eyes
open conditions was not consistent.
Coefficients obtained for the dry-gel comparison
varied substantially with electrode type and paradigm.
Generally, they followed a decreasing trend, from
Cz to Pz electrodes and from closed eyes to open
eyes paradigms, in both the seated and walking cases.
This is consistent with literature (Estepp et al., 2009).
The computed values for the Ag/AgCl electrodes
were higher than those obtained in our previous
seated study. This is caused mainly by the use of
active electrodes designed to cope with higher input
impedance. The walking paradigms induced a more
drastic decrease in the dry-gel correlation values than
in the gel-gel ones, revealing a greater sensitivity of
dry electrodes to motion artifacts.
The polymer electrodes had a poorer performance
than the silver ones: in two cases signal acquisition
was not possible while the correlation coefficients
obtained were lower for the seated paradigms. For the
walking paradigms, the coefficients were in the same
BIODEVICES2014-InternationalConferenceonBiomedicalElectronicsandDevices
16

Table 2: Mean coherence values in the frequency band 2-30Hz across participants.
Cz Pz
Paradigm 1-5 1-6 5-6 2-7 2-8 7-8
Open eyes seated 0.54 0.51 0.84 0.50 0.49 0.77
Electrode A Closed eyes seated 0.59 0.55 0.86 0.54 0.54 0.77
Ag/AgCl Open eyes walking 0.12 0.11 0.70 0.16 0.15 0.64
Closed eyes walking 0.20 0.19 0.77 0.26 0.23 0.62
Open eyes seated 0.27 0.24 0.83 0.24 0.23 0.79
Electrode B Closed eyes seated 0.34 0.34 0.87 0.32 0.29 0.81
Polymer Open eyes walking 0.18 0.14 0.70 0.17 0.10 0.50
Closed eyes walking 0.24 0.18 0.71 0.23 0.11 0.46
Table 3: Mean SNR values in dB.
Cz Pz
Paradigm 1 5 6 2 7 8
Electrode A Closed eyes seated 7.80 7.98 7.58 8.72 9.87 10.14
Ag/AgCl Closed eyes walking 2.12 3.72 3.12 1.80 3.73 4.57
Electrode B Closed eyes seated 4.30 6.31 6.17 5.24 8.90 8.42
Polymer Closed eyes walking 1.90 2.15 1.55 1.91 2.24 4.52
range as for the Ag/AgCl electrodes. However, a
comparison of the behavior of the two electrodes with
respect to gel ones in motion recordings is difficult to
make since gel-gel correlations have also changed.
3.2 Signal Coherence
Table 2 reports the mean coherence values obtained
from the same recordings as those used for
determining signal correlations. Coherence values
are slightly lower than the correlation values. This
indicates power asymmetries between recordings
that could be caused by the different skin-electrode
contact impedance and its variation over time. It is
expected that the dry electrode impedance slightly
decreases over time as the contact with the skin
stabilizes and the signal settles, while the gel
electrode impedance increases over time due to the
drying of the gel.
Nevertheless, the results obtained follow the
same trends as those of the correlation computations.
Gel-gel comparisons present the highest values across
all paradigms. Dry-gel results are substantially lower
than the gel-gel ones and values decrease drastically
in the case of the walking paradigms. The artifacts
introduced through walking are superimposed
on the EEG signal, introducing new frequency
components in the recordings. Each electrode records
the additional interference differently due to the
differences in skin contacts as a result of motion.
The results confirm that gel electrodes are still
better when dealing with motion. Without the gel
to ensure adhesion, dry electrode recordings are
more susceptible to walking artifacts. Here as well,
Electrode A presents higher values than Electrode B.
3.3 SNR
Signal to noise ratios were computed on the closed
eyes and SSVEP paradigms while walking and seated.
The values obtained are summarized in Table 3 and
examples of spectra for the closed eyes paradigms are
shown in Fig. 2e-f. For the closed eyes paradigms, the
same recordings were excluded from the analysis as in
the case of correlation and coherence computations.
For the SSVEP, one subject was eliminated due to
improper gel contacts for the silver electrode and
for the polymer electrode, the same two subjects as
in the case of continuous recordings presented no
measurable signal.
The SNR values for the SSVEP paradigm were
not reported in Table 3 as they did not reflect the
observations made through the visual inspection of
the signals’ spectra. The visual stimulation frequency
was too low and thus the first harmonic of the
SSVEP response was superimposed on the strong low
frequency components present in the dry electrode
recordings. As the electrodes are distant from the
visual cortex, higher harmonics could be observed on
some of the recordings, however their intensity was
too low. Thus, no accurate distinction could be made
between the peaks of the specific cortical response
and the background EEG and noise.
As can be seen in Table 3, the SNRs of the closed
SignalQualityinDryElectrodeEEGandtheRelationtoSkin-electrodeContactImpedanceMagnitude
17
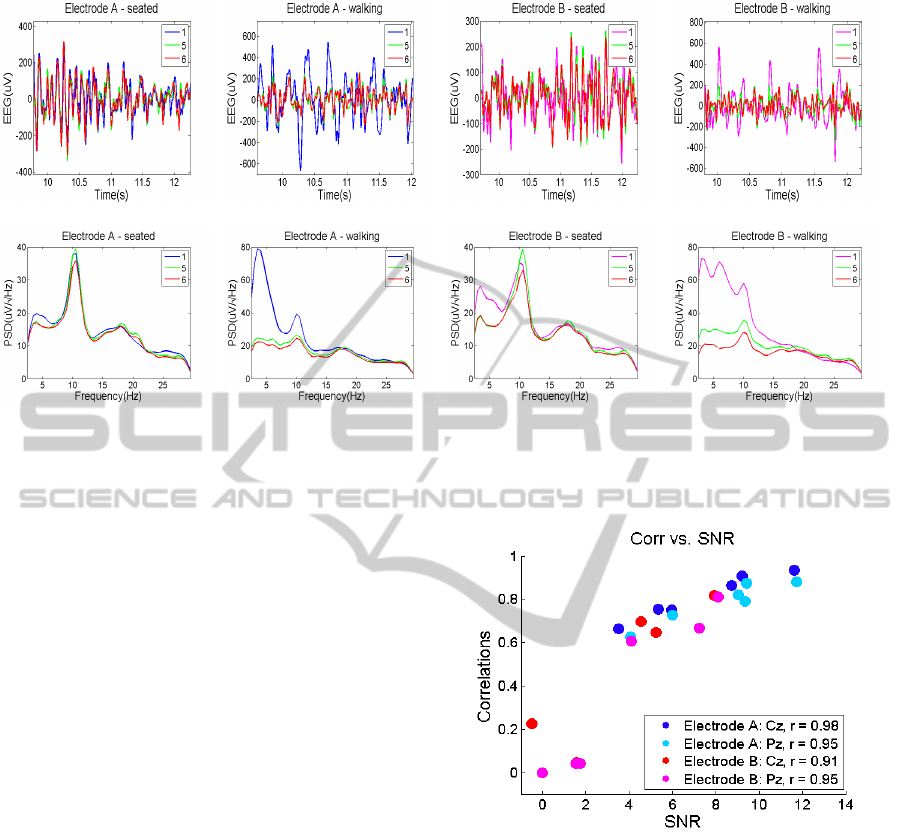
(a) (b) (c) (d)
(e) (f) (g) (h)
Figure 2: Closed eyes seated and walking recordings of Subject 1 for electrode 1 and 2 at the Cz position. First row presents
approximately 2 seconds of the time course of the EEGs while the second row shows the spectrum of the entire recordings.
For the legend, see Fig. 1 for the electrode position numbering.
eyes recordings were positive for all electrodes as
the alpha wave phenomena could be observed on the
spectra of both seated and walking recordings (see
Fig. 2e-f). Generally, the values obtained from the
parietal site are higher than those from the central
position. For the closed eyes seated paradigms,
the results for the gel electrodes are comparable
to those obtained in our previous study. The
Ag/AgCl electrodes exhibited higher SNRs mostly
due to the active electrodes used for acquisition.
Their performance is now comparable to that of gel
electrodes. The polymer electrodes presented higher
differences between the SNRs of dry electrodes and
of gel electrodes indicating a higher level of noise.
For the walking recordings, as expected, the
SNR values decrease. However, the alpha peak
can still be seen (Fig. 2f and Fig 2h). For
Electrode A, the walking spectra indicates strong low
frequency components introduced by the motions.
These components are not present on the spectra
of the corresponding gel recordings (Fig. 2f) or
on the spectra of the seated paradigm (Fig. 2e).
These observations are confirmed by the SNR values
reported, where a stronger difference exists between
the dry and gel SNRs for the walking paradigms than
for the seated ones. For Electrode B, the values
obtained are lower than those found for Electrode
A. A higher sensitivity to motion artifacts causes
stronger low frequency components that interfere
with the alpha response as their band extends over
10Hz (Fig. 2h).
Figure 3: Comparison of the Correlations and SNRs of dry
electrodes per subject for the closed eyes seated recording.
Fig. 3 shows a plot of the correlation values
obtained for all dry electrodes per subject versus
their corresponding SNR. Correlation coefficients
were computed to characterize the relationship
between the two variables. The r value for each
electrode is mentioned in the legend of Fig. 3. A
strong correlation exists between the two defined
parameters. Thus, the quality defined in the time
domain by the correlation coefficients is comparable
to the one defined in the frequency domain by the
SNR.
3.4 Impedance and Signal Quality
Table 4 summarizes the results obtained for the
BIODEVICES2014-InternationalConferenceonBiomedicalElectronicsandDevices
18
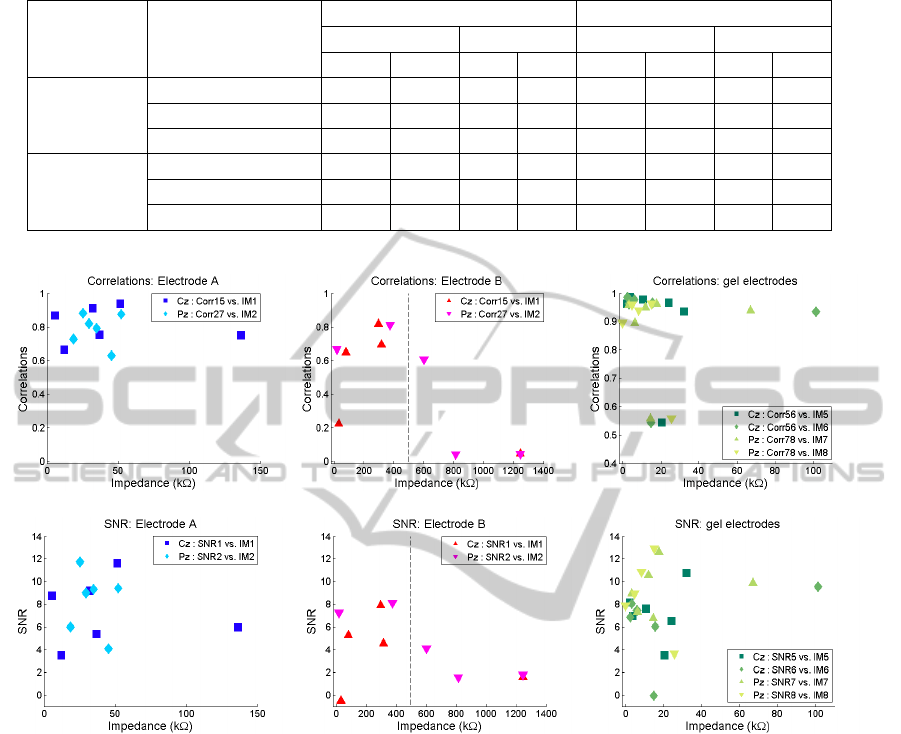
Table 4: Mean (M) and standard deviation (S) skin-electrode contact impedance values in kΩ.
Cz Pz
Paradigm 1 5 2 7
M S M S M S M S
Electrode 1 Open eyes seated 54.2 61.6 13.6 12.7 34.4 18.7 15.2 16.7
Ag/AgCl Closed eyes seated 47.8 52.9 14.6 13.0 37.6 11.2 21.3 26.2
SSVEP seated 56.4 48.1 26.7 31.4 40.3 16.1 26.9 35.5
Electrode 2 Closed eyes seated 212.4 147.1 29.5 21.9 530.0 43.8 23.9 19.5
Polymer Closed eyes seated 183.5 146.8 33.3 25.1 453.9 339.8 27.0 21.3
SSVEP seated 184.7 127.7 36.6 25.7 396.8 268.7 34.5 30.5
(a) (b) (c)
(d) (e) (f)
Figure 4: Comparison of parameters defining signal quality to skin-electrode contact impedance.
continuous impedance analysis. For each
measurement electrode, the average of the impedance
signal mean values across all included participants
and their corresponding standard deviation are
presented. The analysis was performed only on the
seated paradigms as the walking paradigms introduce
artifacts on the impedance signals which influence
the mean impedance value in an unpredictable
way. Results found for both dry electrode types
were greater than those of the gel electrodes. Gel
electrodes presented a minimum mean impedance
value of 13.6 kΩ and a maximum of 36.6 kΩ
both found for electrode 5 in the Cz position. The
Ag/AgCl electrodes had values ranging from 34.4 kΩ
in the Pz position to 56.4 kΩ in the Cz position, while
the polymer electrode impedance was larger, having a
minimum of 183.5kΩ at Cz and a maximum of 530.0
kΩ at Pz. The large discrepancies between the values
of the skin-electrode impedance of the same electrode
type at different locations might be connected to the
different contacts between the sensor and the scalp of
the participant. High standard deviations are reported
for all electrodes. This can be motivated by the
different skin properties of each participant and by
the differences in measurement conditions. However,
larger variations can be observed in the dry electrode
impedance values than in the gel ones.
A comparison between the parameters defined
for quantifying signal quality and the corresponding
skin-electrode contact impedance obtained is made in
Fig. 4. Correlations and SNR values of the ”test”
electrodes are plotted with respect to their impedance
values for each subject. No relation can be observed
between the impedance and the corresponding dry-gel
SignalQualityinDryElectrodeEEGandtheRelationtoSkin-electrodeContactImpedanceMagnitude
19

correlations for Electrode A (Fig. 4a). Electrode
B presents a decrease in quality and an increase
in impedance compared to Electrode B. Although
its impedance values vary a lot, the signal quality
obtained seems unaffected. This also suggest no
connection between the two variables. Note that the
acquired EEG signals for which the skin-electrode
contact impedance was higher than 500kΩ were
attenuated due to the amplifier saturation and so they
are not included in this analysis (see Figure 4b and
Fig. 4e).
The same trend is observed for the SNR
investigation. Measurements for Subject 4 were not
taken with Electrode B due to a very large impedance
value. Also, outliers in the SNR and correlation
plots of this electrode type represent measurements
that were excluded from previous analysis as no EEG
signal was observed during visual inspection of the
recordings. The results obtained indicate that a large
increase in the skin-electrode contact impedance has
no effect on the signal quality defined through our
parameters. However, a larger data set should be used
to confirm these results as the number of available
data points was limited to 12 per electrode type.
Gel electrode performance was also evaluated
with respect to the corresponding skin-electrode
contact impedance. Impedance values presented a
large variation and included values above 40 kΩ.
Both in the case of correlations and SNR, gel
electrodes presented high scores regardless of their
impedance value (Figure 4(c) and 4(f)). A lower
performance was seen in several gel electrodes, but
their impedance value was inside the mean range.
These results confirm the findings of Ferree et. al
(Ferree et al., 2001) and point out that signal quality
is not depended on the impedance magnitude, even
when these values are much higher than 40kΩ.
However, they also show that electrode material has
an impact on both impedance magnitude and obtained
EEG signal quality.
4 DISCUSSION
The dry-gel comparison made by using a gel-gel
comparison as a benchmark, proved to be a
reliable framework for dry electrode EEG signal
quality evaluation. Differences between subjects
and electrode types could easily be observed and
compared, providing useful information on the
introduced variability.
All three parameters proposed for evaluation,
namely signal correlations, signal coherence and
SNR, presented lower values for dry electrodes when
compared to gel electrodes. The results suggest
that better EEG signal quality is obtained through
gel electrodes, followed by the Ag/AgCl electrodes
and then by the polymer electrodes. Compared to
our previous study, the performance of the Ag/AgCl
electrodes was better as a consequence of the use of
active electrodes designed to cope with dry electrode
recording conditions. The mean coherence values
reported were lower than the correlation coefficients
obtained, but followed the same decreasing trends.
For the electrodes that presented strong dry-gel
correlations, high SNR values were also reported.
Since the mean coherence, correlation coefficients
and SNRs present the same trends and thus equivalent
conclusions regarding signal quality, one of them can
be considered sufficient for a fast characterization of
EEG recordings.
The mean values for the skin-electrode contact
impedance magnitude of the gel electrodes was the
lowest reported, while the highest was that of the
polymer electrodes. When comparing the defined
signal quality to the values of the impedance, no
trend was observed for different recordings with
the same electrode although impedance variations
were present. Skin-electrode contact impedance
magnitude values that exceeded the recommended
5kΩ threshold were reported for the gel electrodes.
However, there was no indication of a decrease in
performance, either from the visual inspection of
the recordings or from the values obtained for our
parameters. The lack of a relationship between EEG
signal quality and skin-electrode contact impedance
magnitude can be a consequence of the system
features: active electrodes combined with high input
impedance ASICs that were developed specifically
to eliminate the influence of high impedance values.
Thus, the recordings are expected to be less dependent
on the contact impedance. Nevertheless, differences
in recording quality can still be observed between
different electrode types.
The evaluation performed on the dry electrodes
revealed several disadvantages of this technology.
During the walking paradigms, a higher susceptibility
to motion artifacts was observed in the dry electrode
types. Less adhesion to the skin is one of the
factors that contributes the most to this effect. Also,
the spectra of dry electrode recordings presented
strong low frequency components that extended over
the 4Hz SSVEP stimulation frequency even in the
case of the seated paradigm. These low frequency
components are attributed to signal drifts due to the
changes in the skin-electrode contact over time. To
cope with these disadvantages, a solution for handling
motion needs to be found, either through system
BIODEVICES2014-InternationalConferenceonBiomedicalElectronicsandDevices
20

or algorithm design or by creating electrodes with
different contact properties. Furthermore, to give
a better characterization of the sensors, studies on
contact impedance variations over time should be
carried out. Electrodes that have shorter settling time
and that do not suffer from signal drifts are needed to
permit a faster, more reliable signal acquisition while
eliminating the undesired frequency components.
Due to the limitations of the proposed framework
and study design, conclusions regarding the relation
between signal quality and skin-electrode contact
properties are difficult to formulate. Future studies
should include a larger number of participants, both
male and female, for a more thorough, unbiased
analysis. During some of the experimental sessions,
gel electrodes were disconnected or made a poor
contact with the scalp of the participant. Also, due
to the constraints imposed by the rigid headset used
for dry electrode positioning, proper contact for dry
electrodes was not always obtained. Variability in the
size and head shape of the participants combined with
the different hair types, made the contact between
the skin and the electrode pins difficult. Results also
indicate that the reported outliers in signal quality
might be related to a bad contact of the electrodes
to the skin and not to the high skin-electrode contact
impedance magnitude.
Improvements to the proposed evaluation
framework should include a change in the stimulation
frequency of the SSVEP protocol. To avoid
interference from the strong low frequency
components, the alpha band frequency range
and the frequencies introduced by the walking
paradigms, a flickering frequency higher than 13Hz is
recommended. Also, placing the recording electrodes
above the occipital lobe would permit the capture of
a stronger SSVEP response as this site is closer to the
visual cortex. A protocol for eliciting event-related
potentials (ERPs) should also be included in the
evaluation as ERPs are often used in BCIs and
psychological studies. Moreover, the ERPs have a
very low amplitudes and thus are very sensitive to
different sources of interference.
Overall, better EEG systems and electrode
designs are needed to permit the usage of dry
electrode technology in a wide range of applications
requiring high quality signals. The skin-electrode
contact impedance broadly characterizes the interface
between the electrode and the skin. To allow the
design of better performing electrodes, more work
needs to be carried out in identifying the exact contact
characteristics that have the largest impact on signal
quality. Some of the approaches that could assist
in this process involve studying the skin-electrode
interface by analyzing the real and imaginary parts of
the impedance signal or by creating models of this
interface.
REFERENCES
Acunzo, D., Mackenzie, G., and Rossum, M. v. (2012).
Systematic biases in early ERP and ERF components
as a result of high-pass filtering. Journal of
Neuroscience Methods, 209:212–218.
Brainard, D. H. (1997). The Psychophysics Toolbox.
Spatial Vision, 10:433–436.
Chen, Y.-H., de Beeck, M. O., Vanderheyden,
Luc Mihajlovi
´
c, V., Grundlehner, B., and van
Hoof, C. (2013). Comb-Shaped Polymer-Based Dry
Electrodes for EEG/ECG Measurements with High
User Comfort. In 35th Annual International IEEE
EMBS Conference.
Chi, Y., Wang, Y.-T., Wang, Y., Maier, C., Jung, T.-P., and
Cauwenberghs, G. (2012). Dry and Noncontact EEG
Sensors for Mobile Brain-Computer Interfaces. IEEE
Transactions of Neural Systems and Rehabilitation
Engineering, 20(2):228–235.
Estepp, J., Monnin, J., Christensen, J., and Wilson,
G. (2005). Evaluation of a Dry Electrode
System for Electroencephalography: Applications
for Psychophysiological Cognitive Workload
Assessment. In Proceedings of the 11th International
Conference on Human Computer Interaction, Las
Vegas, Nevada, USA.
Estepp, J. R., Christensen, J. C., Monnin, J. W., Davis,
I. M., and Wilson, G. F. (2009). Validation of a
Dry Electrode System for EEG. In Proceedings
of the Human Factors and Ergonomics Society 53rd
Annual Meeting, pages 1171–1175, San Antonio,
Texas, USA.
Ferree, T. C., Luu, P., Russell, G. S., and Tucker, D. M.
(2001). Scalp electrode impedance, infection risk, and
EEG data quality. Clinical neurophysiology : official
journal of the International Federation of Clinical
Neurophysiology, 112(3):536–44.
Gargiulo, G., Calvo, R., Bifulco, P., Cesarelli, M., and
Ohamed, A. (2010). A New EEG recording system
for passive dry electrodes. Clinical Neurophysiology,
121:686–693.
Guevara, M. A. and Corsi-Cabrera, M. (1996). EEG
coherence or EEG correlation? International Journal
of Psychophysiology, 23:145–153.
Lin, C.-T., Wu, R.-C., Liang, S.-F., Chao, W.-H., Chen,
Y.-J., and Hung, T.-P. (2005). EEG-Based Drowsiness
Estimation for Safety Driving Using Idependent
Component Analysis. IEEE Transactions on Circuits
and Systems, 52(12):2726–2738.
Mihajlovi
´
c, V., Garcia-Molina, G., and J., P. (2012).
To What Extent Can Dry and Water-based EEG
Electrodes Replace Conductive Gel Ones? In
BioDevices conference, Vilamoura, Algarve, Portugal.
SignalQualityinDryElectrodeEEGandtheRelationtoSkin-electrodeContactImpedanceMagnitude
21

Mihajlovi
´
c, V., Li, H., Grundlehner, B., Penders, J., and
Schouten, A. (2013). Investigating the Impact of
Force and Movements on Impedance Magnitude and
EEG. In IEEE Engineering in Medicine and Biology
Society, Okata, Japan.
Minguez, J., Kubler, A., and Antelis, J. (2009). A
Noninvasive Brain-Actuated Wheelchair Based on a
P300 Neurophysiological Protocol and Automated
Navigation. IEEE Transactions on Robotics,
25(3):614–627.
Moriyama, T. S., Polanczyk, G., Caye, A., Banaschewski,
T., Brandeis, D., and Rohde, L. (2012).
Evidence-based information on the clinical use
of neurofeedback for ADHD. Neurotherapeutics :
the journal of the American Society for Experimental
NeuroTherapeutics, 9(3):588–98.
Patki, S., Grundlehner, B., Verwegen, A., Mitra, S., Xu,
J., Matsumoto, A., Yazicioglu, R., and Penders,
J. (2012). Wireless EEG System with Real Time
Impedance Monitoring and Active Electrodes. In
IEEE Biomedical Circuits and Systems Conference,
Hsinchu, Taiwan.
Ruffini, G., Dunne, S., Fuentemilla, L., Grau, C., Farres,
E., Marco-Pallares, J., Watts, P., and Silva, R. (2008).
First Human Trials of a Dry Electrophysiology Sensor
Using Carbon Nanotube Array Interface. Sensors and
Actuators A: Physical, 144(2):275–279.
Sellers, E., Turner, P., Samacki, W., McManus, T., Vaughan,
T., and Mathews, R. (2009). A Novel Dry Electrode
for Brain-Computer Interface. Human Computer
Interaction Methods and Techniques Lecture Notes in
Computer science, 5611:623–631.
Teplan, M. . (2002). Fundamentals of EEG Measurement.
Measurement Science Review, 2:Section 2.
T
˘
aut¸an, A.-M., Mihajlovi
´
c, V., Grundlehner, B., Penders,
J., and Serdijn, W. (2013). Framework for Evaluating
EEG Signal Quality of Dry Electrode Recordings. In
IEEE Biomedical Circuits and Systems Conference,
Rotterdam, The Netherlands.
Zander, T. O., Lehne, M., Ihme, K., Jatzev, S., Correia,
J., Kothe, C., Picht, B., and Nijboer, F. (2011).
A dry EEG system for scientific research and
brain-computer interfaces. Frontiers in Neuroscience,
5.
BIODEVICES2014-InternationalConferenceonBiomedicalElectronicsandDevices
22
