PhotoCluster
A Multi-clustering Technique for Near-duplicate Detection in Personal Photo
Collections
Vassilios Vonikakis, Amornched Jinda-Apiraksa and Stefan Winkler
Advanced Digital Sciences Center (ADSC), University of Illinois at Urbana-Champaign, Singapore, Singapore
Keywords:
Near Duplicate Detection, Image Similarity, Personal Photo Collections.
Abstract:
This paper presents PhotoCluster, a new technique for identifying non-identical near-duplicate images in per-
sonal photo collections. Contrary to existing methods, PhotoCluster estimates the probability that a pair of im-
ages may be considered near-duplicate. Its main thrust is a multiple clustering step that produces a non-binary
near-duplicate probability for each image pair, which exhibits correlation with the average observer opinion.
First, PhotoCluster partitions the photolibrary into groups of semantically similar photos, using global fea-
tures. Then, the multiple clustering step is applied within the images of these groups, using a combination
of global and local features. Computationally expensive comparisons between local features are taking place
only on a limited part of the library, resulting in a low overall computational cost. Evaluation with two publicly
available datasets show that PhotoCluster outperforms existing methods, especially in identifying ambiguous
near-duplicate cases.
1 INTRODUCTION
It is common nowadays for people to carry at least
one digital camera with them, mainly due to the
widespread use of smart phones. Additionally, the
affordability of digital images allows camera users
to easily take more than one picture of the same
scene, in order to increase the chances of capturing
an appealing photo. This has introduced an impor-
tant new problem: photolibraries are cluttered with
near-duplicate (ND) images that are similar and thus
redundant. This negatively affects not only the size of
photolibraries, but also various photowork tasks, such
as triaging (Kim et al., 2012) or browsing.
According to Foo et al. (2007a), ND cases can
be grouped into two categories: identical ND (IND),
which are derived from the same digital source after
applying some transformations, and non-identical ND
(NIND), which are images of the same scene or ob-
jects. Personal photolibraries may comprise a high
number of NIND cases. Identifying these cases is
challenging, since they exhibit a considerable degree
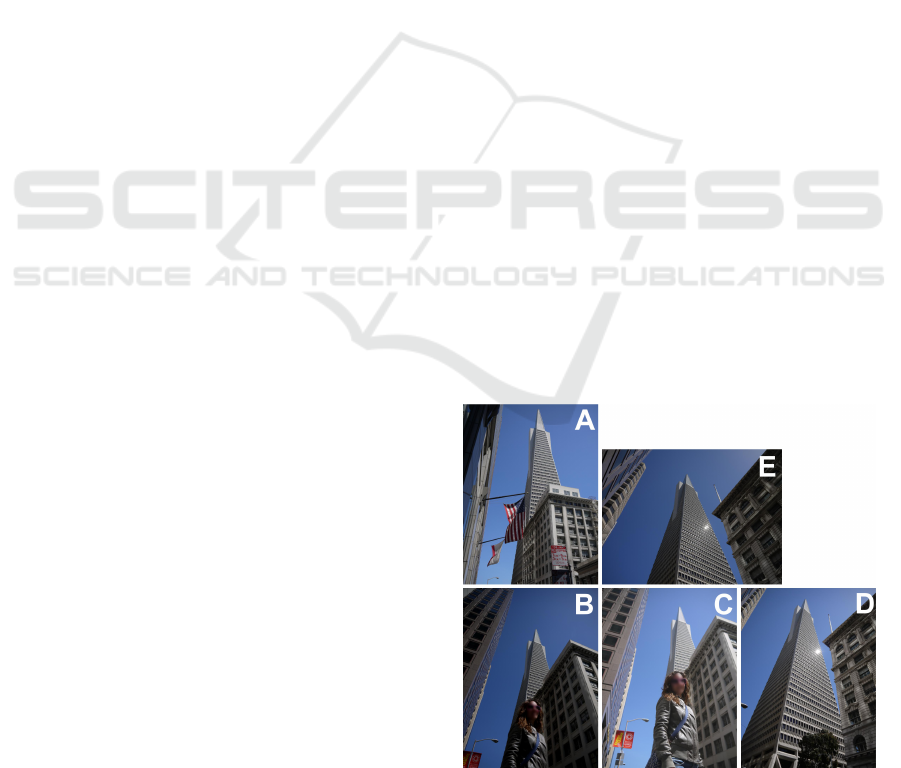
of subjectivity in interpretation, as Fig. 1 indicates.
According to Jinda-Apiraksa et al. (2013), in only
20% of images taken from personal photo-collections,
do observers completely agree that a pair may be ND.
This clearly demonstrates that ND detection in per-
Figure 1: A typical case of NIND. Observers may disagree
which of the five images should be considered ND.
sonal photolibraries is a very challenging task, mainly
due to the semantic gap, which may result in different
interpretations between observers. Due to this sub-
jectivity, most existing works have focused on IND
cases, such as copyright detection or duplicate search
on the web (Wu et al., 2009), which have a more ob-
jective definition.
The first attempts to tackle the problem of ND
153
Vonikakis V., Jinda-Apiraksa A. and Winkler S..
PhotoCluster - A Multi-clustering Technique for Near-duplicate Detection in Personal Photo Collections.
DOI: 10.5220/0004737701530161
In Proceedings of the 9th International Conference on Computer Vision Theory and Applications (VISAPP-2014), pages 153-161
ISBN: 978-989-758-004-8
Copyright
c
2014 SCITEPRESS (Science and Technology Publications, Lda.)
were extensions of image retrieval (Zhang and Chang,
2004). Since ND detection is computationally inten-
sive, many methods have proposed a cascade structure
in order to quickly exclude images that are clearly not
ND, in order to limit the most computationally inten-
sive processing to as few images as possible (Tang
and Gao, 2009; Wang et al., 2011). Various types of
hashing have been used for this purpose, such as lo-
cality sensitive hashing (Foo et al., 2007a; Ke et al.,
2004), as has saliency (Zheng et al., 2011). Recently,
clustering methods have emerged as a promising ap-
proach to the ND problem (Chu and Lin, 2010; Foo
et al., 2007b; Wang et al., 2012; Zhao and Ngo, 2009).
Although there is an extensive body of work re-
garding ND images, very few techniques are specifi-
cally designed for personal photo collections. Notable
exceptions are Jaimes et al. (2003, 2002); Tang and
Gao (2009). However, they are based on binary de-
cisions, which cannot capture the subjectivity of per-
sonal photo collections (Jinda-Apiraksa et al., 2013).
PhotoCluster specifically addresses the subjectiv-
ity of NIND cases in personal photo collections. It
automatically partitions the photolibrary into smaller
sets of similar images, on which a multiple cluster-
ing step is applied. In every iteration, the parameter
controlling the number and size of the clusters varies,
resulting in different numbers and types of clusters.
These multiple binary results are combined into a cor-
relation matrix with non-binary entries. As a result,
contrary to most existing approaches, PhotoCluster
produces continuous values, which exhibit correlation
with the probability that a pair of images may be con-
sidered ND by observers. Since the F1 score, which is
the main comparison metric used in these tasks, can-
not be directly applied to non-binary values, we gen-
eralize the formulas for the calculation of True Posi-
tives (TP), True Negatives (TN), False Positives (FP),
and False Negatives (FN). This results in a soft ver-
sion of the F1 score, which can be applied to contin-
uous as well as binary values. Evaluations with two
different datasets show that PhotoCluster represents
a promising approach for tackling the subjectivity of
NIND in personal photo collections, outperforming
existing techniques in the detection of ambiguous ND
cases.
The rest of the paper is organized as follows. Sec-
tion 2 describes the proposed method and its imple-
mentation. Section 3 describes the new generalized
formulas for the soft F1 score. Experimental results
are reported in Section 4, and concluding remarks are
presented in Section 5.
2 PHOTOCLUSTER
2.1 Method
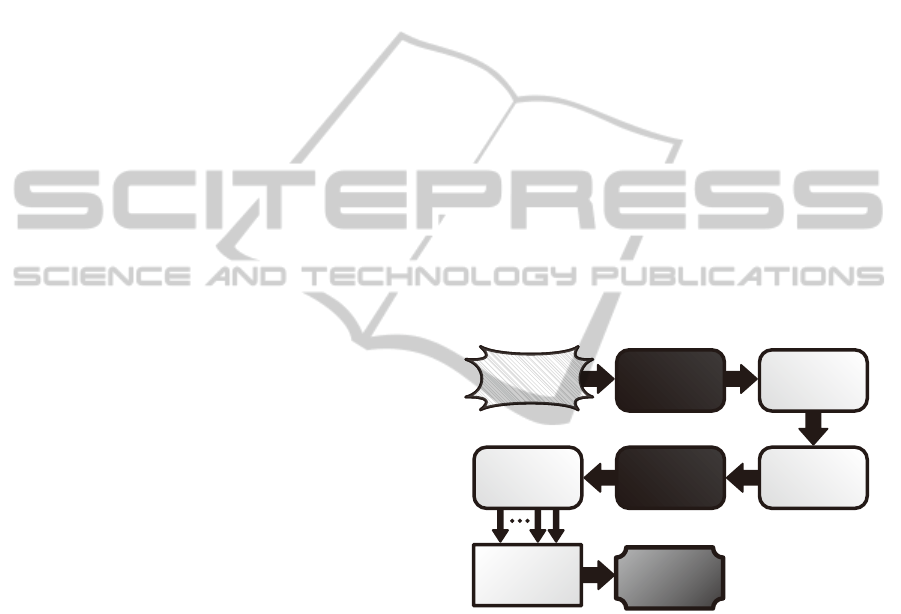
The block diagram of the PhotoCluster method is de-
picted in Fig. 2. The first stage involves the extraction
of global features from the whole photolibrary, which
is usually a lot less computationally intensive than the
extraction of local ones. Based on these global fea-
tures, and using image dissimilarity (Vonikakis and
Winkler, 2012) as a distance metric, the photolibrary
PL, comprising N number of images, is partitioned
into L image sets, using the Affinity Propagation (AP)
clustering technique (Frey and Dueck, 2007), which
automatically determines the number of clusters. Lo-
cal features are extracted and matched only within the
images in each of these L sets. This organization strat-
egy is selected in order to confine the computationally
intensive detection/matching process to only a small
set of similar images (based on global features) and
not to the whole photolibrary. Additionally, the result-
ing L image sets usually contain semantically similar
images, which can be useful for image browsing or
summarization.
Local
Feature
extracon
Photolibrary
Global
Feature
Extracon
Clustering
Mulple
Clustering
Combining
ND
probability
T mes
L image sets
Non-binary
Correlaon
Matrix R
Figure 2: Block diagram of the PhotoCluster method.
For each of these L sets, a multiple clustering step
is applied independently, based on a distance met-
ric combining both local and global features. Let
S =
{
I
1
,...,I
n
}
be one of the L sets, comprising n
images. Let D
S
= [d
i j
]
n×n
be the dissimilarity ma-
trix of all possible image pairs in S, with d
i j
denot-
ing the dissimilarity between images I
i
and I
j
. Since
d
i j
= d
ji
, matrix D
S
is symmetric. Let F be a clus-
tering method applied on the dissimilarity matrix D
S
,
such that F (D
S
,k) =
{
C
1
,...,C
m
}
, partitioning S into
a set of m image clusters, such that C
1
∪ ...∪C
m
= S,
with k being the parameter that controls m. The pro-
posed multiple clustering step controls k in such way
that different clusters will be formed with every iter-
ation. For clustering methods that directly control m,
like K-means, k equals m and can be adjusted in the
VISAPP2014-InternationalConferenceonComputerVisionTheoryandApplications
154

range [k
1
,k
q
], with F (D
S
,k
1
) = S (all images are in
one cluster) and F (D
S
,k
q
) =
{
C
1
,...,C
n
}
(every im-
age is an individual cluster). For clustering methods
in which there is no direct control over m, like AP, k
represents the strictness level of F and should be cho-
sen within its allowed limits (for AP, k represents the
preference parameter, with k
1
= 0 and k
q
= max[D
S
]).
For every image pair u
S
i j
of images I
i
and I
j
, the
probability P for it to be considered ND is given by:
P
u
S
i j
=
∑
q
x=1
h
h
x
(u
S
i j
)w(k
x
)
i
∑
q
x=1
w(k
x
)
, (1)
h
x
u
S
i j
=
(
0 if u
S
i j
/∈ Q
x
1 if u
S
i j
∈ Q
x
, (2)
w(k) = a
k −k
1
k
q
− k
1
+ (1 − a)
k
q
− k
k
q
− k
1
, (3)
where Q
x
=
{
P (C
1
),...,P (C
x
)
}
is the set of pow-
ersets of each member of F (D
S
,k
x
) =
{
C
1
,...,C
x
}
,
h
x
(u
S
i j
) is a function that outputs 1 when the images
of the pair u
S
i j
are grouped in the same cluster during
the x
th
iteration, w(k
x
) is its weighting factor, and a is
an estimation parameter related to the average degree
of dissimilarity between all images of S, controlling
the contribution of h
x
(u
S
i j
). As such, a is the mean
value of all entries of D
S
, with a ∈ [0, 1].
Fig. 3 depicts the graphical representation of the
weighting function used, for different values of a. In
the case that all images of set S are identical (zero
dissimilarity), a = 0 and thus greater importance will
be given to the clustering iterations with parameter
k close to k
1
, which tend to group all images in one
cluster. In the opposite case, if all images of set S are
totally dissimilar (maximum dissimilarity), a = 1 and
thus greater importance will be given to the clustering
iterations with parameter k close to k
q
, which tend to
keep each image in a separate group. Any other case
between these two extremes will be a linear combina-
tion.
The intuition behind the proposed approach is
that, although the number or size of clusters may
change as parameter k changes with each iteration,
stronger ND cases (with a small dissimilarity d) will
be in the same cluster most of the time, resulting in a
higher probability value. On the other hand, ambigu-
ous ND cases (with larger dissimilarity d), will tend
to be clustered together less often, resulting in a lower
probability value.
Since the multiple clustering step is applied only
on images of the same set S, the probability that an
image A from set S
i
is ND with an image B from an-
other set S
j
is 0. The final output of the method is
1
0
weight w
a=0
a=1
a=0.5
k
1
k
q
a
=0.75
a
=0.25
clustering parameter k
identical images
dissimilar images
Figure 3: Weighting function w (Eq. 3) for different values
of a.
a correlation matrix R = [P
i j
]
N×N
containing the ND
probability for every possible image pair of PL. The
non-binary probabilistic output of PhotoCluster can
be directly used in cases such as spatial positioning of
similar images for photo browsing (Schaefer, 2010) or
the automatic selection of images for slideshow cre-
ation (Vonikakis and Winkler, 2012). In cases where
a binary decision is needed, a final optional step could
be included for the binarization of R. Since this is a
highly subjective process, some user control is neces-
sary, e.g. by setting a personalized probability thresh-
old. Alternatively, other more sophisticated methods
could be used, taking into consideration prior user ac-
tivity and preferences.
2.2 Implementation
The image distance metric used for the implementa-
tion of PhotoCluster is given by the following formula
from Vonikakis and Winkler (2012):
d
AB
= 1 −
∑
Z
x=1
(1 − f
x
AB
)W
x
∑
Z
x=1
W
x
, (4)
d
AB
, f
x
AB
∈ [0, 1],W
x
∈ R
+
,
where d
AB
is the final dissimilarity between images A
and B. Z is the total number of features, f
x
AB
is the
x
th
feature distance, normalized to the interval [0,1],
and W
x
its importance weight. Note that since sim-
ilarity and dissimilarity are two complementary con-
cepts, the former can be expressed as 1 − d
AB
.
The multiple clustering step of PhotoCluster was
implemented using AP (Frey and Dueck, 2007), in
which we control the preference parameter that indi-
rectly adjusts the number and size of clusters, rang-
ing from zero (k
1
= 0) to the maximum dissimilarity
values of every set S (k
q
= max[D
S
]). When k
1
= 0
AP tends to group all images into one cluster. On the
other hand, when k
q
= max[D
S
], every image tends to
be an individual cluster.
PhotoCluster-AMulti-clusteringTechniqueforNear-duplicateDetectioninPersonalPhotoCollections
155
Z = 2 global features are used to partition the
photolibrary into L sets, namely color histograms
and time stamps, with equal importance weights.
Z = 3 features are used in the multiple clustering
step, namely SIFT Matching Ratio (SMR), color his-
tograms, and timestamps, in descending order of im-
portance. SMR between two images A and B is given
by the following equation:
SMR
AB
=
2M
AB
(K
A
+ K
B
)
, (5)
where K denotes the number of keypoints from
each image, and M
AB
is the number of bidirectional
matches between the two images.
It should be noted that additional features could
easily be included in the distance metric of Eq. 4. For
example, GIST (Oliva and Torralba, 2001) or geotag-
ging data could be added in the global features used
for the initial partitioning of the photolibrary, whereas
other, computationally more expensive features such
as co-saliency (Fu et al., 2013) could be included in
the multiple clustering step.
3 SOFT F1 SCORE
The most common metrics used for the evaluation of
ND results by almost all methods are precision, re-
call, as well as the F1 score, which is a combination
of both. These metrics however rely on binary deci-
sions for the calculation of True Positives (TP), True
Negatives (TN), False Positives (FP), and False Neg-
atives (FN). This only applies if we assume that a pair
of images can either be ND or not; no in-between con-
dition can exist. Since this assumption does not hold
in the case of NIND, we introduce an extension of the
classic F1 score, the soft F1 score (sF1), which can be
applied to both binary and continuous values.
Let R = [r
i j
]
N×N
be the correlation matrix of the
results, and G = [g
i j
]
N×N
the ground truth matrix,
both taking values in the interval [0,1]. Following the
definitions of TP, TN, FP, and FN, the proposed soft
formulas, operating on continuous values, may be de-
rived by simple min/max operations between the ma-
trices R and G:
sT P
i j
= min[g
i j
,r
i j
] (6)
sT N
i j
= min[1 − g
i j
,1 − r
i j
] (7)
sFP
i j
= max[r
i j
− g
i j
,0] (8)
sFN
i j
= max[g
i j
− r
i j
,0] (9)
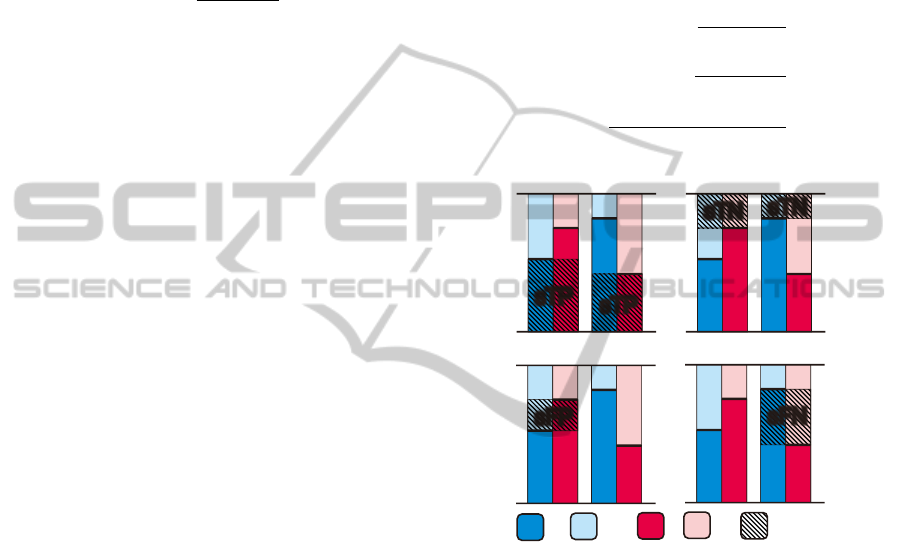
Similarly to their binary counterparts, the above
formulas integrate to unity for every (i, j) element
of the two matrices. Fig. 4 demonstrates graphi-
cally the new definitions, with bars ranging between
0 and 1, representing the possible values that R and
G may acquire. For each definition, two different in-
stances are included, one when the predicted value R
is greater than G, and one for the opposite case. The
final values of sTP, sT N, sFP, and sFN for the whole
database are the sum of all the individual (i, j) cases.
The summed values can be used directly in the classic
formulas for the calculation of soft Precision (sPreci-
sion), soft Recall (sRecall) and sF1 score, as follows:
sPrecision =
sT P
sT P + sFP
(10)
sRecall =
sT P
sT P + sFN
(11)
sF1 =
2 · sPrecision · sRecall
sPrecision + sRecall
(12)
sTP
sTP
GT
1-GT
R
1-R
sTP,sTN
sFP,sFN
1
0
sFP
sTN
sTN
sFN
GT<R GT>R
1
0
0 0
1 1
GT<R GT>R
GT<R GT>R GT<R GT>R
Figure 4: Graphical demonstration of the sTP, sTN, sFP, and
sFN definitions.
4 EXPERIMENTAL RESULTS
We compare PhotoCluster to four existing ND detec-
tion techniques:
• Cascade from Vonikakis and Winkler (2012),
a system typical of cascade-based approaches.
More importantly, this method is also finely tuned
for personal photo collections and uses the same
three features as the proposed implementation.
• INDetector from Zhang and Chang (2004), which
uses stochastic attributed relational graph match-
ing with learning and part-based representation of
visual scenes.
• The classic Bag-of-Visual-Words technique
(BoVW), as implemented by the SOTU ND
detection tool (Zhao, 2013). This particular
VISAPP2014-InternationalConferenceonComputerVisionTheoryandApplications
156

implementation uses Hessian-Affine keypoint
detection and SIFT for keypoint description. The
dictionary contains 20,000 visual words and was
built using randomly selected keypoints from the
same datasets in which the method was tested.
• Xmatch from Zhao and Ngo (2009), which uses
scale-rotation invariant pattern entropy based on
the SIFT descriptor and exhausted pair-wise com-
parisons.
Apart from these methods, the results for using only
the image similarity measure, without the subsequent
proposed clustering steps, are also reported (Similar-
ity).
Since existing methods mainly target the domain
of copyright detection, their evaluation datasets in-
clude images from news channels (Zhao and Ngo,
2009), or synthetic degradations (e.g. cropping, ro-
tation, intensity, resizing etc.) applied to images from
the web (Foo et al., 2007a). These databases however,
are quite different from the personal photolibrary of a
typical user, which mostly contains people in family
moments, traveling/vacation, or other everyday activ-
ities. More importantly though, these datasets pro-
vide only a binary ground truth, which cannot capture
the ambiguity of NIND cases (Jinda-Apiraksa et al.,
2013). For this reason, two different datasets were
used for the evaluation of the methods in this study,
featuring images taken from personal photolibraries.
The comparison results are reported in the following.
4.1 California-ND Dataset
The California-ND dataset has been specifically de-
signed for ND detection in personal photolibraries
(Jinda-Apiraksa et al., 2013). The advantage of this
dataset is that it comprises 701 images from a real
user’s travel photo collection, the size of which co-
incides with the average number of photo taken per
trip (Loos et al., 2009). Although the total number
of images may not be as high as in other established
datasets in the copyright detection domain, this is the
only existing publicly available dataset including im-
ages directly taken from a personal photo collection,
which has also been annotated for ND cases by a
panel of 10 observers, and as such captures the inher-
ent ambiguity of NIND cases. In order to use them
in our evaluation, the 10 annotations were averaged,
resulting in a real number in the interval [0, 1], indi-
cating the agreement between subjects that a pair of
images may be ND. These results are stored in matrix
G, which serves as the ground truth.
The ND cases include the 3 major categories re-
ported in Jaimes et al. (2002): variations in the scene,
the camera settings, and the image. This includes
changes in the subject/background, zooming, pan-
ning, tilting, brightness/exposure difference, white
balance difference, burst shots, group photos, perfor-
mance/show photos, portrait photos etc. It should
be noted that zooming, in reality, can be different
from simple cropping, which is extensively used in
other datasets, since by the time the camera lens
has zoomed and focused, the scene may also have
changed. Furthermore, the photos included in the
dataset are captured by two different cameras with
non-synchronized timestamps. This has an impact on
any method that uses timestamps as a feature of image
(dis)similarity, including the proposed one.
1
1
1
1
1
0.46
0.46
0.46
0.46
0.95
0.95
0.95
0.95
0
0
0
0
0
0
0
000
0 0
A
B C D E
A
B
C
D
E
Correlation Matrix R
1
1
1
1
1
0.3
0.3
0.2
0.2
0.9
0.9
0.6
0.6
0.1
0.1
0.1
0.1
0.1
0.1
0.1
0.1
0.1
0.1
0.1
0.1
A
B C D E
A
B
C
D
E
Ground Truth G
1
1
1
1
1
0.44 0.44 0.43 0.44
0.44
0.44
0.43
0.44
0.94
0.94
0.440.44
0.44 0.94
0.94
0.42
0.42
0.43
0.43
0.44
A
B C D E
A
B
C
D
E
Similarity Values
Figure 5: Correlation matrices for the ND cases of Fig. 1.
Fig. 5 demonstrates the strength of PhotoCluster
using the images of Fig. 1, which are part of the
California-ND dataset. The results of PhotoCluster
(matrix R) are compared to the ground truth (matrix
G) and the similarity values used in the multiple clus-
tering step. The subset of five images (A, B, C, D, and
E), contains one obvious pair of ND (B,C) and many
other ambiguous cases. This is evident from matrix
G, where the average observers’ rating for B and C
is 0.9, whereas it ranges from 0.1 to 0.6 for the other
pairs.
The image similarity values do not follow the
ground truth trend. According to matrix G, only 10%
of the observers agreed that images D and E are ND
with images A, B, and C, whereas the similarity value
for all of them is around 0.44. Once the multiple clus-
tering step of PhotoCluster is applied on these simi-
larity values, R resembles G much better; images D
and E are assigned 0 probability of being ND with
A, B, and C. This shows that the results of the pro-
posed method roughly follow the pattern of ground
truth, whereas image similarity alone is not enough
for capturing the ambiguity of NIND cases.
Fig. 6 depicts the performance of the different
methods for the California-ND dataset. It confirms
again that image similarity alone is not adequate for
detecting ND cases; while it exhibits very high recall,
it has very low precision. Consequently, the sF1 score
is very low. When compared to PhotoCluster, the con-
tribution of the multiple clustering approach becomes
apparent.
INDetector and BoVW exhibit very similar re-
sults, and a behavior opposite to Similarity. Their pre-
PhotoCluster-AMulti-clusteringTechniqueforNear-duplicateDetectioninPersonalPhotoCollections
157
0.0624
0.2759
0.2871
0.5621
0.6224
0.7055
0
0.1
0.2
0.3
0.4
0.5
0.6
0.7
0.8
0.9
1
Similarity INDetector BoVW Cascading Xmatch PhotoCluster
Precision Recall sF1 score
Figure 6: Comparison results for the California-ND dataset.
0
0.1
0.2
0.3
0.4
0.5
0.6
0.7
0.8
0.9
1
0.1 0.2 0.3 0.4 0.5 0.6 0.7 0.8 0.9 1
sF1 score
Ground Truth Confidence Value
PhotoCluster Xmatch BoVW INDetector Cascading
Figure 7: Comparison results for different degrees of ground truth confidence value.
cision is very high (nearly 1), meaning that almost all
detected ND cases are correct. However, many ND
cases are not detected; this has a profound impact on
the recall, which is below 0.2. Consequently, the re-
sulting sF1 score is quite low. This can be explained
by the fact that these methods only use local features
and do not take other global features like color or time
stamps into account, which suggests that local fea-
tures are not enough for dealing with the ambiguity
of NIND cases.
Cascade exhibits an improvement over INDetec-
tor and BoVW. There is a drop in precision, but this
is compensated by an even greater increase in recall,
which raises the sF1 score considerably. This in-
crease in performance could be due to the fact that it is
specifically targeted at personal photolibraries (which
is not the case for INDetector and BoVW), and be-
cause of using additional image features.
Xmatch further improves on the others. Once
more, precision drops, but this is compensated by an
increase in recall, resulting in a higher sF1 score. Al-
though Xmatch does not use color or timestamp in-
formation, its good performance is due to the fact that
it employs a sophisticated scale-rotation invariant pat-
tern entropy scheme, which is computationally inten-
sive, however.
PhotoCluster exhibits the highest sF1 score among
all methods. Again, the trend is similar; there is a
drop in precision combined with an increase in recall,
resulting in a higher sF1 score. Increased recall indi-
cates that more ND cases are identified.
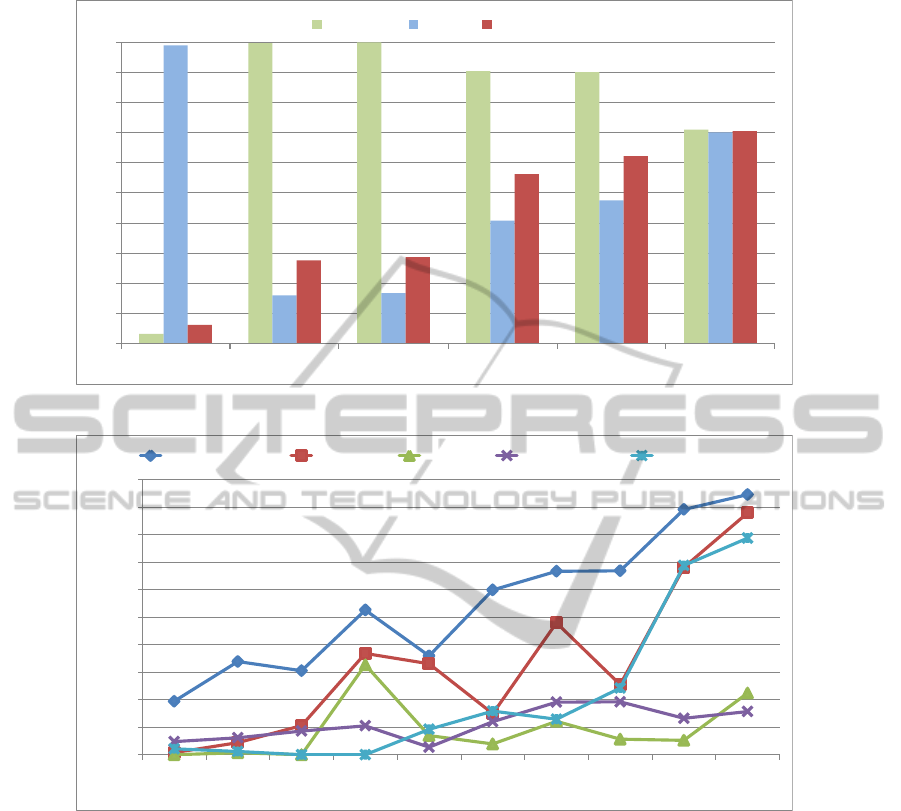
Fig. 7 depicts the performance of each algorithm
for different degrees of ground truth confidence, re-
vealing important insights regarding their behavior
VISAPP2014-InternationalConferenceonComputerVisionTheoryandApplications
158

2
85
145
529
5700
0
100
200
300
400
500
600
700
800
900
1000
Cascading BoVW PhotoCluster Xmatch INDetector
Execution Time (min)
Figure 8: Execution times for the California-ND dataset.
0.2416
0.2888
0.4503
0.4604
0.5153
0.562
0.7055
0
0.1
0.2
0.3
0.4
0.5
0.6
0.7
0.8
Only time Only SMR Time+SMR Only Color Time+Color Color+SMR All features
sF1 score
Different Combinations of Features for PhotoCluster
Figure 9: Performance of PhotoCluster for different feature
combinations.
for ND cases of different ambiguity level. PhotoClus-
ter exhibits the best sF1 score at all confidence levels,
followed by Xmatch. This is a direct result of the
fact that other techniques focus on obvious ND pairs,
while ignoring uncertain ND cases. For example,
at a confidence level of 0.1, PhotoCluster performs
18.65% better in sF1 score compared to Xmatch. This
shows that the proposed method can better handle am-
biguous ND cases.
The execution time for each method is depicted
in Fig. 8. Cascade is the fastest method by far. This
is because it quickly eliminates cases with significant
differences in color or timestamps, while local fea-
ture comparisons are applied only to very few cases.
BoVW is the next fastest method. The time for the
creation of the dictionary is not taken into considera-
tion, since this is done only once, and any subsequent
comparisons reuse it. PhotoCluster is about 3.5 times
faster than Xmatch. INDetector is the slowest method
by far, to the point where its bar in Fig. 8 is truncated
for visualization purposes. Taking the above into con-
sideration, PhotoCluster appears to strike a good bal-
ance between high detection performance and mod-
erate execution times. It should be noted that the re-
ported time for PhotoCluster refers to an unoptimized
Python implementation, whereas all the other meth-
ods were combinations of executable files, built in un-
known programming languages.
To further investigate the impact of feature selec-
tion on the performance of the proposed method, Pho-
toCluster was tested using different feature combina-
tions. The results are shown in Fig. 9. Timestamps
and SMR are the ones that yield the worst perfor-
mance. Color histograms, alone or in combination
with other features, exhibit better performance com-
pared to SMR and timestamps, while the combination
of all three results in the best performance. This in-
dicates that – at least for personal photo collections
– local features alone are not enough to successfully
identify all ND cases, and a combination of local and
global features seems more promising.
4.2 INRIA Holidays Dataset
The proposed method was also tested on INRIA’s
Holidays dataset (Jegou et al., 2008). Although the
target application of this dataset is image retrieval,
it was selected due to the lack of other appropriate
datasets, as well as the fact that it comprises images
taken from personal photo collections. It contains a
total of 1491 images and provides 500 queries, along
with their ground truth, and a comparison protocol
based on mean average precision (mAP), which is
given by the following equations:
AP =
n
∑
k=1
P(k) ∆r (k), (13)
mAP =
∑
Q
q=1
AP(q)
Q
, (14)
where AP is the Average Precision, k is the rank in
the sequence of retrieved images, n is the number of
retrieved images (which differs for each query), P(k)
is the precision at cut-off k in the list, ∆r(k) is the
change in recall from image k − 1 to k and Q is the
total number of queries, which is 500 for the Holidays
dataset.
The results of the different methods on the Hol-
idays dataset are depicted in Fig. 10. PhotoCluster,
in its original version, clearly exhibits the best perfor-
mance. However, the fact that it uses timestamps in
this particular dataset skews the results. This is be-
cause the images in Holidays dataset are not consec-
utively chosen from a photolibrary, but instead hand-
picked from very different time periods. As a result,
timestamps become unusually discriminative, giving
an unfair advantage to PhotoCluster. For this rea-
son, a second version of PhotoCluster without the use
of timestamps was included. It should be noted that
this is not a problem for the California-ND dataset, in
which all images were selected consecutively from a
user’s personal photo collection. Furthermore, times-
tamps were found to be among the less discriminative
features in California-ND, according to Fig. 9. This
highlights the importance of consecutively selecting
PhotoCluster-AMulti-clusteringTechniqueforNear-duplicateDetectioninPersonalPhotoCollections
159

6.42
21.933
36.685
39.643
70.23
0
10
20
30
40
50
60
70
80
Cascading BoVW PhotoCluster
(no time)
Xmatch PhotoCluster
Mean average precision
Figure 10: Comparison results for the INRIA Holidays
dataset.
6
144
419
420
1788
0
200
400
600
800
1000
1200
1400
1600
1800
Cascading BoVW PhotoCluster
(no time)
PhotoCluster Xmatch
Execution Time (min)
Figure 11: Execution times for the INRIA Holidays dataset.
images from personal photo collections.
The worst performance is exhibited by the Cas-
cading technique, which seems to be affected by the
fact that it is finely tuned for the detection of high-
confidence ND cases and not for image retrieval.
BoVW has a better performance than Cascading.
If we exclude the original version of the proposed
method, Xmatch exhibits the best results, closely fol-
lowed by PhotoCluster without timestamps (the dif-
ference in mAP is less than 3%). However, Photo-
Cluster is over 4 times faster than Xmatch, as Fig. 11
shows.
5 CONCLUSIONS
We presented PhotoCluster, a new technique for
NIND detection in personal photo collections. The
main advantage of the proposed approach is that it
produces a correlation matrix indicating the probabil-
ity that an image pair may be considered ND. As a
result, ambiguous ND cases will not be ignored, but
will simply be assigned a low probability value. Pho-
toCluster performs on par or better compared to exist-
ing state-of-the-art methods, while keeping complex-
ity and execution times reasonable. Experimental re-
sults demonstrate that it can better handle ambiguous
cases of ND, which makes it much more suitable for
personal photo collections.
ACKNOWLEDGEMENTS
This study is supported by the research grant for
ADSC’s Human Sixth Sense Programme from Singa-
pore’s Agency for Science, Technology and Research
(A*STAR).
REFERENCES
Chu, W.-T. and Lin, C.-H. (2010). Consumer photo man-
agement and browsing facilitated by near-duplicate
detection with feature filtering. Journal of Vi-
sual Communication and Image Representation,
21(3):256–268.
Foo, J. J., Sinha, R., and Zobel, J. (2007a). Discovery of
image versions in large collections. In Proc. 13th In-
ternational MultiMedia Modelling Conference.
Foo, J. J., Zobel, J., and Sinha, R. (2007b). Clustering near-
duplicate images in large collections. In Proc. 9th
ACM SIGMM International Workshop on Multimedia
Information Retrieval, pages 21–30.
Frey, B. J. and Dueck, D. (2007). Clustering by passing
messages between data points. Science, 315.
Fu, H., Cao, X., and Tu, Z. (2013). Cluster-based co-
saliency detection. IEEE Transactions on Image Pro-
cessing, 22(10):3766–3778.
Jaimes, A., Chang, S., and Loui, A. (2003). Detection
of non-identical duplicate consumer photographs. In
Proc. Joint Conference of the 4th International Con-
ference on Information, Communications and Signal
Processing, and 4th Pacific Rim Conference on Multi-
media, pages 16–20.
Jaimes, A., Chang, S.-F., and C. Loui, A. (2002). Duplicate
detection in consumer photography and news video.
In Proc. 10th ACM International Conference on Mul-
timedia.
Jegou, H., Douze, M., and Schmid, C. (2008). Hamming
embedding and weak geometric consistency for large
scale image search. In Proc. 10th European Confer-
ence on Computer Vision (ECCV), pages 304–317.
Jinda-Apiraksa, A., Vonikakis, V., and Winkler, S.
(2013). California-ND: An annotated dataset for near-
duplicate detection in personal photo collections. In
Proc. 5th International Workshop on Quality of Mul-
timedia Experience (QoMEX).
Ke, Y., Sukthankar, R., and Huston, L. (2004). Efficient
near-duplicate detection and sub-image retrieval. In
Proc. 12th ACM International Conference on Multi-
media, pages 869–876.
Kim, S. J., Ng, H., Winkler, S., Song, P., and Fu, C.-W.
(2012). Brush-and-drag: A multi-touch interface for
photo triaging. In Proc. 14th ACM International Con-
ference on Human-Computer Interaction with Mobile
Devices and Services (MobileHCI), pages 59–68.
Loos, A., Paduschek, R., and Kormann, D. (2009). Eval-
uation of algorithms for the summarization of photo
collections. In Proc. Theseus/ImageCLEF Workshop
on Visual Information Retrieval Evaluation.
VISAPP2014-InternationalConferenceonComputerVisionTheoryandApplications
160

Oliva, A. and Torralba, A. (2001). Modeling the shape
of the scene: A holistic representation of the spatial
envelope. International Journal of Computer Vision,
42(3):145–175.
Schaefer, G. (2010). A next generation browsing environ-
ment for large image repositories. Multimedia Tools
and Applications, 47(1):105–120.
Tang, F. and Gao, Y. (2009). Fast near duplicate detection
for personal image collections. In Proc. 17th ACM
International Conference on Multimedia, pages 701–
704.
Vonikakis, V. and Winkler, S. (2012). Emotion-based se-
quence of family photos. In Proc. 20th ACM Interna-
tional Conference on Multimedia, pages 1371–1372.
Wang, M., Ji, D., Tian, Q., and Hua, X.-S. (2012). Intel-
ligent photo clustering with user interaction and dis-
tance metric learning. Pattern Recognition Letters,
33(4):462–470.
Wang, Y., Hou, Z., and Leman, K. (2011). Keypoint-based
near-duplicate images detection using affine invariant
feature and color matching. In Proc. IEEE Interna-
tional Conference on Acoustics, Speech, and Signal
Processing (ICASSP), pages 1209–1212.
Wu, Z., Ke, Q., Isard, M., and Sun, J. (2009). Bundling
features for large scale partial-duplicate web image
search. In Proc. IEEE Conference on Computer Vi-
sion and Pattern Recognition (CVPR), pages 25–32.
Zhang, D.-Q. and Chang, S.-F. (2004). Detecting image
near-duplicate by stochastic attributed relational graph
matching with learning. In Proc. 12th ACM Interna-
tional Conference on Multimedia, pages 877–884.
Zhao, W.-L. (2013). SOTU.
http://www.cs.cityu.edu.hk/ wzhao2/sotu.htm.
[Online; accessed 6-Nov-2013].
Zhao, W.-L. and Ngo, C.-W. (2009). Scale-rotation invari-
ant pattern entropy for keypoint-based near-duplicate
detection. IEEE Transactions on Image Processing,
18(2):412–423.
Zheng, L., Qiu, G., Huang, J., and Fu, H. (2011). Salient
covariance for near-duplicate image and video detec-
tion. In Proc. IEEE International Conference on Im-
age Processing (ICIP), pages 2537–2540.
PhotoCluster-AMulti-clusteringTechniqueforNear-duplicateDetectioninPersonalPhotoCollections
161
