
Multi-feature Real Time Pedestrian Detection from Dense Stereo
SORT-SGM Reconstructed Urban Traffic Scenarios
Ion Giosan and Sergiu Nedevschi
Computer Science Department, Technical University of Cluj-Napoca, Cluj-Napoca, Romania
Keywords: Driving Assistance Systems, Dense Stereo, SORT-SGM, Multi Features, Pedestrian Detection.
Abstract: In this paper, a real-time system for pedestrian detection in traffic scenes is proposed. It takes the advantage
of having a pair of stereo video-cameras for acquiring the image frames and uses a sub-pixel level optimized
semi-global matching (SORT-SGM) based stereo reconstruction for computing the dense 3D points map
with high accuracy. A multiple paradigm detection module considering 2D, 3D and optical flow information
is used for segmenting the candidate obstacles from the scene background. Novel features like texture
dissimilarity, humans’ body specific features, distance related measures and speed are introduced and
combined in a feature vector with traditional features like HoG score, template matching contour score and
dimensions. A random forest (RF) classifier is trained and then applied in each frame for distinguishing the
pedestrians from other obstacles based on the feature vector. A k-NN algorithm on the classification results
over the last frames is applied for improving the accuracy and stability of the tracked obstacles. Finally, two
comparisons are made: first between the classification results obtained by using the new SORT-SGM and
the older local matching approach for stereo reconstruction and the second by comparing the different
features RF classification results with other classifiers’ results.
1 INTRODUCTION
Nowadays, building intelligent vehicles is a
challenge for both the researchers and the vehicle
constructors. In such vehicles with driving assistance
systems on board, an important aspect is related to
the obstacles detection, tracking and classification.
Pedestrians are the most vulnerable participants
involved in traffic. Distinguishing the pedestrians
from the other traffic obstacles (Dollar et al., 2012)
is obviously very important for protecting them by
alerting the driver in case of a dangerous situation.
In other case of an imminent impact, if the vehicle
has special protection artifacts they should be
automatically triggered, for example a special
external airbag of the vehicle is opened to attenuate
the impact with the pedestrian.
The main objective is to reliably detect
pedestrians and after that to protect them. The false
positive rate should be very low in order not to cause
false alarms to the driver nor falsely trigger the
vehicle’s protection parts. Finding the pedestrians
that appear in the traffic scenarios is a requirement
that almost every safety driving assistance system
must have.
Pedestrian detection is a very simple problem for
humans but it is a complex one for driving assistance
systems due to the large variations of pedestrians
body poses, clothing, accessories which they are
carrying and due to the variations of background
scene, the environment conditions, the distance to
the acquisition cameras and their resolution, the
unpredictable vibrations of the intelligent vehicle
and scene cluttering. An important aspect is that the
pedestrian detection should be done in real time and
this aspect makes the detection a very complex
process which needs many efficient and robust
algorithms.
Driving assistance systems may be used in
different traffic scenarios. In highway scenarios, the
scene is relatively simple, the pedestrians are almost
missing and the obstacles that appear in the traffic
are limited to cars, trucks, poles and road-side
fences. An opposite scenario is the urban traffic
where the pedestrian detection problem becomes
much more difficult due to the environment
complexity and the presence of different objects
types.
There are many different technologies (Gandhi
and Trivedi, 2006) such as LIDAR, RADAR, ultra-
131
Giosan I. and Nedevschi S..
Multi-feature Real Time Pedestrian Detection from Dense Stereo SORT-SGM Reconstructed Urban Traffic Scenarios.
DOI: 10.5220/0004722901310142
In Proceedings of the 9th International Conference on Computer Vision Theory and Applications (VISAPP-2014), pages 131-142
ISBN: 978-989-758-004-8
Copyright
c
2014 SCITEPRESS (Science and Technology Publications, Lda.)

sound sensors, infrared sensors (Fardi et al., 2005),
LASER-scanners, piezo-electrical sensors and mono
(Dollar et al., 2012), color, stereo (Keller et al.,
2011b) cameras (Gavrila et al., 2004) that are widely
used for acquiring the traffic environment
information. However, the images acquired with
video cameras have rich information and it’s a
passive and clean way because it doesn’t affect the
environment or people and doesn’t imply any source
of pollution.
Due to the fact that the urban traffic scenarios
are very complex with many kinds of obstacles, we
choose a stereo-vision sensor for scene images
acquisition. The stereo sensor offers us the
possibility to accurately determine the depth
distance value for the scene points and further to
assign motion vectors to them. The SORT-SGM
stereo reconstruction (Pantilie and Nedevschi, 2012)
implemented on GPU has the advantage of
providing a dense stereo depth map with high
accuracy in a short processing time. The depth map
is denser and more accurate than the one obtained
with a local matching technique implemented on a
classic hardware stereo-machine (Woodlill et al.,
2004). Using both accurate 3D pixels positions and
their associated optical flow motion information
significantly improves localization and
representation of scene obstacles which finally leads
to a better classification of pedestrians or other
obstacles.
We present a complete solution for pedestrian
detection system starting from images acquisition,
3D points’ computation, obstacles detection and
tracking, novel and accurate features extraction due
to the stereo reconstruction and ending with the
classification of obstacles in pedestrians or non-
pedestrians.
A first comparison is made between the
classification results obtained by using the SORT-
SGM GPU implementation algorithm and a
hardware local matching approach for stereo
reconstruction. The second one compares the RF
classification results with other classifiers’ results.
We emphasize the better RF classification results
obtained when considering the SORT-SGM
reconstructed obstacles.
2 RELATED WORK
A lot of research work has been performed for
developing smart modules used in driving assistance
systems or surveillance applications for robust
pedestrian tracking and classification. Basically, the
general architecture of a stereovision pedestrian
detection system (Nedevschi et al., 2007) consists of
the following three main modules: candidates
(obstacles) detection and localization (Llorca et al.,
2012) based on 3D points grouping (Pocol et al.,
2007) and density maps (Nedevschi et al., 2009);
motion detection and candidates tracking (Danescu
et al., 2007), (Bota and Nedevschi, 2011a);
candidates classification in pedestrians and other
classes (Bota et al., 2009).
In 2D image space, each scene obstacle could be
represented as a set of blobs. This model has the
disadvantage that the entire obstacle bounding box
that is formed by combining all the blobs may be
wrongly defined due to common occlusions and can
also lead to erroneous tracking across a sequence of
frames. In this manner, the candidate pedestrians’
parameters estimation using a Kalman filter is
described in (Masoud and Papanikolopoulos, 2001).
The 3D geometry of a moving obstacle may partially
solve the occlusion issue, but it has the disadvantage
that it is very time consuming so it can’t be used in
case of detailed geometric obstacle models. In
(Koller et al., 1993) the issue of partial obstacle
occlusion is solved by computing their
corresponding 3D models. A quadratic
unconstrained binary optimization (QUBO)
framework for reasoning about multiple object
detections with spatial overlaps may also be used in
order to solve the pedestrian detection occlusion
problem (Rujikietgumjorn and Collins, 2013).
Computing the motion correspondence for each
obstacle is also important (Javed and Shah, 2002).
The obstacle’s size and position is used with Kalman
predictors (Stauffer and Grimson, 2000) in order to
correctly estimate as much as possible its real
trajectory. In case that the objects types are
pedestrians a set of appearance models representing
body-silhouettes can be used for their tracking
(Haritaoglu et al., 2000). Probabilistic objects
appearance models were used as well in (Elgammal
et al., 2002) for pedestrian detection and tracking.
Probabilistic tracking approaches (Bregler, 1997)
decompose the pedestrians’ motion in video
sequences in order to learn and recognize their
attitudes. A simple tracking (Lipton et al., 1998)
based both on temporal differencing and image
template matching is used. It has high tracking
performance in case of partial occlusions presence
and it achieves also a good classification.
Different approaches are proposed in literature
for pedestrian detection but the problem of achieving
an accurate and robust classification in complex
traffic scenarios is still far from being solved.
VISAPP2014-InternationalConferenceonComputerVisionTheoryandApplications
132

Usually, a set of discriminant features are considered
for classifying the obstacles in pedestrians and non-
pedestrians.
The obstacle contour is a good feature for
pedestrian detection (Hilario et al., 2005) because it
eliminates most of the issues, briefly presented in the
introduction, which could lead to weak detection
(high false positive and false negative rates). The
contour clearly describes the shape of the obstacle
and it is invariant for pedestrians’ clothing variety
and scene illumination. Scene obstacles are usually
matched against a set of pedestrian contour
templates in order to determine if they are
pedestrians or not. A method for pedestrian
detection using a pattern matching with a hierarchy
of contour templates is presented in (Gavrila and
Philomin, 1999). Pedestrian detection based on
shapes and edges, using monocular vision is
described in (Broggi et al., 2000). A hierarchy of
pedestrian contours reduces the search space,
achieving a real-time matching process between the
pedestrian candidate contour and the pedestrian
contours templates. Such pedestrian detection
systems using contour templates are proposed in
(Gavrila, 2000), (Gavrila and Munder, 2007) and
(Nedevschi et al., 2009).
A pedestrian detection method based on local
multi-scale oriented gray-levels differences,
obtained by computing the Haar wavelet transform
and using a SVM classifier is described in
(Papageorgiou and Poggio, 2000). A robust and
complete pedestrian detection system that uses
stereo depth segmentation, shape chamfer matching,
neural networks for texture classification and stereo-
based tracking and verification is presented in
(Gavrila et al., 2004).
Shape structural extraction and tracking, like the
legs and their symmetry detection using
morphological operators are used for pedestrian
detection and described in (Havasi et al., 2004). In
(Hilario et al., 2005) an active contours approach is
used for pedestrian segmentation and stereovision
for guiding the active contour to its appropriate
location.
Pattern matching pedestrian detection method is
limited to the image intensity information (Gavrila,
2000). Other features classification approaches such
as Adaboost classifiers are also widely used for
achieving an improvement in the pedestrian
detection (Khammari et al., 2005). Gray-levels
features are also used for the detection of image
regions having a significant amount of vertical edges
(Broggi et al., 2000). They are considered as being
pedestrian candidates regions used further in the
obstacle classification process.
Many algorithms for obstacle classification
including pedestrians are proposed in literature, but
the problem of achieving a very good classification
result that can be successfully used in driving
assistance systems in complex traffic urban
scenarios is still far from being solved. In (Toth and
Aach, 2003) a feed-forward neural network is used
for distinguishing between vehicles, pedestrians, and
other background obstacles. SVM (Rivlin et al.,
2002) may also be used for pedestrians, vehicles and
animals classification. Another classifier using error
correction output is presented in (Lun et al., 2007)
and used for classification of cars, trucks, bikes,
pedestrians and groups of pedestrians. In (Javed and
Shah, 2002) a classifier that doesn’t need to be
trained with different obstacles is well used for
classification. In modeling the traffic environment,
we considered four main types of obstacles:
pedestrians, cars, poles and other objects.
Two algorithmic speed-ups, one for monocular
images and the other for stereo images achieve
pedestrian detections at 100 fps with very high
detection quality (Benenson et al., 2012). A
pedestrian detection benchmark from stereo images
with an evaluation methodology are described in
(Keller et al., 2011a). The benefits of stereovision
for ROI generation and localization are also
quantified.
Usually, the stereo-information comes to enrich
the image intensity information for achieving a
robust pedestrian detection. The dense stereo
reconstruction information obtained from local
matching methods is still noisy and has lower
confidence than intensity data. In (Gavrila et al.,
2004), a system used for pedestrian detection uses
the 3D information just for validating the
classification results. The SORT-SGM dense stereo
reconstruction (Haller and Nedevschi, 2010) offers a
higher accuracy of the 3D pixels information, so it
leads to accurate features extraction for obstacles
which determines a better pedestrian detection.
Multiple novel discriminant obstacle features are
extracted in order to train a classifier that detects the
pedestrians from the entire scene obstacle set. The
classifier is applied individually at each frame.
Unfortunately, the classification algorithms are not
powerful enough to accurately predict the obstacles’
classes (pedestrians vs. other obstacles) considering
just the current frame. A robust classification
tracking technique is used in order to achieve better
classification results across a sequence of frames.
Multi-featureRealTimePedestrianDetectionfromDenseStereoSORT-SGMReconstructedUrbanTrafficScenarios
133
3 PEDESTRIAN DETECTION
In this chapter, the entire architecture of the
pedestrian detection system, from image acquisition
to final classification, together with a briefly
description of each module input data, implemented
algorithms and output data is presented.
3.1 System Architecture
The pedestrian detection system architecture with all
its component modules and data flow is depicted in
Figure 1.
A driving assistance system based on computer
vision data processing which integrates a pedestrian
collision module is generally classified by the
cameras field of view, angular resolution, detection
range, range resolution, illumination type,
algorithmic complexity and hardware cost (Gandhi
and Trivedi, 2006).
The stereo-cameras images acquisition system
has wide field of view of about 68 degrees, with
medium angular resolution at 8 minutes of arc,
medium detection range at about 25m, as it is very
difficult to detect pedestrians beyond this distance,
due to the wide field of view we use. The range
resolution is high by taking advantage of 3D
information (2D grayscale left and right camera
images plus the depth information that is computed
with a stereo-matching algorithm rather than simply
inferred from a single monocular image) and a high
precision calibration procedure (Marita et al., 2006).
No active illumination techniques are used,
which we consider to be an advantage. Normal gray
levels cameras are used which lead to a medium
hardware cost. The entire acquisition system is
mounted inside a demonstrator vehicle.
Gray levels images, left and right cameras
images (with 512x383 pixels) of the traffic scene are
acquired with the above mentioned stereo vision
system.
An improved sub-pixel semi-global matching
method with Census transform as the matching
method is used in order to compute high accuracy
dense stereo reconstruction of the scene considering
the two input gray-levels images (Haller and
Nedevschi, 2010). NVIDIA GeForce GTX 580
video card and a corresponding parallel
implementation on the GPU offer us the possibility
of executing this complex algorithm in real time
obtaining high-accuracy results at sub-pixel. Figure
2 depicts a comparison between this approach and
an older one, that uses a hardware stereo machine
(TYZX) (Woodlill et al., 2004) with local
matching method for computing the depth map. In
the depth map each scene point encodes the distance
from the stereo pair of cameras, resulting a 3D set of
points (2D intensity levels and their corresponding
distances).
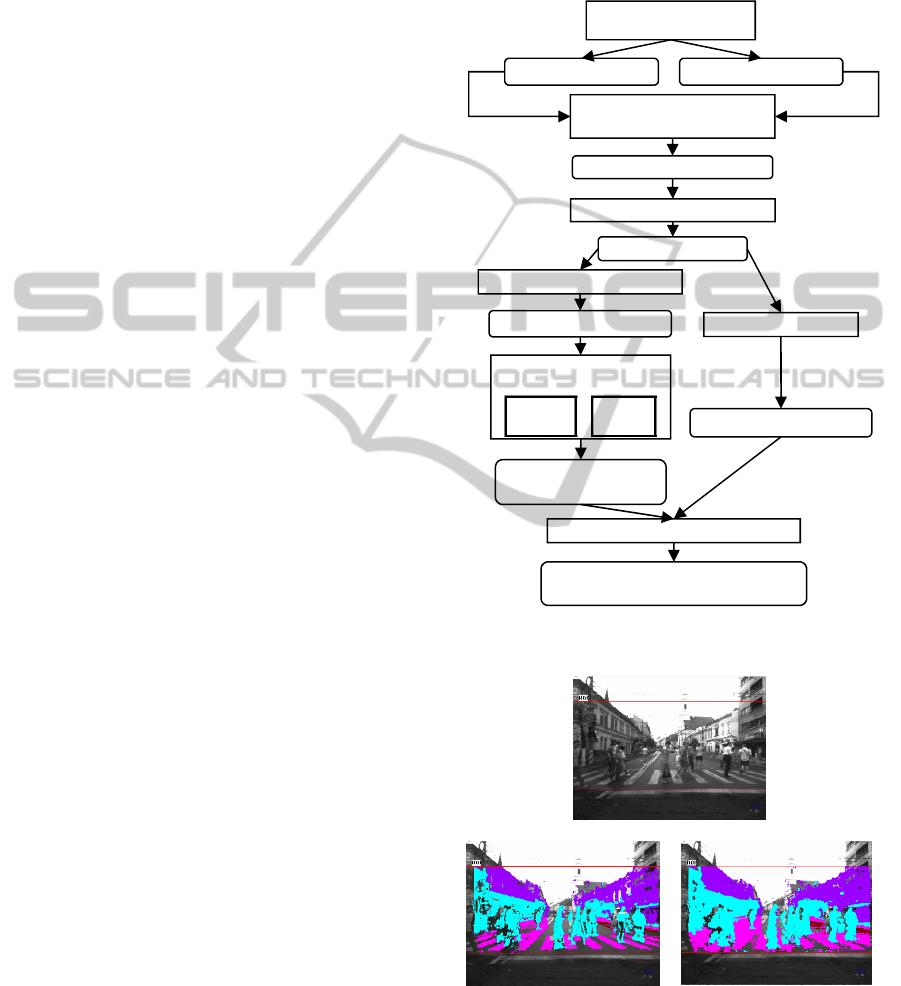
Figure 1: Pedestrian detection system architecture.
(a)
(b)
(c)
Figure 2: a) Example of a grayscale image acquired with
left camera; b) reconstructed points with TYZX;
c) reconstructed points with SORT-SGM on GPU.
In the reconstruction example shown in Figure 2
2D Left image 2D Right image
Local/Semi-global
matching
3D points (depth map)
Obstacles detection
3D bounding boxes
Multi-Feature extraction
Tracking
Obstacles features
Tracked obstacles
Multi-Feature
classification
Train
model
Apply
model
Frame classified
obstacles
k
-NN classification tracking
Classified obstacles
(p
edestrian/non-
p
edestrian
)
Stereo-cameras
images acquisition
VISAPP2014-InternationalConferenceonComputerVisionTheoryandApplications
134
there is a significant improvement in the number of
scene stereo-reconstructed points: about 61000
points obtained with TYZX and about 77000 points
with the GPU semi-global matching implementation.
Generally, we notice an increase of the 3D points
number with almost 25%.
First step in obstacles detection consist in
separating the foreground points (obstacle points)
from those belonging to the road or background. In
Figure 3 we notice that the computed foreground 3D
points situated on the obstacle (in this case a
pedestrian) are better obtained in case of using the
SORT-SGM GPU reconstruction instead of a TYZX
local matching approach.
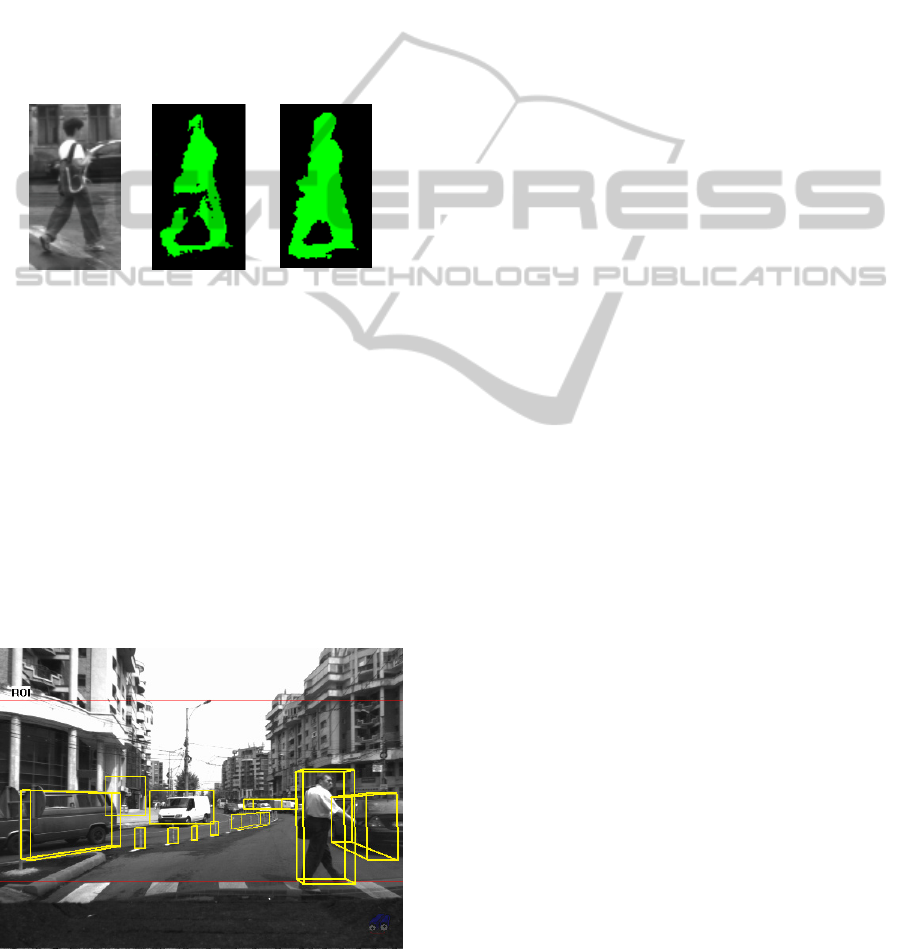
a) b) c)
Figure 3: a) A pedestrian closer view in 2D left image;
b) pedestrian’s 3D points with TYZX local; c) pedestrian’s
3D points with GPU SORT-SGM.
Second step of the detection algorithm is applied
on the previously computed depth map in order to
find and fit the 3D bounding boxes (oriented
cuboidal model) on all obstacles from the scene
image.
A multi-paradigm based on both vicinity of the
3D points which determine the occupied areas
(Pocol et al., 2007) and density maps (Nedevschi et
al., 2009) is used for computing the obstacles 3D
oriented bounding box. A set of segmented obstacles
is shown in Figure 4.
Figure 4: Urban traffic obstacles bounding boxes obtained
from stereo-reconstructed points.
An obstacle tracking algorithm (Bota and
Nedevschi, 2011b), based on dense stereo obstacle
points and optical flow information is then used. It
defines a probabilistic cuboidal model for objects
and uses a dynamic model differently adapted to
each class of obstacles. It deals with hierarchical
objects and the results shows that the tracking
algorithm improves the performance of obstacle
detection module.
3.2 Multi-Feature Extraction
In order to distinguish between pedestrians and all
the other obstacle classes that were considered (cars,
poles and other objects) we extract a vector of
features FV – equation (1) – based on both depth and
gray-levels information. In the following, all the
relevant features extracted in the feature vector are
briefly described and their distribution across classes
is depicted (color-class assignment is shown in
Figure 8).
,,, , , , , , , , ,FV H W L PM TD HS SX SZ AR AC HR HC
(1)
Due to the accurate stereo-reconstruction, the
obstacles dimensions, contours, surfaces, projections
are much more accurate and determine a feature
vector with accurate values closer to the ground
truth.
3.2.1 Obstacles Dimensions
The 3D bounding box obstacle dimensions (height
H, width W, length L) are firstly inserted in the
feature vector. We notice that the height feature
distinguishes cars and pedestrians from other classes
while width and length feature distinguish
pedestrians, poles and other obstacles from cars. An
obstacle is considered to be a pedestrian hypothesis
only if it has specific dimensions: height in range of
1m to 2m; width in range of 0.25m to 1m; aspect
ratio (height/width) in range of 1 to 4.
3.2.2 Template Pattern Matching Score
A novel pattern matching score PM (4) is computed
for every pedestrians hypothesis (Giosan et al.,
2009). A full body contour extraction algorithm is
applied on the projected foreground points of each
candidate pedestrian (Figure 3), resulting an exterior
continuous contour for that obstacle (Figure 7). The
matching is done between this contour and a
hierarchy H containing about N=1900 pedestrian
contour templates. The hierarchy is a multi-way tree
(Giosan and Nedevschi, 2009).
The matching process has two phases. First is a
Multi-featureRealTimePedestrianDetectionfromDenseStereoSORT-SGMReconstructedUrbanTrafficScenarios
135
contour-to-template matching: the contour C of the
hypothesis is superimposed on the templates T in the
pedestrian contour hierarchy. A Distance Transform
(DT) is applied on the template contour. A score
PM
CT
– equation (2) – is computed by summing the
pixels intensities (distances) in the template contour
DT image that lie below the contour hypothesis.
Second is a template-to-contour matching which is
similar to the first step and computes another score
PM
TC
– equation (3). The pattern matching score PM
– equation (4) – is considered as being the maximum
between those two scores. The lower the pattern
matching score, the higher is the probability for an
obstacle to be detected as being a pedestrian.
Match ,
i
CT i
PM C DT H T
(2)
Match ,
i
TC i
PM H T DT C
(3)
1,
TreeSearchMin Max ,
TiC CTi
iN
PM PM PM
(4)
It is clear that having an accurate sub-pixel semi-
global stereo-reconstruction algorithm (Figure 3b)
leads to a better fitting of the foreground points’
exterior contour to the real shape contour of the
obstacle and a more precise matching score.
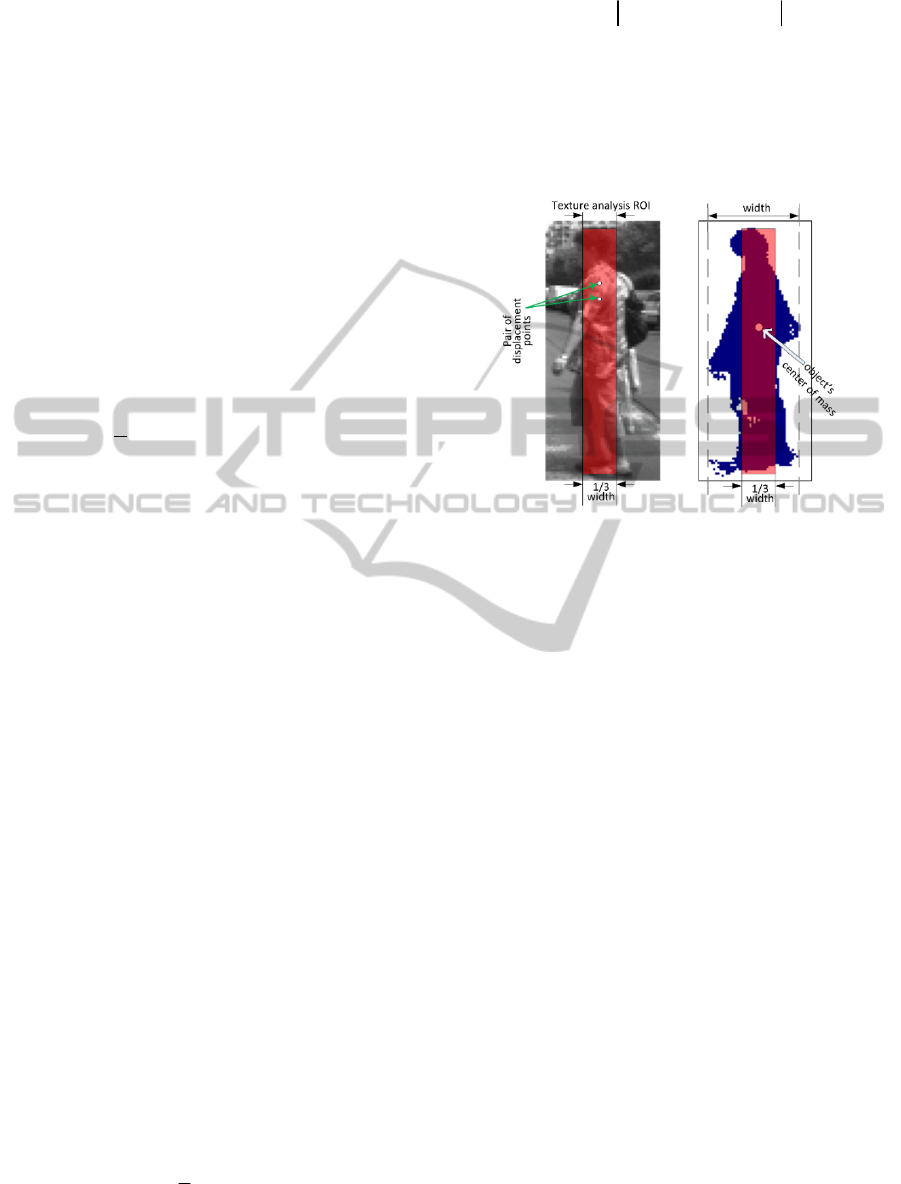
3.2.3 Texture Dissimilarity Score
The new texture dissimilarity score TD – equation
(5) – measures the maximum vertical dissimilarity
that can be found in the obstacle’s area. It is
computed considering a part of the 2D object image
which represents the middle vertical area of the
object. The projected 2D image coordinates of the
obstacle’s center of mass are computed by keeping
only the obstacle points (foreground points). The
texture analysis ROI considered (R) is the
rectangular area having 1/3 of the object 2D image
in width, the whole height of the 2D image, and it is
centered in the horizontal position of the center of
mass.
A set of vertical displacements V (1 to 5 pixels) is
considered to compute the gray level co-occurrence
matrix (Figure 5). The vertical texture dissimilarity
coefficient is computed for each vertical
displacement as being the average of the weighted
difference of intensities I from the co-occurrence
matrix. Finally the vertical texture dissimilarity is set
to the maximum of the previously computed
coefficients.
1,5
max
v
v
TD TD
(5)
(, ) ,
(,)
avg , ,
v
ij R
ivj R
TD I i j I i v j
(6)
The vertical texture dissimilarity has high values
for pedestrians due to their clothing and low values
for trees/poles due to their homogenous aspect. This
feature is successfully used for distinguishing
between pedestrians and poles/trees.
Figure 5: Texture analysis: a) ROI with its position, size
and an example of a pair of displacement points used for
co-occurrence computations; b) depth mask.
The score has high values for pedestrians due to
their textured clothing and low values for poles due
to their homogenous aspect. It is used for
distinguishing between pedestrians and poles/trees.
3.2.4 HoG Score
The HoG score HS is given by a set of trained
boosted classifiers. They operate on the 2D image
and for each obstacle hypothesis by computing the
histogram of oriented gradients (HoG) (Dalal and
Triggs, 2005). The HoG features are obtained by
dividing the 2D image corresponding to the
projected 3D cuboid surrounding the object, into
non-overlapping cells of equal dimension. A
weighted histogram of orientations is built within
each cell. The cells are then grouped in overlapping
blocks and the values of the histograms contained by
a block are normalized. A positive training set of
pedestrians and negative samples regions from
images containing other obstacles (Figure 6) are
used in order to train a cascade of boosted
classifiers. These classifiers offers a prediction score
which represents the value of the HoG score in our
feature vector.
VISAPP2014-InternationalConferenceonComputerVisionTheoryandApplications
136

Figure 6: Intensity images with pedestrian and other
obstacles divided in equal dimension cells used for HoG
computation.
3.2.5 Speed
The lateral speed (SX) and longitudinal speed (SZ)
are extracted for all kinds of obstacles using the
obstacle tracking module. They are less
discriminant, except the longitudinal speed that
sometimes can distinguish the pedestrians from
moving cars and other obstacles.
3.2.6 Distance and Surface Related
Measures
Novel features like area-root-distance AR – equation
(7) –and area-cube-distance AC – equation (8) – are
computed by multiplying the obstacles’ projection
area P
A
(expressed in pixels) into the left image with
the square root of its distance (D) from the cameras
and respectively with the cubic distance (expressed
in millimeters).
A
A
RPD
(7)
3
A
A
CPD
(8)
3.2.7 Humans’ Body Specific Features
Two features based on the upper part of the
obstacles are extracted. Usually the head of a human
is 1/7 height of the entire body. We model that 1/7
upper part as an ellipse and the rest of the body with
a rectangle (Figure 7c). The head-to-rest-body ratio
score HR – equation (9) – is obtained by dividing the
transverse diameter td of the ellipse with the width
of the rectangle rw. The other feature refers to the
head circularity HC – equation (10) – which clearly
separates the pedestrians from other classes. The
circularity is computed as being the thinness ratio of
the upper 1/7 region of the pedestrian.
24
Head
R
estOfBody
Area
td
HR
rw Area
(9)
2
4
Head
Head
Area
HC
Perimeter
(10)
a) b) c)
Figure 7: Pedestrian measures: a) intensity image with full
body contour and the ROI for contour circularity analysis;
b) depth mask; c) dimensions for modeling the head with
an ellipse and the body with a rectangle.
3.3 Multi-Feature Classification
In order to train a classifier, we extracted the feature
vector for a large set of obstacles with known
corresponding class (obtained through a manual
labeling procedure). A random forest classifier,
based on the dataset’s feature vectors, is built using
the WEKA machine learning tool.
We considered equal numbers of pedestrians and
other classes’ instances for classifier training
(Figure 8). Among other traditional classifiers like
AdaBoost, J48 trees, multilayer perceptron, the
random forest has the advantages of no need for
pruning trees, accuracy and variable importance
generated automatically, no overfitting, not sensitive
to outliers and missing data. The result is a random-
forest classifier model. This model is applied, frame
by frame, on the entire set of hypotheses contained
in that frame.
The classification pedestrian/non-pedestrian
result isn’t stable across frames. The feature vector
used in the classifier input for the same object is
changing from frame to frame. A k-NN
classification on the computed class values over the
last few frames is applied for improving the
accuracy and stability of the tracked obstacles across
multiple frames. We assume that the pedestrian
hypothesis is right classified in almost all frames
where it is tracked, but there are few frames where
the classification gets a wrong result. The objective
is to filter these wrong classifications and modify
them to the right class. The k-NN method is suitable
for accomplishing this task. Considering the value k
as being the number of last frames where the object
appeared in its tracks, and knowing the class W
f
that
is assigned for the object at frame f, we vote for each
class appearance in all k frames.
Multi-featureRealTimePedestrianDetectionfromDenseStereoSORT-SGMReconstructedUrbanTrafficScenarios
137

Figure 8: Uniform distribution of instances used for
building the classification model.
1
,
() (), 1,2
1,
()
0,
k
ifi
f
i
fi
C Pedestrian NonPedestrian
VC W C i
if hypotesis class is C in frame f
WC
otherwise
(11)
After computing all the votes in the last k frames
with equation (11), the hypothesis class index is
reassigned in current frame as being that class having
the maximum number of votes – equation (12).
1,2
arg max ( )
i
i
WVC
(12)
4 EXPERIMENTAL RESULTS
In this chapter we present the pedestrian detection
results achieved using the features and the
classification model previously described. All the
proposed algorithms were tested on sequences of
grayscale images with thousands of frames from
different traffic scenarios acquired with our stereo-
vision cameras system.
We have built a large database containing about
100000 obstacles (pedestrians, cars, poles, other
objects) together with their feature vector and their
class (assigned by manual labeling). The distribution
of all four classes is uniform (Figure 8).
The features distributions among classes are
depicted in Figure 9 (the class corresponding colors
are shown in Figure 8). There are features that are
weak discriminant between pedestrians and non-
pedestrians, but their contribution to the final
classification is significant. The most relevant
features are: obstacle dimensions, pattern matching
score, HoG score, texture dissimilarity, head-to-rest-
body and head circularity.
A comparative analysis about how the pedestrian
detection is affected by the dense stereo
reconstruction was done. We considered the TYZX
local matching reconstruction against SORT-SGM
GPU software implementation for computing the
depth of each scene point.
A random forest classifier with a number of k
random trees was trained for classifying the
obstacles (pedestrians/non-pedestrians). The trees’
depth is unlimited and a random selection of features
is used to split each node. A number of
2
log 1TNA
attributes was used in random
selection, where TNA=12 represents the total number
of attributes from the feature vector. The value of k
was found by analyzing the ROC curve (Figure 10)
among a set of experimental values. The value k=30
seems to achieve good results, generating a fast non-
oversized classifier model.
The advantage of the novel proposed features is
proven by experimenting the obstacles classification
with and without these features. Better results are
obtained with novel features (Table 1) than without
them (Table 2).
Multiple classifiers were considered in order to
emphasize the benefits of the random forest
classifier in this task. A comparison between the
pedestrian detection results obtained with random
forest and other classifiers like J48 trees,
AdaBoostM1, multilayer perceptron, RBF network
is presented in Table 3.
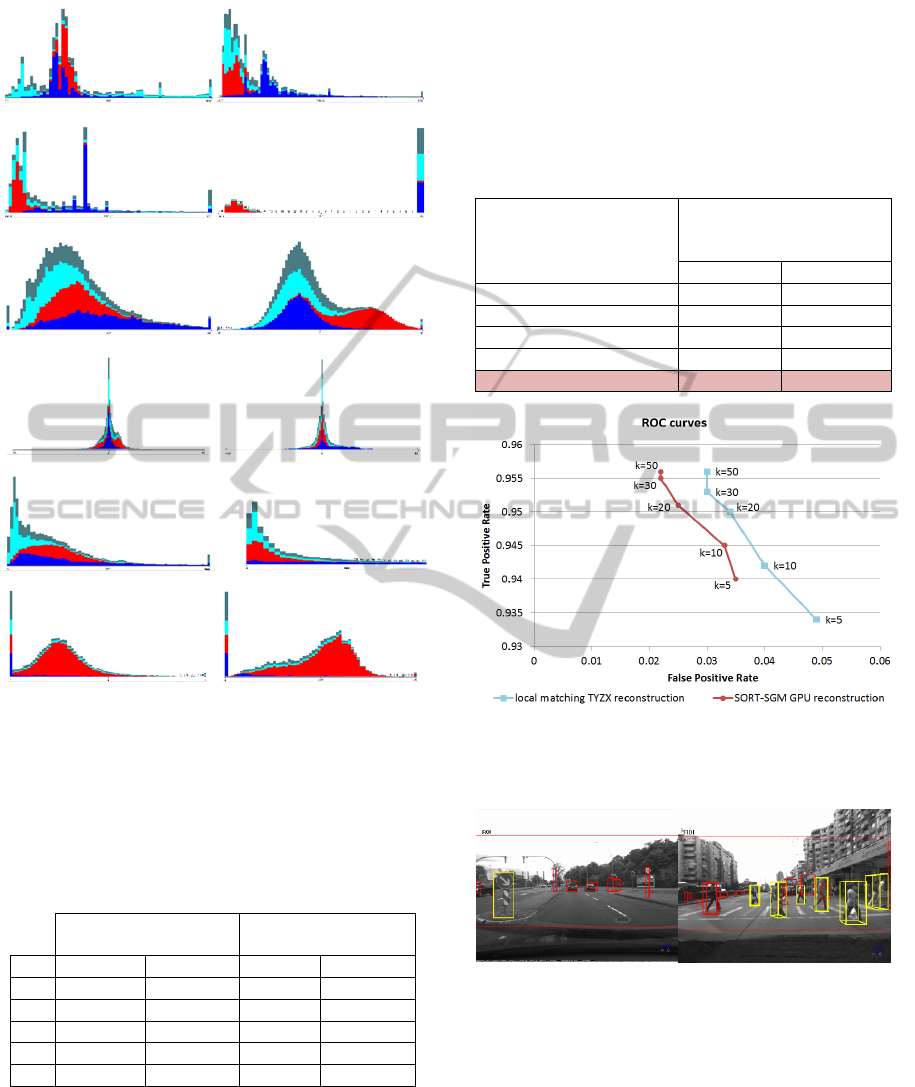
Table 1: Pedestrian detection results with novel features.
TYZX local matching
stereo reconstruction
SORT-SGM
stereo reconstruction
k FP rate TP rate FP rate TP rate
5 0.049 0.934 0.035 0.940
10 0.040 0.942 0.033 0.945
20 0.034 0.950 0.025 0.951
30 0.030 0.953 0.022 0.955
50 0.030 0.956 0.022 0.956
We evaluate the classifier using a stratified cross
validation with 10 folds. Statistically, using the
SORT-SGM instead of the local matching approach
and the proposed novel features, the pedestrian
detection was improved by about 2.6% in
false positive rate. This is very important for driving
assistance systems because the driver shouldn’t get
false alarms or the vehicle must not automatically
brake if there isn’t truly a pedestrian. The results are
comparable with the state of the art. In a stereo
approach (Keller et al., 2011b) the authors achieve a
detection rate of about 0.94 at 1 false positive per
frame. In a monocular vision survey (Dollar et al.,
2012) the best method achieves a detection rate of
about 0.85 at 1 false positive per frame.
VISAPP2014-InternationalConferenceonComputerVisionTheoryandApplications
138
a)
b)
c)
d)
e)
f)
g)
h)
i)
j)
k)
l)
Figure 9: Obstacle classes feature distributions
(pedestrians vs. poles, cars and others objects): a) height;
b) width; c) length; d) pattern matching score; e) texture
dissimilarity score; f) HoG score; g) lateral speed; h)
longitudinal speed; i) area-root-distance; j) area-cube
distance; k) head-to-rest-body ratio; l) head circularity.
Table 2: Pedestrian detection results without novel
features.
TYZX local matching
stereo reconstruction
SORT-SGM
stereo reconstruction
k FP rate TP rate FP rate TP rate
5 0.064 0.913 0.051 0.920
10 0.059 0.923 0.050 0.930
20 0.051 0.933 0.042 0.936
30 0.048 0.938 0.040 0.941
50 0.048 0.940 0.040 0.942
Although the true positive rate is not significantly
improved (about 1.5%), there are situations in
which a miss-detected pedestrian (by using a local
matching dense stereo approach) is now correctly
classified as being pedestrian. Samples of
classification issues solved by improving the dense
reconstruction with SORT-SGM are depicted in
Figure 11: in the left image a traffic road sign was
misclassified as pedestrian; in the right image the
left-most pedestrian was misclassified as being other
scene obstacle. Some classification final results are
presented in Figure 12.
Table 3: Random Forest vs. other classifiers results.
Classifier
Pedestrian detection
(SORT-SGM stereo
reconstruction)
FP rate TP rate
J48 trees 0.032 0.927
AdaBoostM1 0.084 0.932
Mutilayer perceptron 0.033 0.933
RBF network 0.036 0.891
Random forest (k=30) 0.022 0.955
Figure 10: Pedestrian detection ROC curves: local
matching reconstructed points vs. SORT-SGM
reconstructed points.
Figure 11: Samples obstacle misclassifications solved by
SORT-SGM (pedestrians with yellow color; other
obstacles with red color): left image – a false positive;
right image – a false negative.
5 CONCLUSIONS
We developed a real-time stereo-vision pedestrian
detection system that can be integrated as a module
in a driving assistance system. The intensity scene
Multi-featureRealTimePedestrianDetectionfromDenseStereoSORT-SGMReconstructedUrbanTrafficScenarios
139
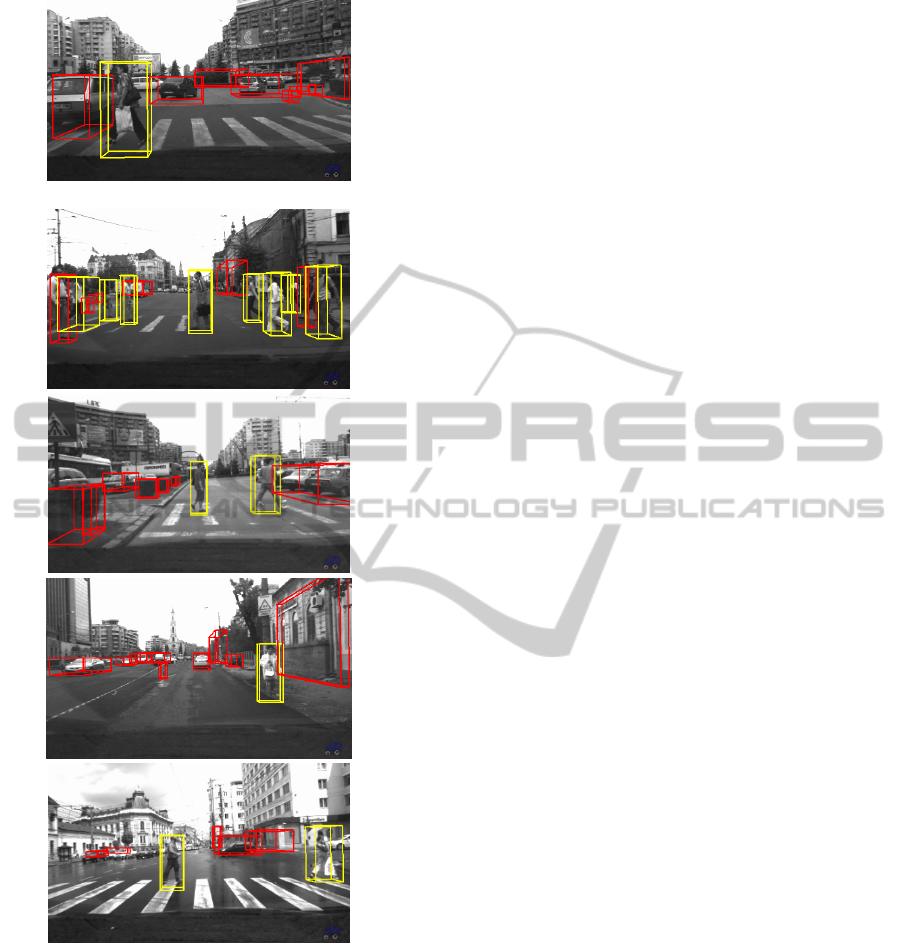
Figure 12: Classification results (pedestrians with yellow
color; other obstacles with red color).
points were acquired with two gray levels cameras
and the depth was obtained using a software
reconstruction with GPU (NVIDIA GeForce GTX
580) SORT-SGM algorithm. The quality and the
number of reconstructed points are higher and more
accurate than those obtained with a hardware stereo-
reconstruction machine TYZX which uses a local
matching approach.
We achieved better obstacle segmentation from
background when using SORT-SGM algorithm
instead of TYZX stereo-reconstruction, which leads
to a more accurate features vector (based on both
intensity and depth information). The introduced
novel features (texture dissimilarity, humans’ body
specific features, distance related measures, speed)
offer us a better pedestrian classification. All the
features were used for training a robust random
forest classifier model that can deal with feature
missing values. In case of the obstacles that were
successfully tracked across frames, a k-NN
classification tracking method was used for filtering
the spurious classification results that can appear for
the same obstacle from frame to frame.
Our pedestrian detection system is performing in
real-time (at about 25 fps) using the above
mentioned GPU and an Intel Core 2 Duo E6750
processor.
A solution for future improvement of the current
detection rate resides in the possibility of using color
cameras for scene acquisition which brings more
information, implementing a better reconstruction
algorithm on GPU and extracting new features that
will be combined for training a powerful classifier.
ACKNOWLEDGEMENTS
This paper was supported by the Romanian Agency
of Scientific Research in the “Multi-scale multi-
modal perception of dynamic 3D environments
based on the fusion of dense stereo, dense optical
flow and visual odometry information” project under
Contract PN-II-ID-PCE-2011-3-1086.
REFERENCES
Benenson, R., Mathias, M., Timofte, R. & Van Gool, L.
2012. Pedestrian detection at 100 frames per second.
IEEE Conference on Computer Vision and Pattern
Recognition (CVPR). pp. 2903-2910.
Bota, S. & Nedevschi, S. 2011a. Tracking multiple objects
in urban traffic environments using dense stereo and
optical flow. 14th International IEEE Conference on
Intelligent Transportation Systems. pp. 791-796.
Bota, S. & Nedevschi, S. 2011b. Vision based obstacle
tracking in urban traffic environments. IEEE
International Conference on Intelligent Computer
Communication and Processing (ICCP). pp. 231-238.
Bota, S., Nedevschi, S. & Konig, M. 2009. A framework
for object detection, tracking and classification in
urban traffic scenarios using stereovision. IEEE 5th
International Conference on Intelligent Computer
Communication and Processing. pp. 153-156.
VISAPP2014-InternationalConferenceonComputerVisionTheoryandApplications
140

Bregler, C. 1997. Learning and recognizing human
dynamics in video sequences. IEEE Computer Society
Conference on Computer Vision and Pattern
Recognition. pp. 568-574.
Broggi, A., Bertozzi, M., Fascioli, A. & Sechi, M. 2000.
Shape-based pedestrian detection. IEEE Intelligent
Vehicles Symposium. pp. 215-220.
Dalal, N. & Triggs, B. 2005. Histograms of oriented
gradients for human detection. IEEE Computer
Society Conference on Computer Vision and Pattern
Recognition. pp. 886-893 vol. 1.
Danescu, R., Nedevschi, S., Meinecke, M. M. & Graf, T.
2007. Stereovision Based Vehicle Tracking in Urban
Traffic Environments. Intelligent Transportation
Systems Conference. pp. 400-404.
Dollar, P., Wojek, C., Schiele, B. & Perona, P. 2012.
Pedestrian Detection: An Evaluation of the State of the
Art. IEEE Transactions on Pattern Analysis and
Machine Intelligence, 34, pp. 743-761.
Elgammal, A., Duraiswami, R., Harwood, D. & Davis, L.
S. 2002. Background and foreground modeling using
nonparametric kernel density estimation for visual
surveillance. Proceedings of the IEEE, 90, pp. 1151-
1163.
Fardi, B., Schuenert, U. & Wanielik, G. 2005. Shape and
motion-based pedestrian detection in infrared images:
a multi sensor approach. IEEE Intelligent Vehicles
Symposium. pp. 18-23.
Gandhi, T. & Trivedi, M. M. 2006. Pedestrian collision
avoidance systems: a survey of computer vision based
recent studies. Intelligent Transportation Systems
Conference. pp. 976-981.
Gavrila, D. 2000. Pedestrian Detection from a Moving
Vehicle. Proceedings of the 6th European Conference
on Computer Vision-Part II, pp. 37-49.
Gavrila, D. M., Giebel, J. & Munder, S. 2004. Vision-
based pedestrian detection: the PROTECTOR system.
IEEE Intelligent Vehicles Symposium. pp. 13-18.
Gavrila, D. M. & Munder, S. 2007. Multi-cue Pedestrian
Detection and Tracking from a Moving Vehicle.
International Journal of Computer Vision, 73, pp. 41-
59.
Gavrila, D. M. & Philomin, V. 1999. Real-time object
detection for “smart” vehicles.
Proceedings of the Seventh IEEE International
Conference on Computer Vision. pp. 87-93 vol.1.
Giosan, I. & Nedevschi, S. 2009. Building Pedestrian
Contour Hierarchies for Improving Detection in
Traffic Scenes. Proceedings of the International
Conference on Computer Vision and Graphics:
Revised Papers, pp. 154-163.
Giosan, I., Nedevschi, S. & Bota, S. 2009. Real time
stereo vision based pedestrian detection using full
body contours. IEEE 5th International Conference on
Intelligent Computer Communication and Processing
.
pp. 79-86.
Haller, I. & Nedevschi, S. 2010. GPU optimization of the
SGM stereo algorithm. IEEE International
Conference on Intelligent Computer Communication
and Processing (ICCP). pp. 197-202.
Haritaoglu, I., Harwood, D. & Davis, L. S. 2000. W4:
real-time surveillance of people and their activities.
IEEE Transactions on Pattern Analysis and Machine
Intelligence, 22, pp. 809-830.
Havasi, L., Szlavik, Z. & Sziranyi, T. 2004. Pedestrian
Detection Using Derived Third-Order Symmetry of
Legs. Proceedings of the IEEE International
Conference on Computer Vision and Graphics, pp. 11-
17.
Hilario, C., Collado, J. M., Armingol, J. M. & Escalera, A.
D. L. 2005. Pedestrian detection for intelligent
vehicles based on active contour models and stereo
vision. Proceedings of the 10th international
conference on Computer Aided Systems Theory, pp.
537-542.
Javed, O. & Shah, M. 2002. Tracking and Object
Classification for Automated Surveillance.
Proceedings of the 7th European Conference on
Computer Vision-Part IV, pp. 343-357.
Keller, C. G., Enzweiler, M. & Gavrila, D. M. 2011a. A
new benchmark for stereo-based pedestrian detection.
IEEE Intelligent Vehicles Symposium (IV). pp. 691-
696.
Keller, C. G., Enzweiler, M., Rohrbach, M., Fernandez
Llorca, D., Schnorr, C. & Gavrila, D. M. 2011b. The
Benefits of Dense Stereo for Pedestrian Detection.
IEEE Transactions on Intelligent Transportation
Systems, 12, pp. 1096-1106.
Khammari, A., Nashashibi, F., Abramson, Y. & Laurgeau,
C. 2005. Vehicle detection combining gradient
analysis and AdaBoost classification. Proceedings of
Intelligent Transportation Systems. pp. 66-71.
Koller, D., Danilidis, K. & Nagel, H.-H. 1993. Model-
based object tracking in monocular image sequences
of road traffic scenes. International Journal of
Computer Vision, 10, pp. 257-281.
Lipton, A. J., Fujiyoshi, H. & Patil, R. S. 1998. Moving
target classification and tracking from real-time video.
Fourth IEEE Workshop on Applications of Computer
Vision. pp. 8-14.
Llorca, D. F., Sotelo, M. A., Hellín, A. M., Orellana, A.,
Gavilan, M., Daza, I. G. & Lorente, A. G. 2012. Stereo
regions-of-interest selection for pedestrian protection:
A survey. Transportation research part C: emerging
technologies, 25, pp. 226-237.
Lun, Z., Li, S. Z., Xiaotong, Y. & Shiming, X. 2007. Real-
time Object Classification in Video Surveillance
Based on Appearance Learning. IEEE Conference on
Computer Vision and Pattern Recognition. pp. 1-8.
Marita, T., Oniga, F., Nedevschi, S., Graf, T. & Schmidt,
R. 2006. Camera Calibration Method for Far Range
Stereovision Sensors Used in Vehicles. IEEE
Intelligent Vehicles Symposium. pp. 356-363.
Masoud, O. & Papanikolopoulos, N. P. 2001. A novel
method for tracking and counting pedestrians in real-
time using a single camera. IEEE Transactions on
Vehicular Technology, 50, pp. 1267-1278.
Nedevschi, S., Bota, S. & Tomiuc, C. 2009. Stereo-Based
Pedestrian Detection for Collision-Avoidance
Multi-featureRealTimePedestrianDetectionfromDenseStereoSORT-SGMReconstructedUrbanTrafficScenarios
141

Applications. IEEE Transactions on Intelligent
Transportation Systems, 10, pp. 380-391.
Nedevschi, S., Danescu, R., Marita, T., Oniga, F., Pocol,
C., Sobol, S., Tomiuc, C., Vancea, C., Meinecke, M.
M., Graf, T., Thanh Binh, T. & Obojski, M. A. 2007.
A Sensor for Urban Driving Assistance Systems Based
on Dense Stereovision. IEEE Intelligent Vehicles
Symposium. pp. 276-283.
Pantilie, C. D. & Nedevschi, S. 2012. SORT-SGM:
Subpixel Optimized Real-Time Semiglobal Matching
for Intelligent Vehicles. IEEE Transactions on
Vehicular Technology, 61, pp. 1032-1042.
Papageorgiou, C. & Poggio, T. 2000. A Trainable System
for Object Detection. International Journal of
Computer Vision, 38, pp. 15-33.
Pocol, C., Nedevschi, S. & Obojski, M. A. 2007. Obstacle
Detection for Mobile Robots, Using Dense Stereo
Reconstruction. IEEE International Conference on
Intelligent Computer Communication and Processing.
pp. 127-132.
Rivlin, E., Rudzsky, M., Goldenberg, R., Bogomolov, U.
& Lepchev, S. 2002. A real-time system for
classification of moving objects. 16th International
Conference on Pattern Recognition. pp. 688-691
vol.3.
Rujikietgumjorn, S. & Collins, R. T. 2013. Optimized
Pedestrian Detection for Multiple and Occluded
People. IEEE Conference on Computer Vision and
Pattern Recognition. pp. 3690-3697.
Stauffer, C. & Grimson, W. E. L. 2000. Learning patterns
of activity using real-time tracking. IEEE Transactions
on Pattern Analysis and Machine Intelligence, 22, pp.
747-757.
Toth, D. & Aach, T. 2003. Detection and recognition of
moving objects using statistical motion detection and
Fourier descriptors. 12th International Conference on
Image Analysis and Processing. pp. 430-435.
Woodlill, J. I., Gordon, G. & Buck, R. 2004. Tyzx
DeepSea High Speed Stereo Vision System. IEEE
Conference on Computer Vision and Pattern
Recognition Workshop. pp. 41-41.
VISAPP2014-InternationalConferenceonComputerVisionTheoryandApplications
142
