
Influence of Electric Bicycle Usage on Biker Effort
On-road Monitoring Application in Lisbon, Portugal
Magno Mendes, Gonçalo Duarte and Patrícia Baptista
IDMEC, Instituto Superior Técnico, Universidade de Lisboa, Av. Rovisco Pais, 1, 1049-001 Lisboa, Portugal
Keywords: Physiological Signals, Heart Rate, Electric and Conventional Bicycles Monitoring.
Abstract: Bicycle use in urban environments is an alternative mobility option, which enables people to travel longer,
faster and with less effort than walking, with low environmental impacts. The use of electric bicycles (EB)
has risen as another possibility to promote a more efficient transportation use. However, the quantification
of the real impacts for the biker of shifting from conventional (CB) to EB is not yet quantified. This
research work aims at estimating the impacts on physiological signals, namely, on heart rate, from using EB
instead of CB, using a suitable methodology for on-road bio-signals data analysis. The on-road monitoring
of 6 bikers, 2 routes and 3 bicycles in Lisbon presented a 57% average reduction in HR variation from using
EB, since under high power demanding situations, the electric motor attenuates human effort. It was also
possible to estimate the energy expenditure associated to the human effort that results from using the
bicycles. For the CB the total energy spent reaches 70 Wh/km, while the EB presents 51 Wh/km of
human energy (28% lower than the CB) and 9 Wh/km of electricity consumption, resulting in a total of
60 Wh/km. Consequently, the total energy per km is 14% lower in the EB compared to the CB.
1 INTRODUCTION
The transportation sector faces increasingly
demanding energy consumption and emissions
standards representing 33% of the final energy
consumption, with the road transportation sector
being responsible in 2011 for 82% of that energy
consumption (EUROSTAT, 2013).
One alternative to reduce the impact of the
transportation sector, particularly in urban
environments, is to decrease the demand for energy
intensive modes of transportation and by promoting
alternatives that can provide a cheaper, less noisy
and more sustainable alternative than a day-to-day
car commute. Generally, three alternative
transportation models can be identified: public
transportation systems (bus, trains, subway systems
and others), vehicle sharing schemes (such as cars or
bicycles), and alternative transportation modes such
as walking, private bicycles or others (Wang, 2011).
From these different alternatives, the use of bicycles
is one of the more advantageous as it allows the
users to move at significant speeds for short
distances (typical in urban environments), resulting
in no emissions and having health benefits (Lindsay
et al., 2011).
Using bicycles enables people to travel longer,
faster and with less effort than walking, while
having a low impact on environment, thus making it
an efficient transportation mode for urban mobility.
As a result, the importance of cycling has been
increasing worldwide (Freemark, 2010; Urban
Audit). In many developing countries, namely in
Asia, two-wheelers are a first affordable step
towards individual mobility. In European and
American cities, the deployment of city bike ways
infrastructure has also been increasing, with bike
sharing systems deployed having in average 200 km
of bike lanes (Baptista, 2013).
Concerning the use of bicycles on urban
environments, a growing number of cities have been
trying to integrate them in the daily mobility of their
citizens, which for some countries has resulted in a
significant share of trips being done using a bicycle,
such as the Netherlands (26%), Denmark (18%) and
Germany (10%) (Buehler and Pucher, 2012). In the
city of Amsterdam, 38% of all trips in 2008 were
made using a bicycle, with 50% of Amsterdam’s
residents riding a bike daily and 85% riding it at
least once a week (Gardner, 2010).
While the use of conventional bicycles in an
urban context has been promoted with significant
success in several cities, namely Paris and London
with 25000 and 8000 deployed bicycles respectively
265
Mendes M., Duarte G. and Baptista P..
Influence of Electric Bicycle Usage on Biker Effort - On-road Monitoring Application in Lisbon, Portugal.
DOI: 10.5220/0004701202650274
In Proceedings of the International Conference on Physiological Computing Systems (PhyCS-2014), pages 265-274
ISBN: 978-989-758-006-2
Copyright
c
2014 SCITEPRESS (Science and Technology Publications, Lda.)

(Barclays Cycle Hire, 2012); (Lathia et al., 2012);
(Vélib, 2012), they still have several drawbacks that
hinder their widespread use. Some of the main
problems identified by people when using
conventional bicycles for urban transportation
include the difficulty to travel very long distances
and over hills, the possibility of arriving at a
destination, such as work, sweaty or tired (Dill and
Rose, 2012), being exposed to extreme cold or hot
climates, among others. Even some cities with
difficult topographies, such as Lisbon, have also
begun promoting the use of bicycles through the
creation of bike lanes and studying the possibility of
having bike sharing schemes (Galp Energia, 2012);
(Martinez et al., 2012).
Several of these issues can also be overcome
through the use of electric bicycles (Dill and Rose,
2012). Generally, it is expected that the use of
electric bicycles can help reduce the effort required
for performing trips as well as reduce travel time,
though at a higher cost due to the electric system and
the energy used.
One of the main applications of electric bicycles
is in bike sharing systems, with several systems
being deployed worldwide. The Callabike system in
Aachen, Germany, has recently deployed a fully
electric bike sharing system with 15 electric bicycles
(Callabike, 2012). The city of Kitakyushu in Japan
also presents a full electric system with 116 bikes
(The Bike-sharing Blog, 2011). Cities such as St.
Etienne and Poitiers in France present mixed
conventional and electric bike sharing systems with
a 15% and 26% ratio between electric and
conventional bicycles respectively (Cap'Vélo, 2012);
(VéliVert, 2012).
Both conventional and electric bicycles are
starting to be seen as a real option under urban
environments, however, the real impacts on human
efforts have not yet been accounted under real
operation. Also, despite the high expectations for
electric bicycles, very few studies have tried to
understand the real world benefits of such bicycles
in an urban environment.
Regarding environmental impacts, for instance,
in China the estimation of environmental impacts
comparing electric bicycles with other means of
transport (bus) (Cherry et al., 2009) remarks that
electric bikes, in a life cycle perspective which
includes the well-to-tank stage, have higher
emissions of SO
2
(due to burning coal for electricity
production) compared to a bus, however the
emissions of other pollutants are lower in electric
bike. As result, pollutant emissions are strongly
related to the energy mix. The emissions associated
with the production process of batteries, recycling
and "dump" are also a concern.
Considering the adoption of electric bicycles, the
benefits of using electrical technologies are not
unanimous (Cherry and Cervero, 2007). The
potential environmental impacts, interference with
traffic and safety issues, as well as the potential
conflict between users of electric bikes and
conventional is a concern, since the speed
differences during cycling can pose a problem (Dill
and Rose, 2012).
Therefore, in terms of conventional and electric
bicycle usage comparison (Baptista et al., 2013b), a
16% increase in average speed was verified in
electric bicycle over that achieved with the
conventional bicycle. Different usage strategies of
the bicycle were also identified: the first strategy of
using the electric bike is to use a high level of
electric assist on positive slopes (uphill conditions),
lowering the electric assistance levels for neutral and
negative slopes; in the second strategy, the rider uses
more electric assist on the positive slopes, assistance
decreases in negative slopes, and reaching the lowest
values in the plain areas; and the third strategy is to
always use a high level of service regardless of the
slope.
The biker driving dynamics represented by the
speed and acceleration, combined with road
topography, reflects in a power demand that must be
overcome either by the biker (in a CB) or by the
biker and/or the electric motor (in an EB). The
quantification of human effort during cycling can be
addressed (Parkin, 2011), using a formula that
includes variables such as speed, acceleration,
mechanical efficiency of the bicycle, among others.
The author states that the slope of the road
influences the energy spent by the cyclist, as well as
the number of stops. Just stopping at an intersection
can lead to an increase of 10% in energy
consumption.
An important issue is the quantification of the
amount of effort or energy that the rider expends to
complete a specific route. More importantly,
whether an electric bike will actually decrease the
effort or energy expended by the rider when
compared with a conventional bicycle is also an
issue. There is little work developed in this field and
it does not reflect real world use of conventional and
electric bicycles. Therefore, a method to estimate
human energy expenditure (EE) must be addressed.
This method must include physiological data that
can be related with energy expenditure and an
analysis that could use on-road, real-world operation
of electric and conventional bicycles.
PhyCS2014-InternationalConferenceonPhysiologicalComputingSystems
266

A strategy for quantifying the human effort is the
comparison between ventilation and heart rate as an
indicator of oxygen consumption during exercise
with different intensities (Gastinger et al., 2010). By
monitor individuals performing different tasks (such
as walking, walking carrying a certain load and
intermittent work), the authors concluded that the
most appropriate methodology is the heart rate to
determine the oxygen consumption. Another
possibility is a calorimeter indirect way versus heart
rate monitoring to evaluate energy consumption (Yu
et al., 2012). The authors state that for determining
energy consumption, in tasks of day-to-day, the two
methods have very similar values, 8.6 kcal/day.
However, the authors argue that the method of using
the heart rate, to determine the energy consumed in
the daily tasks, still needs improvements.
Accurate estimate of energy consumption
through the heart rate without individual calibration
laboratory can be performed (Pulkkinen et al.,
2005). The authors argue that the methodology
RR
IEST
where individual calibration of heart rate is
not necessary, provides an accurate and practical
way to estimate the power consumption.
The comparison of two techniques to estimate
the energy consumed, obtained by monitoring the
heart rate, and obtained by a portable
electromagnetic coil (Gastinger et al., 2012) allows
concluding that the determination of the energy
consumed using electromagnetic coil portable
system is more accurate than using only the heart
rate. The authors also report that would be
interesting to use together, heart rate and ventilation
on the determination of the energy consumed.
Several other techniques to determine the energy
consumed are available or being developed, with
particular reference to Doubly Labelled Water
(DLW) (Ainslie et al., 2003). In this study, the
authors argue that the methods used to determine the
power consumption depends on factors such as the
number of individuals monitored and the monitoring
period. The authors suggest that studies with few
participants and short analysis periods, should use
the method of indirect calorimeter to obtain best
results. However, for longer periods, around 3 to 4
days, it is preferable to use the method of DLW.
Although there are several techniques available,
the prediction of the energy consumed during
submaximal exercises could be done using heart rate
readings (Keytel et al., 2005). Through tests
conducted at 115 individuals in ergonomic bikes and
treadmills race, the authors established an equation
to determine the energy consumed by an individual
during exercise. This equation includes the
following variables: heart rate, age, sex and weight.
The authors claim that it is possible to determine
with good precision, the energy consumed using
only heart rate, age, sex and weight, and without the
need for individual calibration.
As can be seen, most of the techniques to
estimate human energy expenditure were performed
under controlled conditions – unlike the study
presented, but present solutions and correlations that
include signals such as heart rate that can be
collected while the bicycles are used.
According to this framework, the objectives of
this research work were to develop a methodology
based on physiological data collection under regular
bicycle operation. The goal was to evaluate the
application of conventional and electric bicycles for
urban mobility focusing on typical hilly routes of
Lisbon, quantifying their correspondent effect on
human energy expenditure.
2 METHODOLOGY
2.1 On-road Monitoring
The evaluation of electric and conventional bicycles
was done through the monitoring of trips performed
by 6 male different bikers (within the same age
range and physical characteristics), with each biker
travelling the same urban tour with both bicycles.
The bikers used the electric bicycle first and the
conventional bicycle after, with a minimum resting
period of 1 hour in-between.
The bicycles used by all bikers were the same, in
order to enable a fairer evaluation, although two
models of electric bicycles were evaluated. The
specifications of the three bicycles used are the
following:
Conventional bicycle (CB) (Orbita Aluminio):
weight of 15 kg, 21 gears;
Electric bicycle (EB1) (QWIC Trend2): power
assist electric bicycle with six levels of
assistance, 25.7 kg, 7 mechanical gears and a
detachable Li-ion battery with a 360 Wh
capacity, provided by Prio.Energy (Prio Energy,
2012); and
Electric bicycle (EB2) (Ekoway L1): power
assist/power on demand electric bicycle with
23 kg, 6 mechanical gears and a detachable Li-
ion battery with a 360 Wh capacity, provided by
EcoCritério (Eco-critério, 2013).
Each trip was monitored during the ride using a
monitoring laboratory designed to assess energy and
InfluenceofElectricBicycleUsageonBikerEffort-On-roadMonitoringApplicationinLisbon,Portugal
267

environmental impacts associated to non-motorized
modes, MoveLab. This laboratory was assembled by
the DTEA - Transport, Energy and Environment
research group of IDMEC – IST and corresponds to
a backpack weighting 12 kg that the user (pedestrian
or biker) carries, as shown in Figure 1.
a)
b) c)
Figure 1: MoveLab components and experimental
apparatus used for the real time monitoring (a), electric
bicycle (b) and conventional bicycle (c).
MoveLab is equipped with a GPS to record the
dynamic profile of the trip (including location,
altitude and speed), voltage and current probes to
assess the levels of electric assistance, and biometric
sensors (recording heart rate and breathing
intensity). All these equipment was carried by the
rider in the backpack. When asked to carry the
MoveLab backpack, the bikers saw no
inconvenience since in their daily routines they
already carry backpacks weighting around 5 to 8 kg.
All the MoveLab equipment is connected to a
laptop running a purposely developed software in
LabView to synchronize and record the data at 1 Hz,
throughout the trip. The technical description of the
equipment used is presented in Table 1.
Adding to the MoveLab, it was used bioPLUX
Research hardware and software acquiring
physiological data simultaneously. In order to
synchronize the two sources of data (LabView and
bioPLUX Research), a force sensor was adapted to
the numeric pad. This way, when the biker pressed
Enter, this signal was recorded either in LabView
and Plux software. Since the bio-signals require a
high frequency data logging, a minimum of 200
samples per second were collected while the biker
was riding. Due to the different temporal resolution
physiologic data was post processed into a second
by second time basis.
Table 1: Technical description of the equipment in
MoveLab.
Monitoring
equipment
Data acquired
Temporal
resolution of
data (Hz)
GPS (Garmin GPS
map 76CSx)
Speed (km/h), altitude
(m), location
1
Voltage and current
probes (Fluke i1010)
Voltage, current 1
bioPLUX Research
Heart rate, Breathing
rate
200
2.2 Data Collection and Processing
The GPS allows collecting speed, location and also
altitude information via an integrated barometric
altimeter. The altimeter was adequately installed
inside the backpack, avoiding pressure fluctuations
due to movement that could affect the readings. An
external antenna was used to avoid GPS signal
losses. Voltage probes were installed directly in the
bicycle battery terminals, while current
measurements were done on the circuit that connects
the battery to the electric motor. The signals
provided by the probes were collected by a National
Instruments DAQ board installed also on the
backpack. For battery voltage signal a voltage
divider circuit was placed before the DAQ board to
account for the 0-10 V limit of the acquisition
device. Both GPS and battery data were collected in
a PC using a program developed in LabView by the
authors to integrate the different communication
protocols (serial port and NMEA protocol for GPS
and analog data via USB port for the voltage and
current collected in the DAQ board) that allows to
synchronize the data, capturing all the equipment
readings in a 1 Hz basis. A solid-state disk PC was
used to avoid data loss while in motion.
The bioPLUX Research tool was used to collect
heart rate and breathing rate. This information was
collected at 200 Hz using PLUX software. Post
processing of data included the conversion of the
data to 1 Hz basis. It should be noticed that
breathing rate measured is very sensible to vibration
under regular bicycle operation, therefore it was
decided not to use this data.
PhyCS2014-InternationalConferenceonPhysiologicalComputingSystems
268

GPS readings of speed were used to post process
distance travelled, acceleration and road grade.
Altitude and distance were used to determine the trip
road grade using an algorithm that, for each point of
the trip, finds the points 50 m before and after and
uses this information to establish a second order
polynomial fit based on three points of distance and
altitude. The derivative of the polynomial fit in the
studied point allows determining road grade, which
is presented in rad.
Battery data was used to determine, at each point
of the trip, the power provided by battery to the
electric motor, according to the biker demands, and
integrate this data along the trip to find the
cumulative energy spent on the predefined tour.
With the data collected it is possible to
understand and quantify how riders changed their
use profile (in terms of speed and acceleration),
changing from a conventional bicycle to an electric
one. Also, the physiological impacts on the adoption
of an electric bicycle versus the conventional were
addressed using the physiological data, which also is
intended to provide an estimate of the human energy
expenditure.
2.3 Monitored Tours
To compare the use of conventional and electric
bicycles, round-trip tours of approximately 8.5 km
and 5.7 km were performed by each biker, in
Lisbon, with both bicycles. One of the tours
consisted on going from Instituto Superior Técnico
(IST) main campus to downtown Lisbon and back,
passing through the top of the Parque Eduardo VII
and Avenida da Liberdade on both ways. With this
tour, the bikers crossed different parts of the city of
Lisbon including traffic intensive avenues, side
roads with very little traffic and a street with a bike
lane. The other tour was carried in the EXPO 98
area, simulating a journey in a leisure place with low
traffic conditions. In terms of topography, the tours
had significant slopes, as summarized in Table 2.
Table 2: Selected routes.
Route
Distance
(km)
Average positive
slope (rad)
Average negative
slope (rad)
R1 8.54 0.037 -0.029
R2 5.66 0.020 -0.017
2.4 Methodology for Data Analysis
The analysis used in this work is based on Vehicle
Specific Power (VSP) to estimate the power demand
by vehicles, which combines speed (v), acceleration
(a) and road grade (). This methodology allows
comparing different technologies under similar
power requirements. It is traditionally used on light-
duty vehicles (Jiménez-Palacios, 1999) and its
generic definition, which includes the forces applied
to a moving body, is presented in Equation 1. The
coefficients of the equation are adjusted according to
the typology of vehicle monitored (Baptista et al.,
2013a). In this case, the coefficients used, adapted to
typical utility bicycles based on literature values
(Wilson, 2004), are presented in Table 3, obtaining
the bicycle specific power (BSP).
VSP
d
dt
E
E
F
∙
v
F
∙
v
m
∙
∙
1
∙
∙
(1)
Table 3: Coefficient values for the variables included in
BSP.
Variables Values
0.01
g (m/s
2
) 9.81
C
r
0.008
C
d
1.2
A (m
2
) 0.5
m
b
ic
y
cle
(kg) 18
m
b
ike
r
(kg) 70
a (kg/m
3
)
1.2
Using the respective coefficients, the BSP, in
W/kg) is defined by Equation 2:
∙
1.01∙ 9.81∙
0.078
0.0041∙
(2)
Similarly to the VSP methodology, the BSP is also
divided in modes that cover the full spectrum of the
bicycle operation, according to the following
formulation: group points with similar BSP values
(in W/kg); each BSP mode must include more than
1% of the total trip time, providing
representativeness for each mode; and the number of
modes is such that the total trip time is not
concentrated in a limited number of points.
Table 4 presents the modes (or bins) used in this
work and the respective range of power per mass.
Table 4: Binning method for BSP.
BSP mode Definition BSP mode Definition
<-4 BSP<-1 1 0≤BSP<1
-4 -4≤BSP<-3 2 1≤BSP<2
-3 -3≤BSP<-2 3 2≤BSP<3
-2 -2≤BSP<-1 4 3≤BSP<4
-1 -1≤BSP<0 >4 BSP>4
0 BSP=0
The percentage of time spent in each BSP mode
for the conventional and electric bicycles is
InfluenceofElectricBicycleUsageonBikerEffort-On-roadMonitoringApplicationinLisbon,Portugal
269
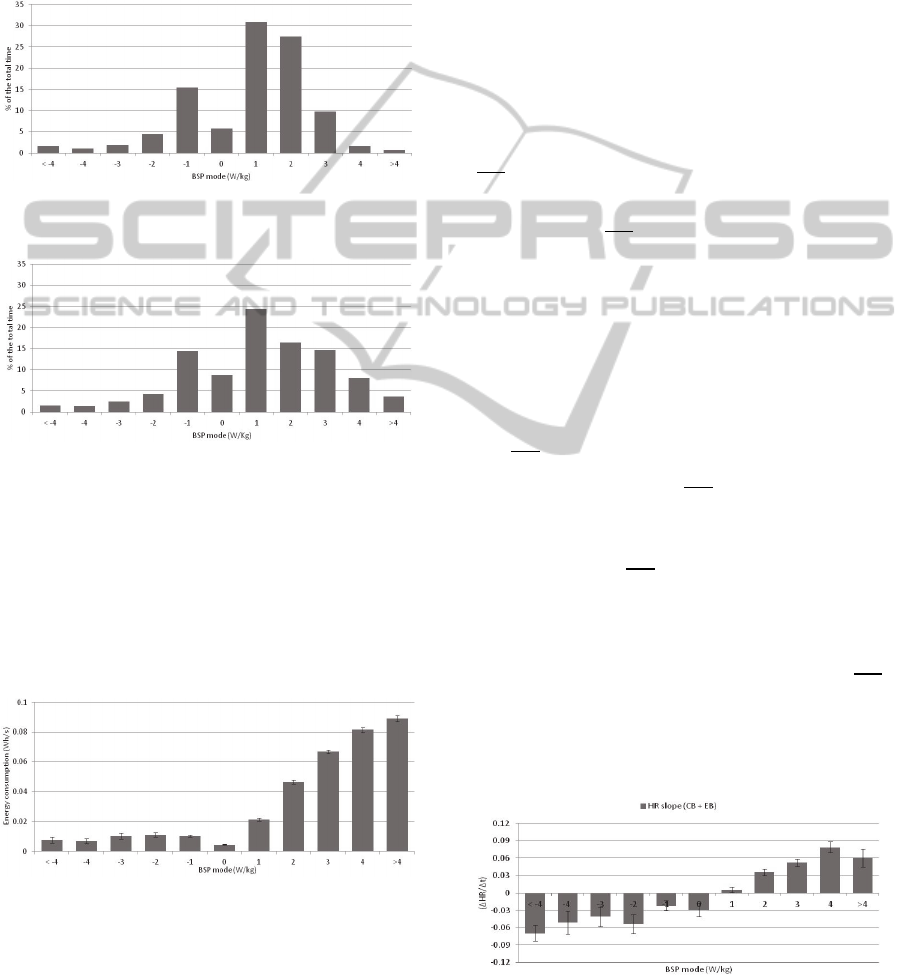
presented in Figure 2 and Figure 3. For negative
modes, the driving profile is very similar for both
bicycles. However, on positive BSP modes, the
electric bicycle present a higher share of time spent
in high BSP modes (higher power demands). This is
due to the electric assistance, which allows traveling
at high speeds on higher slopes and combinations of
higher speeds and acceleration, etc.
Figure 2: Time distribution (%) per BSP mode for
conventional bicycle.
Figure 3: Time distribution (%) per BSP mode for the two
electric bicycles.
Figure 4 presents the energy rate spent at each
BSP mode, on average, for the electric bicycles
studied, using the 1 Hz data from voltage and
current provided by the battery, measured under on-
road conditions. As expected, the energy rate
increases with BSP mode, showing the dominance
of electric assist on these modes.
Figure 4: Electricity consumption for the electric bicycles
as a function of BSP.
Although the data presented so far allows taking
conclusions about usage patterns of biker in EB and
CB, in both electric and conventional bicycles it is
necessary to determine the physiological impacts of
each technology and the respective human energy
expenditure to address the total energy impacts. The
Results section focus on the methodology developed
to assess this crucial part of the study.
3 RESULTS
Using the monitored heart rate data, the objective
was to correlate trip dynamic variables (traduced by
BSP) with HR variations. Hence, since BSP
aggregates trip information of speed, acceleration
and slope, its influence on heart rate was analyzed.
Additionally, since HR differ from person to person,
this analysis was done considering its derivate,
∆
∆
, and not its absolute value. Also, since HR is
an indirect unit of energy (as verified in the
Introduction),
∆
∆
traduces the variation of
Energy in a period of time, hence a measure of
Power.
Due to the existence of some noise in the HR
signal due to movement and vibration, the HR and
BSP second by second data was aggregated in a
minute by minute basis. In total, over 8 hour of data
was collected.
Figure 5 presents a clear relation between BSP
and
∆
∆
. For mode 0, that corresponds to the biker
stopped, a reduction in
∆
∆
is observed, which
means that the biker reduced his HR in this
condition, compared with the previous riding
condition (thus
∆
∆
0. For positive BSP
modes, which require more power from the biker,
positive variations in HR are observed due to the
increased human effort. As a result, for increasing
BSP modes, increasing positive variation in
∆
∆
are observed. BSP mode >4 has few riding data
points, which justifies its divergence. For negative
BSP modes, which usually correspond to braking or
descent situation, reductions in HR/s are observed.
Figure 5: Influence of BSP in (∆HR/∆t) for the total data
collected.
PhyCS2014-InternationalConferenceonPhysiologicalComputingSystems
270

The collected data was also disaggregated
according to conventional and electric bicycle.
Figure
6
presents the
∆
∆
average results according to the
usage of conventional or electric bicycle. Over
4 hours of data are represented both for electric and
conventional bicycles (considering the average of
two electric and conventional bicycles that were
monitored). The variations in HR/s are lower for the
electric bicycle. That is mainly visible in positive
BSP modes, where higher power demand is
observed. For the electric bicycle, having the electric
motor assistance, helps reducing the human effort
and, consequently, variations in HR/s are lower. For
negative BSP modes, that difference is not so
visible, with both bicycles leading to reductions in
HR. It should be noticed that for the highest BSP
mode, the trend is not followed due to the lack of
points to fully characterize those conditions.
Figure 6: Influence of BSP in (∆HR/∆t) for conventional
(gray) and electric bicycles (black).
In order to obtain an average HR variation at the
end of the trip, the temporal distribution of BSP was
multiplied by the HR variations. Table 5 presents the
average
∑
∆HR
for each type of bicycle. The
electric bicycle leads to lower values compared to
the conventional one, with an average 57%
reduction.
Table 5:
∑
∆HR
for CB and EB.
Bicycle
∆
EB 0.59
CB 1.37
The next step was to analyze the human energy
expenditure (EE) associated to each trip. This
corresponds to the energy spent by the biker to drive
the bicycle. According to the literature review
(Ainslie et al., 2003); (Gastinger et al., 2012);
(Keytel et al., 2005) this corresponds to an accurate
approximation to account with the energy the body
burns during physical activity. The estimation of EE
can be performed using the equations presented in
Table 6.
Table 6: Quantification of EE from HR.
Source EE
(Keytel et al.,
2005)
EE gender
55.09690.6309HR
0.1988 weigh
t
0.2017age
1gender
20.4022 0.4472
HR 0.1263 weight
0.074age
EE in kJ/min;HR in BPM; gender=1 for man and 2
for woman. In this study, all biker were male, with an
average age of 28 and average weight of 70 kg.
(Gastinger et
al., 2012)
EE 0.103HR 4.795
EE in kcal/min;HR in BPM
(Ainslie et al.,
2003)
EE 0.0056 HR
0.6908HR 26.532
EE in kJ/min;HR in BPM
Average
equation
.
.
The 3 equations presented can be represented
simultaneously to obtain Figure 7 and an average
equation was obtained (Table 6) that was used for
the purpose of this study.
Figure 7: EE as a function of HR.
Using the 8 hours of physiologic data (divided in
4 hours for CB and the remaining for EB) and
recurring to the obtained average equation (Table 6),
the EE value was estimated to each second of the
trip. The next logical step was to group points with
similar BSP conditions, to obtain a representative
EE value associated to each BSP mode. This data is
presented in Figure 8, with the gray bars
representing CB and the black bars representing the
EB.
Figure 8: EE per BSP mode for CB and EB.
Figure 8 presents the results of multiplying the EE
profiles (in Wh/s) by each trip BSP time distribution,
for EB and CB. This way, the EE (in Wh) for each
BSP mode is obtained. Adding the EE at each BSP
InfluenceofElectricBicycleUsageonBikerEffort-On-roadMonitoringApplicationinLisbon,Portugal
271

mode and dividing by the trip distance, an estimate
of the human energy expenditure per kilometer
(Wh/km) is assigned for each trip and technology
used (conventional or electric).
In order to obtain the total energy consumption
(human and electric), an approach similar to the one
described previously was used for estimating electric
use, according to the consumption profile
distribution from Figure 4, instead of Figure 8.
Figure 9 presents an estimate of the total energy
per kilometer (human plus electric in electric bicycle
and human only in conventional bicycle). For the
conventional bicycle the total energy is around
69.8 Wh/km, while the electric bicycle presents
50.6 Wh/km of human energy (less 27.5% compared
with conventional bicycle) and 9.2 Wh/km of
electric consumption, resulting in a total of
59.8 Wh/km. Therefore, the total energy per
kilometer is 14.3% lower in the electric bicycle than
in the conventional.
Figure 9: Total energy expenditure for CB and EB.
With the data collected, it was not possible to
effectively estimate the efficiency of the electric
motor and the human body while cycling. However,
it is possible to obtain a set of acceptable values for
those efficiencies. Therefore, it was assumed that to
travel the distance of one kilometer it is necessary
the same energy, independently of using the electric
and conventional bicycle (Eq. 3).
E
_
ε
EE
(3)
E
_
ε
EE
ε
Electricit
y
consumption
E
_
E
_
Where E
_
is the required energy for CB;
E
_
is the required energy for EB; ε
– is the
human body efficiency; ε
is electric motor
efficiency; EE
is the EE for CB; and EE
is the
EE for EB. Using to Eq 3 and assuming a range of
typical efficiency values for an electric motor,
between 60 to 95%, the range of human efficiency
can be estimated, as presented in Figure 10. As a
result, while cycling, the efficiency of human body,
theoretically, ranges from 30% to 45%.
Figure 10: Human efficiency versus electric motor
efficiency.
4 CONCLUSIONS
This research work addressed the use of
conventional and electric bicycles in real world
conditions, in order to estimate its impacts on
physiological signals, in more detail, in heart rate
and human energy expenditure. For this purpose a
methodology to express the power required to
overcome a drive cycle was adapted for bicycles,
resulting in the BSP methodology. The application
of this methodology used as basis data from the
monitoring of 6 bikers using both CB and EB, over
114 km in the city of Lisbon, Portugal, showing that
EB allow reaching higher BSP modes. However, the
developed methodology is not city or route specific
and can be applied elsewhere.
The impact on heart rate from shifting from
conventional bicycle usage to electric bicycle usage
was estimated. An average 57% reduction in HR
variations was found for the use of EB in typical
trips since, in high BSP modes that represent power
demanding situation, the electric motor comes in
action, avoiding human effort.
Moreover, a methodology was developed to
quantify the energy expenditure, based on heart rate
data measured under regular bicycle operation,
associated to the human effort that results from
using the bicycles. For the conventional bicycle the
total human energy expenditure reaches 70 Wh/km,
while the electric bicycle presents 51 Wh/km of
human energy (27.5% lower than the conventional
bicycle) and 9 Wh/km of electric consumption,
resulting in a total of 60 Wh/km. Consequently, the
total energy per kilometer is 14.3% lower in the
electric bicycle compared to the conventional.
In all, an innovative method of quantifying the
benefits for the biker of using electric bicycles was
developed, resulting in significant reduction in heart
rate variations, as well as, considerable energy
efficiency improvements. Using all the modal
information from Figures 4 and 8 regarding electric
PhyCS2014-InternationalConferenceonPhysiologicalComputingSystems
272

and human energy rates, combined with BSP modal
distribution for any route (as is presented in Figures
2 and 3), this methodology allows estimating the
total energy expenditure (human and electric),
electric autonomy, as well as HR variations,
according to the trip profile. As a result, this
methodology can be applied to evaluate the potential
use of EB in specific situation, namely bike-sharing
routes, providing significant support to bike-sharing
systems design and deployment.
ACKNOWLEDGEMENTS
The authors would like to acknowledge the sponsors
of the research: Prio.e and Eco-critério. Thanks are
also due to Fundação para a Ciência e Tecnologia
for the PhD and Post-Doctoral financial support
(SFRH / BPD / 79684 / 2011, SFRH / BPD / 62985 /
2009).
REFERENCES
Ainslie, P., Reilly, T., Westerterp, K., 2003. Estimating
Human Energy Expenditure, A Review of Techniques
with Particular Reference to Doubly Labelled Water.
Sports Med, 683-698.
Baptista, P., 2013. On-road Monitoring of Electric
Bicycles and its use in Bike-sharing Systems, in:
Silva, C. (Ed.), Grid Electrified Vehicles:
Performance, Design and Environmental Impacts.
Nova Science Publishers, Inc.
Baptista, P., Duarte, G., Mendes, M., Rolim, C., Farias, T.,
2013a. Scenarios for electric bicycle use: from on-road
monitoring to possible impacts of largeintroduction,
NECTAR Conference on Dynamics of Global and
Local Networks, São Miguel Island, Azores (Portugal).
Baptista, P., Pina, A., Duarte, G., Rolim, C., Pereira, G.,
Silva, C., Farias, T., 2013b. On road evaluation of
electric and conventional bicycles for urban mobility.
submitted to Transport Policy.
Barclays Cycle Hire, 2012. Barclays Cycle Hire -
Bikesharing in London.
Buehler, R., Pucher, J., 2012. Walking and Cycling in
Western Europe and the United States - Trends,
Policies, and Lessons. TR News May-June 2012:
Active Transportation: Implementing the Benefits.
Callabike, 2012. Callabike bike sharing system.
Cap'Vélo, 2012. Se déplacer à vélo en Grand Poitiers -
Bikesharing scheme in Saint-Etienne.
Cherry, C., Cervero, R., 2007. Use characteristics and
mode choice behavior of electric bike users in China.
Transport Policy 14, 247-257.
Cherry, C., Weinert, J., Xinmiao, Y., 2009. Comparative
environmental impacts of electric bikes in China.
Transportation Research Part D 14, 281–290.
Dill, J., Rose, G., 2012. E-bikes and Transportation
Policy: Insights from Early Adopters, 91th Annual
Meeting of the Transportation Research Board.
Eco-critério, 2013. http://www.ecocriterio.pt/.
EUROSTAT, 2013. Environment and Energy, EUROPA
Eurostat – Data Navigation Tree,
http://ec.europa.eu/eurostat.
Freemark, Y., 2010. Transit Mode Share Trends Looking
Steady; Rail Appears to Encourage Non-Automobile
Commutes, The Transport Politic.
Galp Energia, 2012. Ciclovias e percursos pedonais.
Gardner, G., 2010. Power to the Pedals. World Watch
Magazine 23.
Gastinger, S., Nicolas, G., Sorel, A., Sefati, H., Prioux, J.,
2012. Energy Expenditure Estimate by Heart-Rate
Monitor and a Portable Electromagnetic-Coil System.
International Journal of Sport Nutrition and Exercise
Metabolism, 117 -130.
Gastinger, S., Sorel, A., Nicolas, G., Gratas-Delamarche,
A., Prioux; J., 2010. A comparison between
ventilation and heart rate as indicator of oxygen uptake
during different intensities of exercise. Journal of
Sports Science and Medicine, 110-118.
Jiménez-Palacios, J., 1999. Understanding and
Quantifying Motor Vehicle Emissions with Vehicle
Specific Power and TILDAS Remote Sensing.
Massachusets Institute of Technology.
Keytel, L., Goedeck, J., Noakes, T., Hiiloskorpi, H.,
Laukkanen, R., Van Der Merwe, L., Lambert, E.,
2005. Prediction of energy expenditure from heart rate
monitoring during submaximal exercise. Journal of
Sports Sciences, 289 – 297.
Lathia, N., Ahmed, S., Capra, L., 2012. Measuring the
impact of opening the London shared bicycle scheme
to casual users. Transportation Research Part C:
Emerging Technologies 22, 88-102.
Lindsay, G., Macmillan, A., Woodward, A., 2011. Moving
urban trips from cars to bicycles: impact on health and
emissions. Australian and New Zealand Journal of
Public Health 35.
Martinez, L., Caetano, L., Eiró, T., Cruz, F., 2012. An
optimisation algorithm to establish the location of
stations of a mixed fleet biking system: an application
to the city of Lisbon, 15th Edition of the Euro Working
Group on Transportation, Paris.
Parkin, J., 2011. The importance of human effort in
planning networks, NECTAR Workshop Abstract.
Prio Energy, 2012. Prio Energy - Electric Mobility.
Pulkkinen, A., Saalasti, S., Rusko, H., 2005. Energy
expenditure can be accurately estimated from HR
without individual laboratory calibration, 52nd Annual
Meeting of the American College of Sports Medicine,
Nashville, Tennessee , USA.
The Bike-sharing Blog, 2011. Japanese Bike-share is
Electric.
Urban Audit, 2012. Urban Audit: Welcome to the Urban
Audit web site.
Vélib, 2012. Vélib - Bikesharing scheme in Paris.
VéliVert, 2012. VéliVert - Bikesharing scheme in Saint-
Etienne.
InfluenceofElectricBicycleUsageonBikerEffort-On-roadMonitoringApplicationinLisbon,Portugal
273

Wang, R., 2011. Autos, transit and bicycles: Comparing
the costs in large Chinese cities. Transport Policy 18,
139–146.
Wilson, D.G., 2004. Bicycling Science. The MIT Press.
Yu, Z., Völgyi, E., Wang, R., Ember, A., Wiklund, P.,
Alén, M., Tylavsky, F., Cheng, S., 2012. Comparison
of heart rate monitoring with indirect calorimetry for
energy expenditure evaluation. Journal of Sport and
Health Science, 178-183.
PhyCS2014-InternationalConferenceonPhysiologicalComputingSystems
274
