
Bilateral Motion Spectra
Analysis and Representation of Human Movement
Anthony Schultz
Department of Science and Dance, Sarah Lawrence College, One Mead Way, Bronxville NY, U.S.A.
Keywords:
Motion Capture Analysis, Pattern Recognition, Human Movement, Data Representation.
Abstract:
The body’s bilateral symmetry allows for various kinds of human motion patterns. Our paper presents a
method for analyzing and representing motion capture time series that effectively identifies spatial and tempo-
ral patterns. We develop a factored representation of joint angle data based on quaternions and a metric pair
for comparing different physical states of articulation. This metric pair is used to generate a metric space pair
over the set of time series states. The result is represented as a 2-dimensional color image termed a bilateral
motion spectrum. Several spectral motifs are presented and characterized.
1 INTRODUCTION
Motion capture is a standard form of acquiring kine-
matic data from human subjects using an animated
stick-figure model. Systems are available at a range of
price points from the consumer grade Kinect to more
elaborate multi-camera marker systems such as those
made by VICON. All motion capture systems provide
skeletal model joint angles in time series. The infor-
mational content of such high dimensional datasets
are challenging to represent in a concise and mean-
ingful way.
There has been extensive research in motion cap-
ture data processing. One such area of research pro-
cesses motion capture datasets with the goal of remix-
ing recorded libraries to generate novel movement se-
quences. A data structure known as a motion graph
is generated to determines how elements of given a
movement vocabulary may be sequenced in time. In
these research efforts recognition schemes are used to
compare frames of motion capture data to see where
different phrases of movement may be spliced to-
gether. If two frames match we can conceivably cut
from one sequence of motion to another thereby gen-
erating a novel movement sequence.
Mathematically speaking the similarity measure
between frames is termed a metric. It is a measure
of distance between two points in the configuration
space of the subject’s body. Analyzing a motion
sequence by comparing the similarity between each
frame and every other frame is a common process.
The output of this process is a metric space. Due to
its features we call this output a motion spectrum.
While motion spectra are typically a means to an
end, namely a way to construct the subject’s motion
graph, they are full of information about temporal fea-
tures of the underlying movement. Motion spectra
convey the rapidity of movement, when motions are
repeated and when they are executed in reverse. Our
review of the literature indicates there has not been
any research into characterizing human movements
by investigating their associated motion spectra.
This paper seeks to introduce such a line of re-
search. By enhancing motion spectra to include mea-
surements on the spatial and temporal symmetries of
motion capture sequences we generate a richer data
structure we call a bilateral motion spectrum. In
this paper we detail how to construct bilateral mo-
tion spectra, process example motion capture data and
characterize the resulting spectral motifs.
1.1 Motion Capture Data
Motion capture models the human body as set of rigid
element joined at points of articulation, or joints. This
model is known as a kinematic chain. The articulation
of each joint, represented by joint angles, uniquely
determines the state of kinematic model.
This work uses optical motion capture data which
is publicly available online from the Carnegie Mellon
Motion Capture Lab in the ASF/AMC format. The
kinematic chain model they use has a total of 62 de-
grees of freedom. The ASF data (Acclaim Skeleton
File) describes the geometry of the kinematic chain.
137
Schultz A..
Bilateral Motion Spectra - Analysis and Representation of Human Movement.
DOI: 10.5220/0004700401370144
In Proceedings of the International Conference on Physiological Computing Systems (PhyCS-2014), pages 137-144
ISBN: 978-989-758-006-2
Copyright
c
2014 SCITEPRESS (Science and Technology Publications, Lda.)

This includes the segment lengths and their linkage
hierarchy. The AMC data (Acclaim Motion Capture)
consists of the joint angles and the root coordinate
system position. Joint angles are reported by Euler
angle in XYZ order of rotation.
In the present treatment we use a simplified ver-
sion of the ASF model. We model the axial skeleton
with seven links. They are the pelvis (root), lower-
back, upperback, thorax, lowerneck, upperneck and
head. Each joint connecting these links is spherical
with three degrees of freedom. Off the pelvis we have
the left and right leg. Each is modeled with two links,
the femur and tibia. The femur having a spherical
joint (3 DOF) and the tibia having a revolute joint
(1 DOF). The left and right arm are measured in the
same way as the legs. They branch off the thorax link
of the axial skeleton with the humerus having a spher-
ical joint (3 DOF) and the radius having a revolute
joint (1 DOF).
1.2 Related Work
Using metric spaces of example movement data to
construct motion graphs is over a decade old. This
process was developed by (Arikan and Forsyth, 2002)
and (Kovar et al., 2002) and detailed by (Alankus,
2005) in a comprehensive thesis. The challenge in
building a motion graph is knowing where to splice
the motion capture threads together. There are various
metrics used for this purpose. Some are based solely
on joint angle which others are based on point clus-
ters. While some are more sophisticated than others
none use the metric spaces to characterize the motion
itself.
2 MATHEMATICS
2.1 Rotations
ASF data represents joint angle rotations using Euler
angles in XYZ order of rotation. The successive ro-
tations may be used to construct the overall rotation
matrix using matrix multiplication.
R
zyx
(θ
x
,θ
y
,θ
z
) = R
z
(θ
z
)R
y
(θ
y
)R
x
(θ
x
)
This method suffers from gimbal lock so it re-
quires reparameterization for our purposes. The ro-
tation matrix may be expressed as a single rotation θ
around the Euler pole vector
−→
ω using Equations 1 and
2. (Murray et al., 1994)
θ = cos
−1
trace(R) − 1
2
(1)
−→
ω =
1
2sinθ
r
32
−r
23
r
13
−r
31
r
21
−r
12
(2)
Using the terms θ and
−→
ω we can switch from ma-
trices to a more compact representation using quater-
nions. Quaternions are a 4-tuple consisting of a
real component q
0
and three imaginary components
q
1
i + q
2
j +q
3
k. The algebra of the imaginary compo-
nents follows is written in Equation 3.
ii = j j = kk = i jk = −1 (3)
The imaginary components may be written as a vector
−→
q so that the overall quaternion Q may be written as
in Equation 4.
Q =
q
0
−→
q
(4)
Quaternions may be be used to represent rotations us-
ing the Euler axis formalism as in Equation 5. (Mur-
ray et al., 1994)
q
0
−→
q
=
cos(θ/2)
sin(θ/2)
−→
ω
(5)
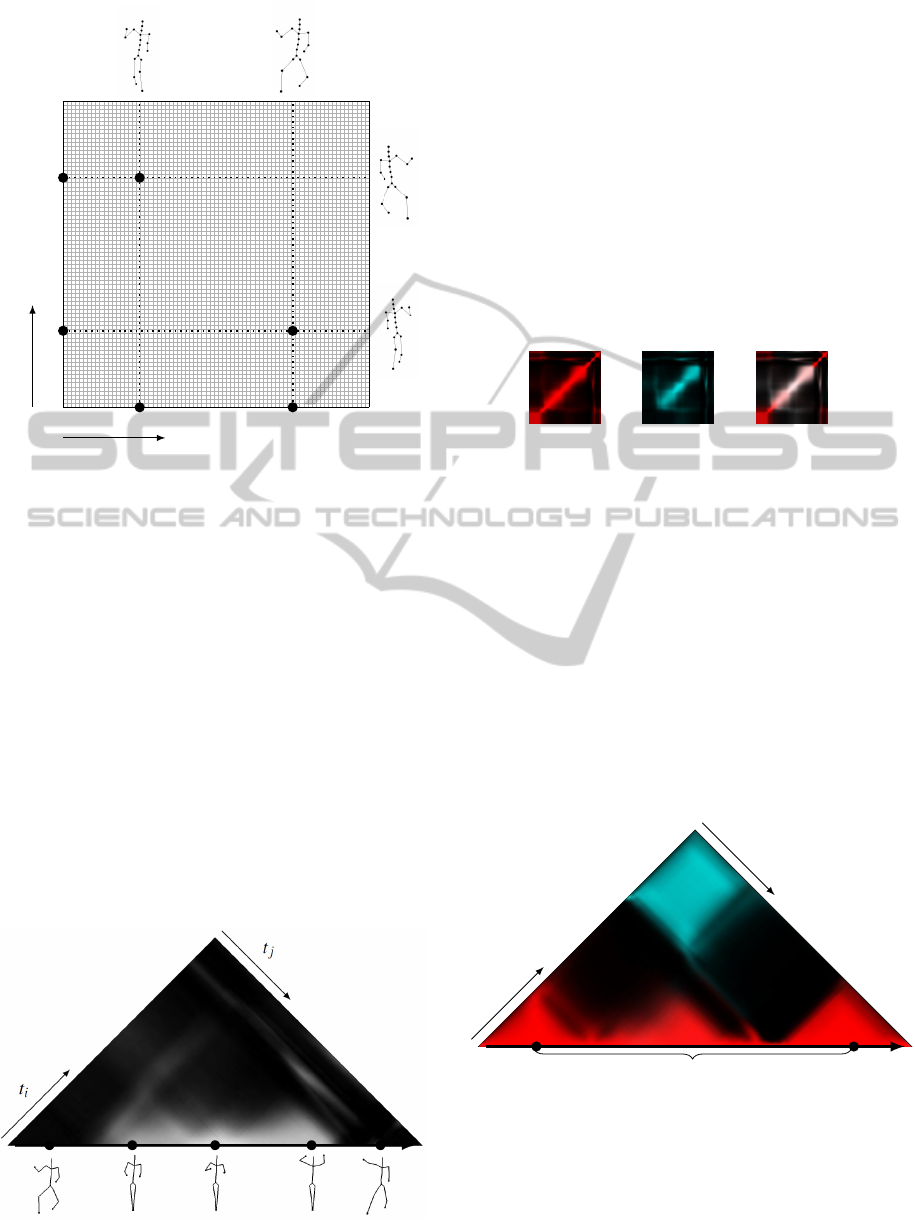
2.2 Configuration Space
We collect the set of quaternions determining the pose
of the body model into a state or configuration vector
−→
Ψ . We begin with a basis in which each element of
the vector, quaternion Q
i
, determines the rotational
state of joint i. The quaternions, which represent a set
of rotational transformations, constitute a manifold.
This manifold is called the configuration space, or C ,
of the kinematic chain. The state vector
−→
Ψ spans C .
In other words, each physical configuration of the
kinematic chain model is associated with a state vec-
tor
−→
Ψ . In turn, this configuration vector (state vector)
is associated with a point in the configuration space
C . These three representations are shown in Figure
1.
−→
Ψ =
Q
1
Q
2
.
.
.
Q
n
Q
1
Q
2
−→
Ψ
Figure 1: Three equivalent representations of a kinematic
state.
2.3 Distance Metric
In order to compare two configuration states,
−→
Ψ
a
and
−→
Ψ
b
, we define a distance function or metric. We be-
gin by using a metric to compare each rigid element
PhyCS2014-InternationalConferenceonPhysiologicalComputingSystems
138

separately and then combine these distance functions
to generate a distance metric comparing whole states
of the whole body. A distance metric measuring the
difference between two poses is depicted in Figure 2.
−→
Ψ
a
−→
Ψ
b
Q
1
Q
2
−→
Ψ
a
−→
Ψ
b
D
ab
Figure 2: Distance measure between two states in C .
We follow the usual definition for metrics as a map
D : C × C → R satisfying the following four axioms:
non-negativity stated in Equation 6, indiscernability
stated in Equation 7, symmetry stated in Equation 8
and subadditivity stated in Equation 9. (Huynh, 2009)
D(x,y) ≥ 0 (6)
D(x,y) = 0 ⇔ x = y (7)
D(x,y) = D(y, x) for x, y ∈ C (8)
D(x,z) ≤ D(x,y) + D(y,z) for x,y ∈ C (9)
We use the inner product of quaternions as our
metric for comparing the rotational states of rigid el-
ements. We define the inner product operator for
quaternions in Equation 10as a 4-tuple dot product.
(Huynh, 2009)
Q ◦ G = q
0
g
0
+ q
1
g
1
+ q
2
g
2
+ q
3
g
3
(10)
In Equation 11 we use the inner product of quater-
nions to derive a distance metric based solely on the
rotational state of a particular rigid body element.
D(Q
a
,Q
b
) = 1 − Q
a
◦ Q
b
(11)
This metric is a measure in SO(3) and gives values in
the range [0,1].
Equation 12 constructs a metric between whole
body configurations using weighted sum of metrics
for individual links.
D(
−→
Ψ
a
,
−→
Ψ
b
) = Σ
i
w
i
D(Q
ai
,Q
bi
) (12)
This whole body metric gives values in the range
[0,Σ
i
w
i
]. It measures the difference between two dif-
ferent states of the body
−→
Ψ
a
and
−→
Ψ
b
. The states are
normalized so that the whole body metric has the form
shown in Equation 13.
D
ab
= 1 −
−→
Ψ
a
◦
−→
Ψ
b
(13)
2.4 Metric Spaces and Similarity
Matrices
We notate each motion path as a set of states over a
time index,
−→
Ψ (t
i
) and create a metric space D
i j
over
this set by calculating the distance between each ele-
ment of the set using the double index i j.
D
i j
= D(
−→
Ψ (t
i
),
−→
Ψ (t
j
)) (14)
Using the elements of D
i j
we create a 2D array called
the similarity matrix, Z
i j
. The indiscernability prop-
erty of D, stated in Equation 7, requires all diago-
nal elements of the matrix Z
i j
are equal to one while
the symmetry property of D, stated in Equation 8, re-
quires the matrix Z
i j
is symmetric.
Z
ii
= 1 (15)
Z
i j
= Z
ji
(16)
t
j
t
i
t
a
t
b
Z
ab
t
a
t
b
Z
ba
Figure 3: Similarity matrix Z
i j
.
3 MOTION SPECTRA
Mapping Z
i j
matrix element values to greyscale val-
ues produces an image which conveys motion path in-
formation visually as shown in Figure 4. Z
i j
values
of 0 are mapped to black, 0 in the greyscale. Values
of 1 are mapped to white, 256 in the greyscale. All Z
i j
values between 0 and 1 are mapped to the greyscale
linearly. The intensity of the Z
i j
matrix element de-
termines the similarity between
−→
Ψ (t
i
) and
−→
Ψ (t
j
). We
BilateralMotionSpectra-AnalysisandRepresentationofHumanMovement
139
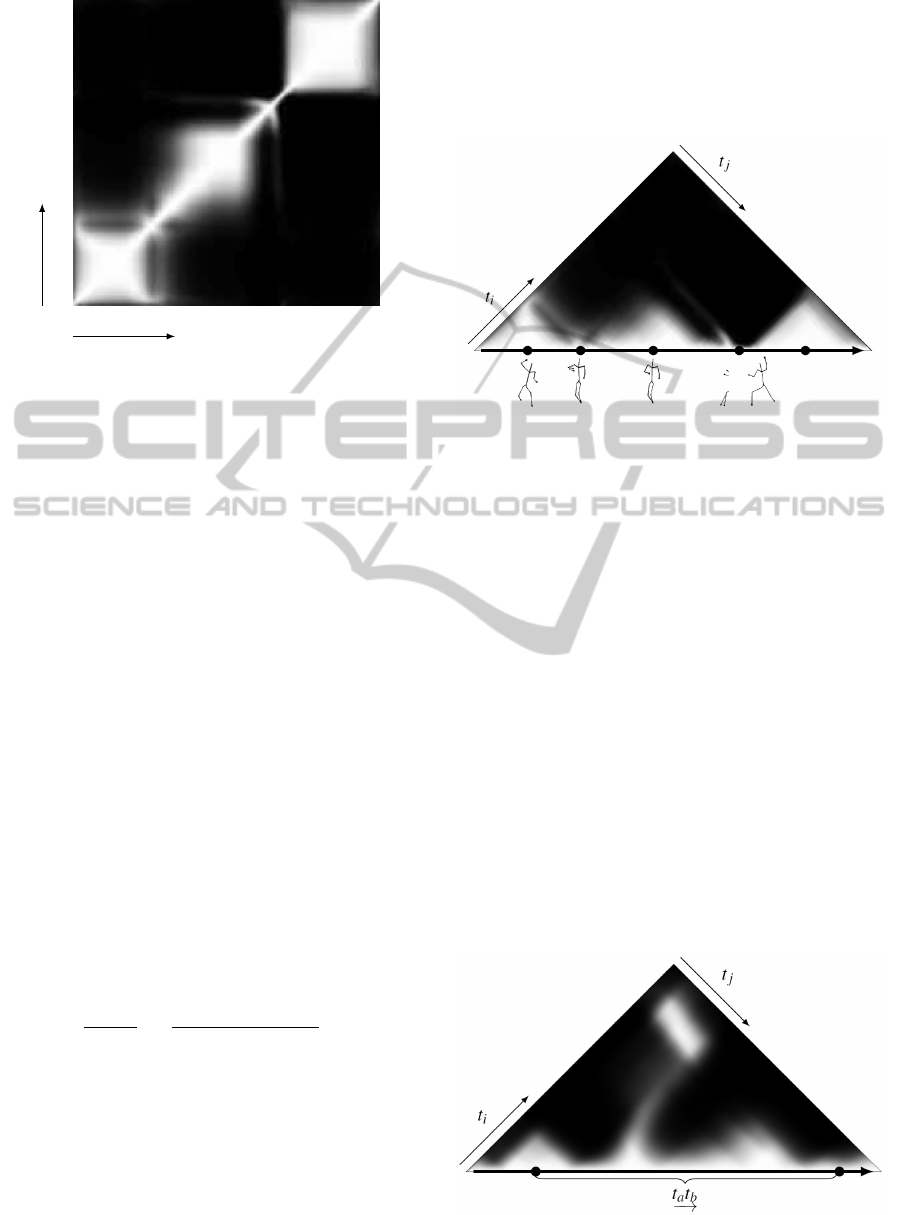
t
j
t
i
Figure 4: A motion spectrum is the the similarity matrix Z
i j
represented in greyscale.
call these images motion spectra. We term the light
regions within them proximity signals.
We call the diagonal elements of the similarity
matrix Z
i j
the identity axis since these are equal to
one, as they are in the standard identity matrix. The
elements near the identity axis are of interest because
they give us insight into how the configuration state
−→
Ψ (t) changes over time.
Since Z
i j
is a symmetric matrix we can represent it
more compactly as a the upper left triangular portion
rotated 45 degrees so that the identity axis is horizon-
tal. This horizontal axis is used as a t
i= j
time axis.
From this view time runs horizontally to the right and
similarity between states at various times is indicated
by elements of the triangle.
3.1 Rapidity and Stillness
There are identifiable visual features of motion spec-
tra near the identity axis relating to the rapidity of
movement. Equation 17 defines rapidity as magni-
tude of the time rate of change of the configuration
state and gives a way to find its measure using the
distance metric.
|
d
−→
Ψ (t)
dt
| =
D(
−→
Ψ (t
i
),
−→
Ψ (t
i−1
))
∆t
(17)
The wider the proximity signal along the identity
axis the less displacement there is over time. This
means the subject is slow moving. Said another way,
the thinner proximity signal along the identity axis the
more rapidly the subject is moving. Figure 5 shows
the rotated triangular version of the motion spectrum
Figure 4.
Below the identity axis we show corresponding
images of the kinematic chain model where at each
time point we overlap models for states
−→
Ψ (t) and
−→
Ψ (t + ∆). In this instance the ∆ is 20 frames or a
sixth of a second. It sections of the motion path with
more displacement correspond to thinner width of the
identity axis.
Figure 5: Kinematic displacement is related to the width Z
i j
signal in the neighborhood of the identity axis.
The lack of displacement of the kinematic model
over time can be interpreted as stillness. Though the
model may not actually be still the kinematic states all
reside within a certain region of C in which all points
are within a certain proximity to one another. Contin-
ued presence in this region over time is described as
stillness. This is visible in Figure 5.
3.2 Repetition
3.2.1 State Repetition
Figure 6 shows a spectrum in which a begins and
ends in the same state in C . The off diagonal region of
lightness is a proximity signal indicating a similarity
between Ψ(t
a
) and Ψ(t
b
). The return of a motion path
to a previously inhabited region of C manifests an off
diagonal proximity signal in Z
i j
indicating proximity
between Ψ(t
a
) and Ψ(t
b
) in C .
Figure 6: Example of state repetition.
PhyCS2014-InternationalConferenceonPhysiologicalComputingSystems
140

3.2.2 Path Repetition
Figure 7 shows a spectrum in which two motion paths
travel along the same route in C . The off diagonal
horizontal light region indicates a similarity between
Ψ(t
a
t
b
−→
) and Ψ(t
c
t
d
−→
). An off diagonal signal which
looks like the identity axis signal is a visual motif in-
dicating repetition of movement.
Figure 7: Example of motion path repetition.
3.2.3 Palindromic Repetition
Figure 8 shows a spectrum in which two motion paths
travel along the same route in C but in opposite direc-
tions. This type of motion, when a movement is exe-
cuted and then repeated backwards in time, is termed
palindromic. A proximity signal projecting perpen-
dicularly from the identity axis indicates a similar-
ity between Ψ(t
a
t
b
−→
) and the time reversed version of
Ψ(t
b
t
c
−→
).
Ψ(t
a
t
b
−→
) = Ψ(t
b
t
c
←−
) (18)
We notate this time reversal using a left under arrow.
An off diagonal signal which looks like the identity
axis signal but projected perpendicular to it is the vi-
sual motif palindromic repetition.
Figure 8: Example of palindromic path repetition.
4 BILATERAL SPECTRA
4.1 Reflection
Due to the symmetry of the human body we know
for any configuration state
−→
Ψ ∈ C there exists a mir-
ror image configuration state
−→
Ψ
∗
∈ C . The reflec-
tion transformation maps the state of the body from
−→
Ψ →
−→
Ψ
∗
. We represent the reflection transformation
in Figure 9.
−→
Ψ
−→
Ψ
∗
Q
1
Q
2
−→
Ψ
−→
Ψ
∗
Figure 9: Reflected pose and corresponding points in C .
4.1.1 Reflection Pseudometric
A pseudometric follows non-negativity and symmetry
but lacks the indiscernability of proper metrics. Equa-
tion 19 defines the reflection pseudometric D
∗
ab
. This
is the metric distance between state
−→
Ψ
a
and the re-
flection of state
−→
Ψ
b
.
D
∗
ab
= 1 −
−→
Ψ
a
◦
−→
Ψ
∗
b
(19)
We define the metric pair as the set of values D
ab
and
D
∗
ab
.
4.2 Anti-Similarity Matrices
and Spectra
We construct the anti-similarity matrix Z
∗
i j
and anti-
similarity spectrum as we did in the previous section.
Equation 20 defines a pseudometric space by calculat-
ing the reflection pseudometric between each element
of the set using the double index i j.
D
∗
i j
= D
∗
(
−→
Ψ (t
i
),
−→
Ψ (t
j
)) (20)
Using this matrix of distance values we create a
2D array for Z
∗
i j
termed the anti-similarity matrix.
Figure 10 shows an example. The corresponding im-
age form of the matrix, which maps matrix elements
to greyscale pixel values, is referred to as the anti-
similarity spectrum.
The symmetry property of the pseudometric space
D
∗
i j
requires Z
∗
i j
is symmetric.
Z
∗
i j
= Z
∗
ji
(21)
BilateralMotionSpectra-AnalysisandRepresentationofHumanMovement
141
t
j
t
i
t
a
t
b
Z
∗
ab
t
a
t
b
Z
∗
ba
Figure 10: Representation of a Z
∗
i j
with many time points
Since D
∗
i j
is a pseudometric it lacks the indiscernabil-
ity property of proper metrics.
D
∗
ii
6= 0 for all i (22)
It follows that the diagonal elements of the anti-
similarity matrix Z∗
i j
are not necessarily equal to one.
If it is the case that over some index the diagonal el-
ements of the anti similarity matrix are one it means
that the set of configuration states is symmetric.
Z
∗
ii
= 1 ←→
−→
Ψ (t
i
) =
−→
Ψ
∗
(t
i
) (23)
Symmetric configuration states are associated with a
proximity signal along the identity axis of the anti-
similarity spectrum as shown in Figure 11.
Figure 11: Z
∗
i j
plot of symmetric motion.
4.3 Bilateral Motion Spectra
In order to visualize Z
i j
and Z
∗
i j simultaneously we
use orthogonal color vectors, red and cyan, to plot
Z
i j
and Z
∗
i j respectively and overlap the two spec-
tra. When the proximity signals of Z and Z
∗
over-
lap we get the addition of red and cyan to generate a
greyscale signal. In the case that Z
i j
= 1 and Z
∗
i j
= 1
we know that we have repetition and symmetry. This
corresponds visually to a white proximity signal in
the combined spectrum. This combined color plot is
the bilateral motion spectrum (Z
i j
,Z
∗
i j
). The addition
of Z
i j
and Z
∗
i j
is shown in Figure 12. The motion
sequence is the same as that presented in Figure 11.
+
Z
i j
Z
∗
i j
(Z
i j
,Z
∗
i j
)
=
Figure 12: Overlay of Z and Z
∗
plots to generate the Z/Z
∗
plot or bilateral motion spectrum.
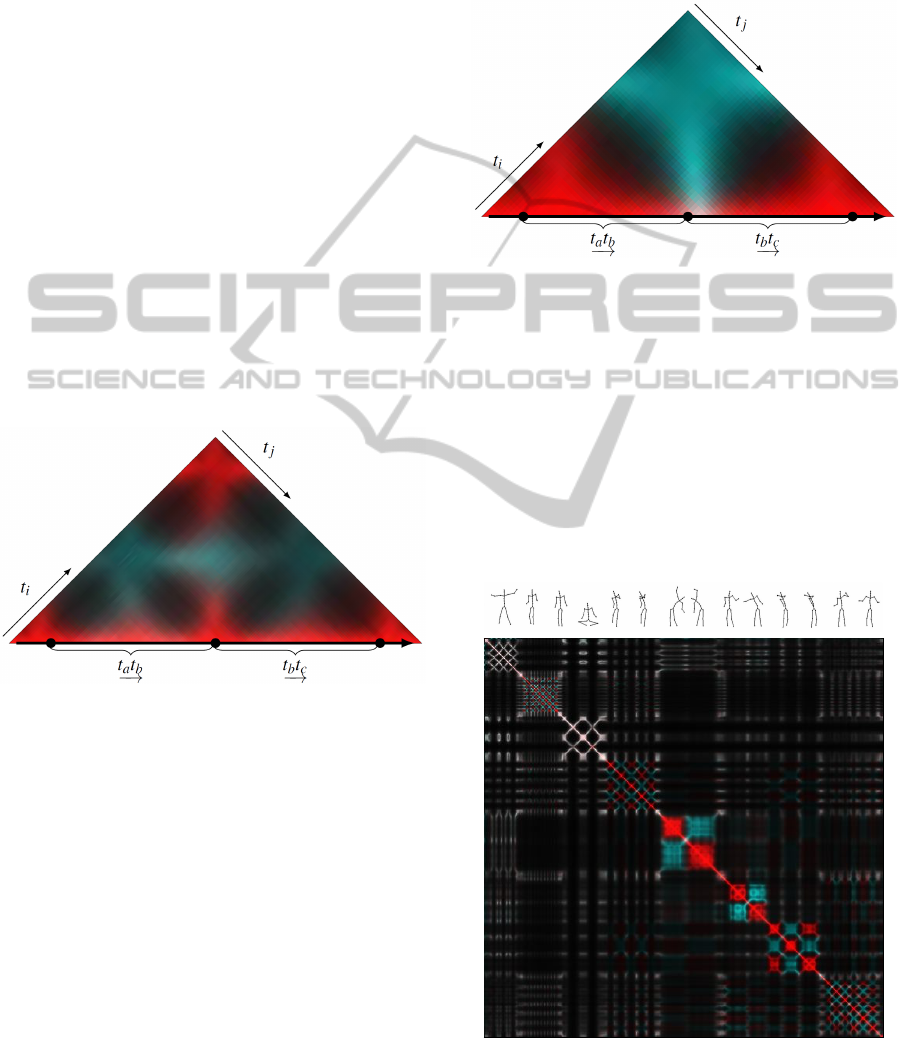
4.4 Reflected State Repetition
When a state of articulation repeats on the reflected
side we observe a cyan proximity signal off the iden-
tity axis. This is shown in Figure 13. The red proxim-
ity signal on the identity axis indicates Ψ(t
a
t
b
−→
) does
not pass through a symmetry state. The off axis prox-
imity signal indicates a similarity between Ψ(t
a
) and
Ψ(t
b
).
∀ i : Ψ(t
i
) 6= Ψ
∗
(t
i
) (24)
Ψ(t
a
) = Ψ
∗
(t
b
) (25)
t
j
t
i
t
a
t
b
−→
Figure 13: Bilateral motion spectrum with reflected state
repetition.
4.5 Anti-phase Motion
A movement sequence such as walking, which pro-
ceeds through a series of asymmetric configuration
PhyCS2014-InternationalConferenceonPhysiologicalComputingSystems
142
states and then repeats on the other side, yields a
particular motif in its bilateral motion spectrum. In
other words, the complete motion cycle consists of a
movement phrase which is performed and then the re-
flected version of that phrase is performed. This kind
of movement is referred to as anti-phase motion be-
cause the left side of the body is 180 degrees out of
phase with the right hand side of the body. The as-
sociated visual motif consists of parallel red and cyan
proximity signals. This type of bilateral motion spec-
trum is shown in Figure 14. The red identity axis
indicates all the states of Ψ(t
a
t
c
−→
) are asymmetric.
∀ i : Ψ(t
i
) 6= Ψ
∗
(t
i
) (26)
The cyan horizontal off axis proximity signal, parallel
to the identity axis, indicates reflected path repetition.
Ψ(t
a
t
b
−→
) = Ψ
∗
(t
b
t
c
−→
) (27)
The red off axis proximity signal at the top of the
triangle indicates the whole motion path Ψ(t
a
t
c
−→
) is
cyclic.
Ψ(t
a
) = Ψ(t
c
) (28)
Figure 14: Bilateral motion spectrum of anti-phase motion.
4.6 Palindromic Anti-phase Motion
A motion path which proceeds through a series of
configuration states, reverses palindromically, and
then repeats on the other side has a distinct bilateral
motion spectrum. In other words the complete mo-
tion cycle consists of a movement phrase which is ex-
ecuted and then the reflected version of that phrase
is performed reversed in time. We term this type of
motion palindromic anti-phase. This type of motion
passes through a symmetric state. Figure 15 presents
the bilateral motion spectrum of a palindromic anti-
phase motion sequence. The cyan proximity signal,
extending perpendicular to the identity axis, indicates
reflected path repetition reversed in time.
Ψ(t
a
t
b
−→
) = Ψ
∗
(t
b
t
c
←−
) (29)
The white section of the identity axis indicates the
motion path passes through a symmetry state at t
b
.
Ψ(t
b
) = Ψ
∗
(t
b
) (30)
Figure 15: Bilateral motion spectrum of palindromic anti-
phase motion.
4.7 Example Sequence
Figure 14 shows the bilateral motion spectrum for
a sequence of motion phrases. The movements are
jumping jacks, jogging in place, deep knee bends,
twisting, side bends, side reaching and side gesturing.
Each motion phrase generates one of the characteris-
tic motifs covered above. Each phrase is also distinct
as it generates a minimal off-diagonal proximity sig-
nal.
(Z
i j
,Z
∗
i j
)
Figure 16: Bilateral motion spectrum of various movement
phrases.
BilateralMotionSpectra-AnalysisandRepresentationofHumanMovement
143

5 APPLICATIONS
5.1 Medicine and Human Performance
This type of analysis could be effective in identifying
pathological movement patterns in patients, athletes
and performers. A subject could be asked to execute
a series of movement sequences in a clinical setting
which tested various types of spatio-temporal pattern
capacities. Motion capture data could be recorded,
processed and analyzed to identify any motion asym-
metries or other pathologies.
5.2 Gaming and Human Computer
Interaction
This type of analysis could be performed by a gam-
ing system in real time in order to recognize pat-
terned motion such as dancing. Rhythm and motion
patterns could be recognized and integrated into the
game play.
5.3 Biological and Anthropological
Applications
This type of analysis could provide a taxonomy of hu-
man and animal movement for the effective databas-
ing of various motions. For example a database of
dance would benefit from such a structural taxonomy.
6 FUTURE WORK
In the future we hope to record longer movement se-
quences. Choreographed movements such as ballet
dances, Ashtanga yoga series or martial arts forms
should have high degrees of spatial and temporal sym-
metry. Bilateral motion spectra of such sequences
would be able to represent the patterns within such
choreographed movement sequences.
It could also be fruitful to apply this analysis for
subspaces of the configuration space of the body,
looking at the spine, legs and arms separately.
7 CONCLUSIONS
In this paper, we presented a novel data structure for
analyzing, characterizing and representing continu-
ous human motion data. The data structure was able
to effectively identify spatial and temporal movement
patterns. Our main contributions are summarized be-
low.
1. We formalized existing methods of motion cap-
ture analysis using metric and metric space theory.
2. We functionalized existing methods of motion
capture analysis in order to characterize tempo-
ral features of human movement including still-
ness, rapidity, state repetition, path repetition and
palindromic repetition.
3. We enhanced existing methods of motion capture
analysis in order to characterize spatial movement
patterns including symmetric motion, anti-phase
motion and palindromic anti-phase motion.
4. We developed a concise visual representation of
human motion which can express a wide variety
of spatial and temporal pattern motifs.
REFERENCES
Alankus, G. (2005). Animating character navigation using
motion graphs. Master’s thesis, Middle East Technical
University.
Arikan, O. and Forsyth, D. A. (2002). Interactive motion
generation from examples. In Proceedings of the 29th
Annual Conference on Computer Graphics and Inter-
active Techniques, SIGGRAPH ’02, pages 483–490.
ACM.
Huynh, D. (2009). Metrics for 3d rotations: Comparison
and analysis. Journal of Mathematical Imaging and
Vision, 35:155–164.
Kovar, L., Gleicher, M., and Pighin, F. (2002). Motion
graphs. In Proceedings of the 29th Annual Conference
on Computer Graphics and Interactive Techniques,
SIGGRAPH ’02, pages 473–482. ACM, ACM.
Murray, M., Li, Z., and Sastry., S. S. (1994). A Mathemati-
cal Introduction to Robotic Manipulation. CRC Press.
PhyCS2014-InternationalConferenceonPhysiologicalComputingSystems
144
