
End of Discriminant Functions based on Variance-covariance
Matrices
Shuichi Shinmura
Dept. of Economics, Seikei, 3-3-1 Kichijoji-kitamachi, Tokyo 180-8633, Japan
Keywords: Linear Discriminant Function (LDF), Logistic Regression, SVM, Minimum Number of Misclassifications
(MNM), Revised IP-OLDF based on MNM Criterion, Linear Separable Data, K-Fold Cross-validation.
Abstract: Fisher proposed a linear discriminant function (LDF) based on the maximization of the variance ratio. If
data satisfies Fisher’s assumption, the same LDF is easily derived from a variance-covariance matrix. When
the variance-covariance matrices of two classes are not the same, a quadratic discriminant function (QDF)
can be used. These discriminant functions have three problems. First, none of them can correctly
discriminate between x
i
on the discriminant hyperplane (the unresolved problem of discriminant analysis).
Second, LDF and QDF cannot always recognize linear separable data, and the number of misclassifications
(NM) made by these functions is usually higher than that of logistic regression. Third, these functions are
not obtained if the value of some independent variable is constant, because the inverse matrix cannot be
calculated. These facts mean that LDF and QDF should not be used for important discriminations. On the
contrary, a revised Optimal Linear Discriminant Function by Integer Programming (Revised IP-OLDF)
based on the Minimum NM (MNM) criterion resolves these problems completely. In addition, the mean
error rate of Revised IP-OLDF is often less than those of LDF, logistic regression, and Support Vector
Machines (SVM) under 100-fold cross-validation.
1 INTRODUCTION
Fisher (1936) described the linear discriminant
function (LDF), and founded discriminant theory.
Following this, the quadratic discriminant function
(QDF) and multi-class discrimination using
Mahalanobis distance were proposed. These
functions are based on variance-covariance matrices,
and are easily implemented in statistical software
packages. They can be used in many applications,
such as medical diagnosis, pattern recognition,
genome discrimination, and rating real estate and
bonds. However, real data rarely satisfy Fisher’s
assumptions. Therefore, it is well known that logistic
regression is better than LDF and QDF, because
logistic regression does not assume a specific
theoretical distribution, such as a normal
distribution. The discriminant rule is very simple: If
y
i
*f (x
i
) > 0, x
i
is classified to class1/class2
correctly. If y
i
*f(x
i
) < 0, x
i
is misclassified. There are
three serious problems hidden in this simplistic
scenario.
1) Problem 1. We cannot properly discriminate
between cases where x
i
lies
on the discriminant
hyperplane (f(x
i
) = 0). This unresolved problem has
been ignored until now. The proposed Revised IP-
OLDF is able to treat this problem appropriately.
Indeed, except for Revised IP-OLDF, no functions
can correctly count the NM. These functions should
count the number of cases where f(x
i
) = 0, and
display this alongside the NM in the output.
2) Problem 2. LDF and QDF cannot recognize
linear separable data (where the Minimum NM
(MNM) = 0). Therefore, these functions should not
be used in pattern recognition, medical diagnosis,
genome diagnosis, etc. This fact was first found
when IP-OLDF was applied to Swiss bank note data
(Flury and Rieduyl, 1988). In this paper, the
determination of pass/fail in exams is used because
it is trivially linear-separable. We show that, in many
cases, the NMs of LDF and QDF are not zero. Next,
100 re-samples of these data are generated, and the
mean error rates are obtained by 100-fold cross-
validation. The mean error rates of LDF are 6.23%
higher than that of Revised IP-OLDF in the
validation samples.
3) Problem 3. If the variance-covariance matrix is
singular, LDF and QDF cannot be calculated
5
Shinmura S..
End of Discriminant Functions based on Variance-covariance Matrices.
DOI: 10.5220/0004699000050016
In Proceedings of the 3rd International Conference on Operations Research and Enterprise Systems (ICORES-2014), pages 5-16
ISBN: 978-989-758-017-8
Copyright
c
2014 SCITEPRESS (Science and Technology Publications, Lda.)

because the inverse matrices do not exist. The LDF
and QDF of JMP (Sall, Creighton & Lehman, 2004)
are solved by the generalized inverse matrix
technique. In addition to this, RDA is used
(Friedman, 1989) if QDF causes serious trouble with
dirty data. However, RDA and QDF do not work
properly for the special case in which the values of
independent variables belonging to one class are
constant. If users can choose proper options for a
modified RDF developed for this special case, it
works better than QDF and LDF.
In this research, two Optimal Linear
Discriminant Functions (OLDF) based on the MNM
criterion are proposed. The above three problems are
solved by IP-OLDF and Revised IP-OLDF
completely. IP-OLDF (Shinmura, 1998; 2000; 2004)
reveals the following properties.
Fact 1) Relation between Linear Discriminant
Functions and NMs. IP-OLDF is defined on the
data and discriminant coefficient spaces. Cases of x
i
correspond to linear hyperplanes in the p-
dimensional discriminant coefficient space that
divide the space into two half-planes: the plus half-
plane (y
i
*f (x
i
) > 0) and minus half-plane (y
i
*f (x
i
) <
0). Therefore, the coefficient space is divided into a
finite convex polyhedron by linear hyperplanes.
Some interior point b
j
on this space corresponds to
the discriminant function f
j
(x) on the data space that
discriminates some cases properly and misclassifies
others. This means that each interior point b
j
has a
unique NM. The “Optimal Convex Polyhedron” is
defined as that with the minimal NM (i.e., the
MNM). Revised IP-OLDF (Shinmura, 2007) can
find the interior point of this polyhedron directly,
and solves the unresolved problem (Problem 1)
because there are no cases on the discriminant
hyperplane (f(x
i
) = 0). If b
j
is on a vertex or edge of
a convex polyhedron, however, the unresolved
problem cannot be avoided because there are some
cases on f(x
i
) = 0.
Fact 2) Monotonous Decrease of MNM. Let
MNM
p
be the MNM of p independent variables. Let
MNM
(p+1)
be the MNM of the (p+1) independent
variables formed by adding one variable to the
original p independent variables. MNM decreases
monotonously (MNM
p
>= NMMNM
(p+1)
), because
the p-dimensional coefficient space is a subset of the
(p+1)-dimensional coefficient space (Shinmura,
2007). If MNM
p
= 0, all MNMs of discriminant
functions including p independent variables are zero.
Swiss bank note data consists of genuine and
counterfeit bills with six variables. IP-OLDF finds
that this data is linear-separable according to two
independent variables (X4, X6). Therefore, 16
models including these two variables have MNMs =
0. Nevertheless, LDF and QDF cannot recognize
that this data is linear-separable, presenting a serious
problem.
In this paper, we show that Revised IP-OLDF
can resolve the above three problems, and is superior
to LDF, logistic regression, and Soft-margin SVM
(S-SVM) (Vapnik, 1995) under 100-fold cross-
validation (Shinmura, 2011b; 2013) of the pass/fail
determinations of exams (Shinmura, 2011a) and
their re-sampled data.
2 DISCRIMINANT FUNCTIONS
2.1 Statistical Discriminant Functions
Fisher defined LDF to maximize the variance ratio
(between/within classes) in equation (1). This can be
solved by non-linear programming (NLP).
MIN=b’(x
m1
-x
m2
) (x
m1
-x
m2
)’b/b’ ∑b;
(1)
If we accept Fisher’s assumption, the same LDF is
obtained in equation (2). This equation defines LDF
explicitly, whereas equation (1) defines LDF
implicitly. Therefore, statistical software packages
adopt this equation. Most statistical users
misunderstand that discriminant analysis is the same
as regression analysis. Discriminant analysis is
independent of inferential statistics, because there
are no standard errors of the discriminant
coefficients and error rates. Therefore, the leave-
one-out (LOO) method (Lachenbruch and Mickey,
1968) was proposed to choose the proper
discriminant model.
LDF: f(x)={x-(m
1
+m
2
)/2}’ ∑
-1
(m
1
-m
2
) (2)
Most real data do not satisfy Fisher’s assumption.
When the variance-covariance matrices of two
classes are not the same (∑
1
≠∑
2
), the QDF defined
in equation (3) can be used. The Mahalanobis
distance (equation (4)) is used for the discrimination
of multi-classes, and the Mahalanobis-Taguchi
method is applied in quality control.
QDF: f(x)=x’(∑
2
-1
- ∑
1
-1
) x/2
+(m
1
’∑
1
-1
-m
2
’∑
2
-1
)x+c
(3)
D=SQRT ((x-m)’ ∑
-1
(x-m)) (4)
These functions are applied in many areas, but
cannot be calculated if some independent variables
remain constant. There are three cases. First, some
variables that belong in both classes are the same
constant. Second, some variables that belong in both
classes are different but constant. Third, some
ICORES2014-InternationalConferenceonOperationsResearchandEnterpriseSystems
6

variable that belongs to one class is constant. Most
statistical software packages exclude all variables in
these three cases. On the other hand, JMP enhances
QDF using the generalized inverse matrix technique.
This means that QDF can treat the first and second
cases correctly, but cannot handle the third case
properly. In medical diagnosis and pattern
recognition, discriminant analysis is an important
statistical method. Recently, the logistic regression
in equation (5) has been used instead of LDF and
QDF for two reasons. First, it is well known that the
error rate of logistic regression is often less than
those of LDF and QDF, because it is derived from
real data instead of some normal distribution that is
liberated from reality. Let ‘p’ be the probability of
belonging to a group of diseases. If the value of
some independent variable is increasing/decreasing,
p increases from zero (normal group) to one (group
of diseases). This representation is very useful in
medical diagnosis, as well as for ratings in real
estate and bonds. On the contrary, LDF assumes that
cases near to the average of the diseases are
representative cases of the diseases group.
p=1/(1+exp(-f(x))) (5)
2.2 Before and After SVM
Stam (1997) summarized Lp-norm research until
1997, and answers the question of “Why have
statisticians rarely used Lp-norm methods?” He
gives four reasons: Communication, promotion and
terminology; Software availability; Relative
accuracy of Lp-norm classification methods: Ad hoc
studies; and the Accuracy of Lp-norm classification
methods: decision theoretic justification. While each
of these reasons is true, they are not important. The
most important reason is that there is no comparison
between these models with statistical discriminant
functions, because discriminant analysis was
established by Fisher before mathematical
programming (MP) approaches. There are two types
of MP applications. The first is modeling by MP,
such as for portfolio selection (Markowitz, 1959),
and the second is catch-up modeling, such as for
regression and discriminant analysis. Therefore, the
latter type should be compared with preceding
results. No statisticians use Lp-norm methods,
because there is no research indicating that Lp-norm
methods are superior to statistical methods.
Liitschwager and Wang (1978) defined a model
based on the MNM in equation (6). There are
several mistakes, but the most important is the
restriction on the discriminant coefficients. Only one
discriminant coefficient should be fixed to -1/1.
There is no need to fix the other (k-1) coefficients in
the range [-1, 1].
Min=f
1
g
1
M
-1
Σ
(i=1,…,M)
P
i
+ f
2
g
2
N
-1
Σ
(j=1,…,N)
Q
j
a
1
x
i1
+a
2
x
i2
+…+a
k
x
ik
≦ b+CP
i
(i=1,2,…,M)
a
1
y
j1
+a
2
y
j2
+…+a
k
y
jk
≧ b-CQ
i
, (j=1,2,…,N)
-1+2D
r
≦a
r
≦1-2E
r
, (r=1,2,…,k )
Σ
(r=1,…k)
D
r
+Σ
(r=1,…,k)
E
r
=1
f
1
,
f
2
:risk.C : positive constant.
g
1
,g
2
:prior probability.
M, N:number of cases in both class.
P
i
,Q
j
:0/1 integers for each e
i
.
b:discriminant hyper-plane.
D
r
,E
r
:0/1 integers
(6)
Vapnik proposed three different SVM models. The
hard-margin SVM (H-SVM) indicates the
discrimination of linear separable data. We
statisticians misunderstand that discrimination of
linear separable data is very easy. In statistics, there
was no technical term for linear separable data.
However, the condition “MNM = 0” is the same as
being linear-separable. Note that “NM = 0” does not
imply the data is linear-separable. It is unfortunate
that there has been no research into linear
separability. This is defined to maximize the
distance of the “Support Vector (SV)” in order to
obtain “good generalization” by NLP, which is
similar to “not overestimating the validation data in
statistics.” H-SVM is redefined to minimize (1/
“distance of SV”) in equation (7). This is solved by
quadratic programming (QP), which can only be
used for linear separable data. This may be why
investigation of linear separable data has been
ignored.
MIN = ||b||
2
/2 ; y
i
* (x
i
’b+ b
0
) >= 1- e
i
;
y
i
= 1 / -1 for x
i
class1/class2.
x
i
: p-independent variables.
b : p-discriminant coefficients.
e
i
: 0/1 decision variable.
(7)
Real data are rarely linear-separable. Therefore, S-
SVM has been defined (equation (8)). S-SVM
permits certain cases that are not discriminated by
SV (y
i
*f (x
i
) < 1). The second objective is to
minimize the summation of distances of
misclassified cases (Σe
i
) from SV. These two objects
are combined by defining some “penalty c.” The
Markowitz portfolio model to minimize risk and
maximize return is the same as S-SVM. However,
the return is incorporated as a constraint, and the
objective function minimizes risk. The decision
maker chooses a solution on the efficient frontier.
On the contrary, S-SVM does not have a rule to
EndofDiscriminantFunctionsbasedonVariance-covarianceMatrices
7

determine c properly; nevertheless, it can be solved
by an optimization solver. (Kernel-SVM is omitted
from the research.)
MIN = ||b||
2
/2 + c* Σe
i
;
y
i
* ( x
i
’b+ b
0
) >= 1 - e
i
;
c : penalty c to combine two objectives
(8)
2.3 IP-OLDF and Revised IP-OLDF
Shinmura and Miyake (1979) developed the
heuristic algorithm of OLDF based on the MNM
criterion. This solves the five independent variable
(5-variable) model of Cephalo Pelvic Disproportion
(CDP) data that consisted of two groups having 19
independent variables. SAS was introduced into
Japan in 1978, and three technical reports about the
generalized inverse matrix, the sweep operator
(Goodnight, 1978), and SAS regression applications
(Sall, 1981) are related to this research. LINDO was
introduced to Japan in 1983. Several regression
models are formulated by MP (Schrage, 1991), e.g.,
least-squares problems can be solved by QP, and
LAV (Least Absolute Value) regression is solved by
LP. Without a survey of previous research, the
formulation of IP-OLDF (Shinmura, 1998) can be
defined as in equation (9). This notation is defined
on p-dimensional coefficient space, because the
constant is fixed to 1. In pattern recognition, the
constant is a free variable. In this case, the model is
defined on (p+1)-coefficient space, and we cannot
elicit the same deep knowledge as with IP-OLDF.
This difference is very important. IP-OLDF is
defined on both p-dimensional data and coefficient
spaces. We can understand the relation between the
NM and the discriminant function f(x) clearly. The
linear equation H
i
(b)=y
i
*(x
i
’b+1) = 0 divides p-
dimensional space into plus and minus half-planes
(y
i
*(x
i
’b+1) > 0, y
i
*(x
i
’b+1) < 0). If b
j
is in the plus
half-plane, f
j
(x)=y
i
*(b
j
’x+1) discriminates x
i
correctly, because f
j
(x
i
)= y
i
*(b
j
’ x
i
+1) = y
i
*(x
i
’b
j
+1)
> 0. On the contrary, if b
j
is included in the minus
half-plane, f
j
(x) cannot discriminate x
i
correctly,
because f
j
(x
i
) = y
i
*(b
j
’ x
i
+1)= y
i
*(x
i
’b
j
+1) < 0. The n
linear equations H
i
(b) divide the coefficient space
into a finite number of convex polyhedrons. Each
interior point of a convex polyhedron has a unique
NM that is equal to the number of minus half-planes.
We define the “Optimal Convex Polyhedron” as
that for which NM is equal to MNM. If x
i
is
classified correctly, e
i
= 0 and y
i
*(x
i
’b+1) >= 0 in
equation (9). If there are cases on the discriminant
hyperplane, this causes the unresolved problem. If x
i
is misclassified, e
i
= 1 and y
i
*(x
i
’b+1)>= -10000.
This means that IP-OLDF chooses the discriminant
hyperplane y
i
*(x
i
’b+1) = 0 for correctly classified
cases, and y
i
*(x
i
’b+1) = -10000 for misclassified
cases according to a 0/1 decision variable. Therefore,
when f
j
(x) = y
i
*(b
j
’ x+1) corresponds to an interior
point, the objective function is equal to MNM. On
the contrary, if f
j
(x) = y
i
*(b
j
’ x+1) corresponds to a
vertex or edge of the convex polyhedron, the
objective function may not be equal to MNM. This
is because the vertex may consist of more than (p+1)
linear equations H
i
(b) = 0. In addition to this defect,
IP-OLDF must be solved for the three cases where
the constant is equal to 1, 0, -1, because we cannot
determine the sign of y
i
in advance. Combinations of
y
i
= 1/-1 for x
i
∊ class1/class2 are decided by the
data, not the analyst.
MIN = Σe
i
; y
i
* (x
i
’b+1) >= - M* e
i
;
M: 10,000 (Bi
g
M constant).
(9)
The Revised IP-OLDF in equation (10) can find the
true MNM, because it can directly find the interior
point of the optimal convex polyhedron. This means
there are no cases where y
i
*(x
i
’b+ b
0
) = 0. If x
i
is
discriminated correctly, e
i
= 0 and y
i
*(x
i
’b+ b
0
) >= 1.
If x
i
is misclassified, e
i
= 1 and y
i
*(x
i
’b+ b
0
) >= -
9999. It is expected that all misclassified cases will
be extracted to alternative SVs, such as y
i
*(x
i
’b+ b
0
)
= -9999. Therefore, the discriminant scores of
misclassified cases become large and negative, and
there are no cases where y
i
*(x
i
’b+ b
0
) = 0.
MIN = Σe
i
;
y
i
* ( x
i
’b+ b
0
) >= 1 - M* e
i
;
b
0
: free decision variables
(10)
If e
i
is a non-negative real variable, we utilize
Revised LP-OLDF, which is an L
1
-norm linear
discriminant function. Its elapsed runtime is faster
than that of Revised IP-OLDF. If we choose a large
positive number as the penalty c of S-SVM, the
result is almost the same as that given by Revised
LP-OLDF, because the role of the first term of the
objective value in equation (8) is ignored. Revised
IPLP-OLDF (Shinmura, 2009) is a combined model
of Revised LP-OLDF and Revised IP-OLDF. In the
first step, Revised LP-OLDF is applied for all cases,
and e
i
is fixed to 0 for cases that are discriminated
correctly by Revised LP-OLDF. In the second step,
Revised IP-OLDF is applied for cases that are
misclassified in the first step. Therefore, Revised
IPLP-OLDF can obtain an estimate of MNM faster
than Revised IP-OLDF.
2.4 Comparison Revised IP-OLDF with
Revised IPLP-OLDF
Revised IP-OLDF is compared with Revised IPLP-
ICORES2014-InternationalConferenceonOperationsResearchandEnterpriseSystems
8

OLDF using four different datasets: Fisher’s iris data
(Edgar, 1935), Swiss bank note data, CPD data, and
the student data (Shinmura, 2007). These data are
used as training samples. A total of 20,000 cases are
re-sampled from these data sets and are used as
validation samples. Revised IP-OLDF and Revised
IPLP-OLDF are applied to both the training and
validation samples using Optimization Modeling
Software for Linear, Nonlinear, and Integer
Programming (LINGO) Ver.10 (Schrage, 2006)
which was released by LINDO Systems Inc. in 2008.
Three comparisons were examined. First, we
compared the elapsed runtime of Revised IP-OLDF
to Revised IPLP-OLDF for the training and
validation samples. Second, we compared MNMs of
Revised IP-OLDF to NMs of Revised IPLP-OLDF
for the training samples. Third, we compared NMs
of Revised IP-OLDF to those of Revised IPLP-
OLDF for the validation samples.
Iris data consisted of 100 cases with four
independent variables. The object variable consisted
of two species: 50 versicolor and 50 virginica. All
combinations of independent variables (15 = 2
4
-1)
were investigated. This data set is very famous
evaluation data in discriminant analysis as it satisfies
Fisher’s assumption. The elapsed runtimes of
Revised IP-OLDF and Revised IPLP-OLDF of the
15 models were 446 seconds and 30 seconds,
respectively; hence, Revised IPLP-OLDF was
approximately 15 times faster than Revised IP-
OLDF. The NMs for Revised IPLP-OLDF equaled
the MNMs of Revised IP-OLDF in the training
sample. All absolute values of the difference of NMs
of both functions in the validation sample were less
than or equal to 0.02%.
The Swiss bank note data consisted of two kinds
of bills: 100 genuine and 100 counterfeit bills. There
were six independent variables: X1 was the length of
the bill (mm); X2 and X3 were the width of the left
and right edges (mm), respectively; X4 and X5 were
the bottom and top margin widths (mm),
respectively; X6 was length of the image diagonal
(mm). A total of 63 (=2
6
-1) models were
investigated. According to Shinmura (2007), of the
63 total models, 16 of them including two variables
(X4, X6) have MNMs of zero; thus, they are linearly
separable. The 47 models that remain are not
linearly separable. This data is adequate whether or
not linear discriminant functions can discriminate
linearly separable data correctly. The elapsed
runtimes of both functions were 133,399 seconds
and 2,688 seconds, respectively. Revised IPLP-
OLDF was approximately 50 times faster than
Revised IP-OLDF. The NMs of Revised IPLP-
OLDF was equal to the MNM of Revised IP-OLDF
in the training sample. Overall, the absolute values
of the difference of NMs for the validation samples
were less than 2% for 25 models and greater than
2% for the remaining 38 models.
CPD data consisted of two groups: 180 pregnant
women whose babies were born by natural delivery
and 60 pregnant women whose babies were born by
Caesarean section. There were 19 independent
variables: X1 was the pregnant woman’s age; X2
was the number of deliveries; X3 was the number of
the sacrum; X4 was the anteroposterior distance at
the pelvic inlet; X5 was the anteroposterior distance
at the wide pelvis; X6 was the anteroposterior
distance at the narrow pelvis; X7 was the shortest
anteroposterior distance; X8 was the fetal biparietal
diameter, and X9 was X7-X8 (small normal random
noise added); X10 was the anteroposterior distance
at the pelvic inlet; X11 was the biparietal diameter at
the pelvic inlet; X12 was X13-X14 (small normal
random noise added); X13 was the area at the pelvic
inlet; X14 was the area of the fetal head; X15 was
the area at the bottom length of the uterus; X16 was
the abdominal circumference; X17 was the external
conjugate; X18 was the intertrochanteric diameter,
and X19 was the lateral conjugate. Because there are
(2
19
-1) models by all combinations of independent
variables, only 40 models were selected using the
forward and backward methods. For the 16-variable
model, three variables (X4, X7, X14) were dropped
due to multicollinearity. The elapsed runtimes of
both functions were 38,170 seconds and 380 seconds,
respectively. Revised IPLP-OLDF was
approximately 100 times faster than Revised IP-
OLDF; this large difference in elapsed runtime may
be due to multicollinearity since Revised IP-OLDF
requires a long time to check the convergence. The
NMs of Revised IPLP-OLDF is equal to the MNMs.
For the validation samples, the absolute values of the
difference of NMs were less than 2% for 28 models
and greater than 2% for the remaining 12 models.
The student data consisted of two groups: 25
students who pass the exam and 15 students who
fail. There were five independent variables: X1 was
the hours of study per day; X2 was spending money
per month; X3 was number of days drinking per
week; X4 was sex and X5 was smoking. The elapsed
runtimes of both functions were 20 seconds and 40
seconds, respectively. Because all of the variables
are integers and many values overlapped, Revised
IPLP-OLDF was slower than Revised IP-OLDF. For
the training samples, NMs were the same as MNMs.
For the validation samples, the absolute values of the
difference were less than 2% for 13 models and
EndofDiscriminantFunctionsbasedonVariance-covarianceMatrices
9

greater than 2% for 18 models. If IP-OLDF
discriminated this data by two variables (X1, X2),
we had the following linear discriminate function:
f(X1,X2)=X2-5. There were four pass students
(X1=3,4,6,9) and four fail students (X1=2,2,3,5) on
the discriminant hyper plane (X2=5). The minimum
NM of IP-OLDF was three; however, the true
MNMs of Revised IP-OLDF was five. LINGO
Ver.14 (K-Best Option) reveals there are three
optimal linear discriminant functions in 2013.
2.5 Comparison Revised IPLP-OLDF
with LDF and Logistic Regression
In addition to the above results, the NMs of 135
Revised IPLP-OLDF models were compared to 135
NMs of LDF and logistic regression by 100-fold
cross-validation in Table 1. One hundred re-
sampling samples were generated from four data
sets. The NMs of Revised IPLP-OLDF were
compared to those of LDF and logistic regression by
100-fold cross-validations. Revised IPLP-OLDF was
coded using LINGO Ver.10. The LDF and logistic
regression were supported by the JMP division of
SAS Institute Inc. Japan. All possible models of Iris
(15 models), Student (31 models), and Swiss bank
note (63 models) data were computed. Since there
were (2
19
-1) models of CPD data, only 26 models
were selected using the forward and backward
stepwise methods. At first, 100 discriminant
functions and NMs were computed for 135 different
models by 100 training samples. Mean error rates
were also computed. Next, the 100 discriminant
functions were applied to the validation samples and
mean error rates were computed for the validation
samples. Finally, four differences (mean error rates
of LDF/Logistic regression – those of Revised IPLP-
OLDF) were computed as shown in Table 1.
Table 1: Comparison of mean of error rates.
LDF - IPLP Logistic - IPLP
135
models
Trai. Val.(15) Trai. (3) Val.(33)
Min Min Min Min
Iris 0.55
-0.6(2)
0.59
-0.84(2)
Bank 0
-0.33(10)
0
-0.3(24)
Student 1.46
-1.29(3) -2.12 (3) -2.89(7)
CPD 3.05 2.21 0.13 0.29
Minimum values of 135 different models of
(LDF – IPLP) in the training samples were over 0%.
This means that 135 mean error rates of LDF are
higher than those of Revised IPLP-OLDF in the
training samples. In the validation samples,
minimum values of two models of Iris data, ten
models of Bank data and three models of the student
data were less than zero. Only 15 models of LDF
were better than Revised IPLP-OLDF in the
validation samples. Minimum values of (Logistic –
IPLP) tell us that only three and 33 models of
logistic regression were better than Revised IPLP-
OLDF for the training and validation samples,
respectively.
3 PASS/FAIL DETERMINATION
In this research, we discuss Problem 2 and Problem
3 using linear separable data. It is difficult to obtain
linear separable data, but the pass/fail determination
of exam scores makes good research data, because it
can be obtained easily, and we can find a trivial
discriminant function. In future research, we plan to
evaluate the quality of exams and student ability
each year.
My theoretical research starts from 1997 and
ends in 2009 (Shinmura, 2010). My applied research
began in 2010. I negotiated with the National Center
for University Entrance Examinations (NCUEE),
and borrowed research data consisting of 105 exams
in 14 subjects over three years. I finished analyzing
the data at the end of 2010, and obtained 630 error
rates for LDF, QDF, and Revised IP-OLDF.
However, NCUEE have requested me not to present
the results on March 2011. Therefore, I explain new
research results using my statistical exam results.
The reason for the special case of QDF and RDA is
found at the end of 2012. My applied research
concluded in 2012.
3.1 Details of Lectures and Exams
The course consists of one 90 min lecture per week
for 15 weeks. In 2011, the course only ran for 11
weeks because of power shortages in Tokyo caused
by the Fukushima nuclear accident. Approximately
130 students, mainly freshmen, attended the lectures.
Midterm and final exams consisted of 100 questions
with 10 choices. Pass/fail determinations were given
by two discriminations using 100 item scores, and
four testlet scores as independent variables. Table 2
shows the four testlet contents and scores. If the pass
mark is 50 points, we can easily obtain a trivial
discriminant function (f = T1 + T2 + T3 + T4 – 50).
If f >= 0 or f < 0, the student passes or fails the exam,
respectively. In this case, students on the
discriminant hyperplane pass the exam, because
their score is exactly 50. This indicates that there is
no unresolved problem because the discriminant
rule is decided by independent variables.
ICORES2014-InternationalConferenceonOperationsResearchandEnterpriseSystems
10

Table 2: Contents and scores of four testlet.
Midterm Exam Final Exam
T1 Elementary Statics 29 Calculation 26
T2 Calculation 12 Corr. & Reg. 30
T3 Normal Distribution 19 Cross Tabu. 21
T4 JMP 40 JMP 23
Table 3 shows a summary of the exams. We use
three levels of 10%, 50%, and 90% as pass marks.
The true pass mark is 10%, because this lecture is a
compulsory subject. Therefore, we can evaluate
NMs of LDF, QDF, logistic regression, and Revised
IP-OLDF by 18 pass/fail determinations. It is
interesting that R
2
of the simple regression (final
exam scores are predicted by midterm exams scores)
and the correlation between the two variables were
very high in 2011 despite the course running for
only 11 weeks.
Table 3: Results over three years.
2010 2011 2012
Mid.
Exam
0% 31 25 21
10% 48 42 37
50% 66 61 63
90% 82 79 78
100% 93 88 88
Mean 65.1 56.1 58.8
Final
Exam
0% 22 26 20
10% 40 43 41
50% 60 60 58
90% 82 81 81
100% 91 99 95
Mean 59.3 57.1 58.8
R
2
/ r 0.29/0.54
0.49/0.7
0.26/0.51
3.2 Discrimination by Four Testlets
Table 4 shows the discrimination of four testlet
scores as independent variables for a 10% level of
the midterm exams. ‘P’ denotes the number of
independent variables selected by the forward
stepwise method. In 2010, T4, T2, T1, and T3 are
entered in the model selected by the forward
stepwise method. The MNM of Revised IP-OLDF
and NM of logistic regression are zero in the full
model, which means the data is linear-separable in
four variables. NMs of LDF and QDF are 9 and 2.
This means LDF and QDF cannot recognize linear
separability. In 2011, Revised IP-OLDF and logistic
regression can recognize that the 3-variable model
(T2, T4, T1) is linear-separable. In 2012, the 2-
variable model (T4, T2) is linear-separable. T4 and
T2 contain easy questions, and T1 and T3 consist of
difficult questions for fail group students. This
suggests that pass/fail determination using Revised
IP-OLDF can elicit the quality of the test problems
and understanding of students in the near future. It is
concluded that LDF and QDF cannot recognize
linear separability from these 18 results.
Table 4: NMs of four discriminant functions by forward
stepwise in midterm exams at the 10% level.
Year P Var. MNM Logi. LDF QDF
2010
1
T4
6 9 11 11
2
T2
2 6 11 9
3
T1
1 3 8 5
4 T3 0 0 9 2
2011
1
T2
9 17 15 15
2
T4
4 9 11 9
3 T1 0 0 9 10
4 T3 0 0 9 11
2012
1
T4
4 8 14 12
2 T2 0 0 11 9
3 T1 0 0 12 8
4 T3 0 0 12 1
Table 5 shows a summary of the 18 error rates
derived from the NMs of LDF and QDF for the
linear separable model shown in Table 4. Ranges of
the 18 error rates of LDF and QDF are [2.2%,
16.7%] and [0.8%, 10.8%], respectively. Error rates
of QDF are lower than those of LDF. At the 10%
level, the six error rates of LDF and QDF lie in the
ranges [4.2%, 11.9%] and [0.8%, 8.5%],
respectively. At the 50% level, they are [2.2%,
4.9%] and [2.3%, 5.0%], respectively, and at the
90% level, they are [3.3%, 16.7%] and [4.5%,
10.8%], respectively. Clearly, the range at the 50%
level is less than for the 10% and 90% levels.
Miyake & Shinmura (1976) followed Fisher’s
assumption, and surveyed the relation between
population and sample error rates. One of their
results suggests that the sample error rates of
balanced sample sizes are close to the population
error rates. The above results may confirm this.
These results suggest a serious drawback of LDF
and QDF based on variance-covariance matrices.
We can no longer trust the error rates of LDF and
QDF. Until now, this fact has not been discussed,
because there is little research using linear separable
data. From this point on, we had best evaluate
discriminant functions using linear separable data,
because the results are very clear. Heavy users of
discriminant analysis in medical and economics use
logistic regression instead of LDF and QDF, because
they know that the error rates of logistic regression
are less than those of LDF and QDF. On the contrary,
there are no stepwise model selection methods or all
combinations of independent variables (Goodnight,
1978) in logistic regression and Revised IP-OLDF.
In genome discrimination, researchers try to estimate
variance-covariance matrices using small sample
EndofDiscriminantFunctionsbasedonVariance-covarianceMatrices
11

sizes and large numbers of independent variables.
These efforts may be meaningless and lead to
incorrect results.
Table 5: Summary of error rates of LDF and QDF.
10% 50% 90%
LDF QDF LDF QDF LDF QDF
Mid.
10 7.5 1.7 2.5 5.0
16.7
9.2
11 7.0 8.5
2.2
2.3 10.5 6.7
12 9.9
0.8
4.9 4.8 13.6 7.1
Final
10 4.2 1.7 3.3 4.2 3.3
10.8
11 11.9 2.9 2.9 3.6 3.6 8.6
12 8.7 2.3 2.3 2.3 13.0 4.5
3.3 Discrimination by 100 Item Scores
Table 6 shows the pass/fail determination using 100
item scores as independent variables at the 10%
level for midterm exams in 2012. ‘P’ denotes the
number of independent variables selected by the
forward stepwise method. The MNM of the 6-
variable model is zero, as is the NM given by
logistic regression. In 1-variable and 2-variable
models, NMs of QDF were 14 and 114, respectively.
This is caused by the following special case. The
values of X15 for all students in the fail group are
constant, namely 0. On the contrary, scores of
students in the pass group are 1/0. In the case that
the value of some variable (X15) of one class (fail
group) is constant and the value in the other group
(pass group) varies, QDF misclassifies all 114
students of the second pass group into the first fail
group.
Inverse matrices of LDF and QDF cannot be
calculated if some variable is constant in equations
(2) and (3). Certain statistical software packages
exclude these variables from the discriminant
analysis. On the contrary, JMP enhances the LDF
and QDF algorithms using the generalized inverse
matrix algorithm, and also offers RDA. If QDF
detects irregular data such as outliers, JMP
recommends switching from QDF to RDF. However,
neither function can treat the special case correctly.
In this case, both functions misclassify cases of the
second class into the first class. This may be caused
by the assumption that cases vary, and the successful
statistical experience of adjusting the diagonal
elements of a matrix brings many outcomes. On the
contrary, if we add a small noise term, such as N(0,
0.0001), to the constant value, we can resolve this
problem. Column (*) shows the modified NMs of
QDF. If users can choose properly the modified
RDA option supported by this research, we would
expect to obtain better results than LDF, QDF, and
RDF. This is a topic for future work.
Table 6: NMs at the 10% level of midterm exams in 2012.
P Var. MNM Logi. LDF QDF (*)
1
X85
10 14 22
14
14
2
X15
6 6 22
114
28
3
X68
5 6 13 114 28
4
X47
3 8 13 114 28
5
X7
1 1 7 114 9
6 X32 0 0
7 114 3
7 X20 0 0 4 114 0
Table 7 shows NMs at the 10% level of midterm
and final exams over three years. The first row
shows the results from the 6-variable model in 2010.
The MNM of Revised IP-OLDF and NM of logistic
model are zero. NMs of LDF and QDF are 2 and 1,
respectively. The second row gives the results for
the 96-variable model, because all students can
answer four items correctly, and these variables are
removed from the full model. The MNM of Revised
IP-OLDF and NMs of logistic regression and LDF
are zero. NM of QDF is 109, because all pass group
students are misclassified. The third and fourth rows
give the midterm exam results in 2011. The third
row shows that the 12-variable model is linear-
separable, although the NM of QDF is 107. The fifth
row in 2012 shows that the 6-variable model is
linear-separable, and NM of QDF is 114. It is
concluded that QDF misclassifies all pass group
students into the fail group at the 10% level.
Table 7: NMs over three years (10% level).
Year P MNM Logi. LDF QDF
Midterm
Exam
2010
6 0
0 2 1
96
0 0 0 109
2011
12 0
0 2 107
98 0 0 0 107
2012
6 0
0 7 114
100 0 0 0 114
Final
Exams
2010
12 0 0 5
111
99 0 0 0 111
2011
8 0 0 4 4
97 0 0 0
110
2012
10 0 0 3
115
97 0 0 0 115
Table 8 shows the NMs at the 90% level over
three years. The NMs of logistic regression are not
zero for three linear-separable models. This shows
that logistic regression is not immune to the
unresolved problem. In addition to this result, we
know that all pass group students of QDF are
misclassified into fail group. There are no special
cases at the 50% levels for the midterm and final
exams, because about half of the students belong to
the pass/fail group can/cannot answer the 100
questions. On the other hand, there are special cases
at the 10% and 90% levels, because about 10% of
ICORES2014-InternationalConferenceonOperationsResearchandEnterpriseSystems
12

the fail group cannot answer, and about 10%
students of pass group can answer some items.
Table 8: NMs of three years (90% level).
Year P MNM Logi LDF QDF
Mid.
Exams
2010
13 0
1
4
13
96 0 0 0
13
2011 9 0 0 6
9
98 0 0 0
9
2012
15 0
1
1
12
100 0 0 0
12
Final
Exams
2010
11 0
1
6
13
99 0 0 4
13
2011 8 0 0 2
12
97 0 0 0
12
2012 9 0 0 6
12
97 0 0 0
12
3.4 Discrimination of 44 Japanese Cars
The special case above is more easily explained by
the discrimination of 44 Japanese cars. Let us
consider the discrimination of 29 regular cars and 15
small cars. Small cars have a special Japanese
specification. They are sold as second cars or to
women, because they are cost efficient. The
emissions and capacity of small cars are restricted.
The emission rate of small and regular cars ranges
from [0.657, 0.658] and [0.996, 3.456], respectively.
The capacity (number of seats) of small and regular
cars are 4 and [5, 8], respectively. Table 9 shows the
forward stepwise result. At first, “emission” enters
the model because the t-value is high. The MNM
and NMs of QDF and logistic regression are zero.
LDF cannot recognize linear separability. Next,
‘price’ enters the 2-variable model, although the t-
value of ‘price’ is less than that of ‘capacity’. The
MNM and NMs of QDF and logistic regression are
zero. LDF still cannot recognize linear separability.
In the third step, QDF misclassifies all 29 regular
cars as small cars after “capacity” is included in the
3-variable model.
Table 9: Discrimination of small and regular cars.
P Var. t LDF QDF MNM/Logi
1 Emission 11.37 2
0 0
2 Price
5.42
1
0 0
3 Capacity 8.93
1
29 0
4 CO2 4.27 1 29 0
5 Fuel -4.00
0
29 0
6 Sales -0.82
0
29 0
This is because the capacity of small cars is fixed
to four persons. It is very important that only QDF
and RDA are adversely affected by this special case.
LDF and the t-test are not affected, because these are
computed from the pooled variance of two classes.
4 K-FOLD CROSS-VALIDATION
Usually, the LOO method is used for model
selection with small sample sizes. In this research,
100-fold cross-validation is proposed, as it is more
powerful than the LOO method.
4.1 Hundred-fold Cross Validation
In regression analysis, we benefit from inferential
statistics, because the standard error (SE) of
regression coefficients, and model selection statistics
such as AIC and BIC, are known a priori. On the
other hand, there is no SE of discriminant
coefficients and model selection statistics in
discriminant analysis. Therefore, users of
discriminant analysis and SVMs often use the LOO
method. Let the sample size be n. One case is used
for validation, and the other (n-1) cases are used as
training samples. We evaluate n sets of training and
validation samples.
If we have a large sample size, we can use k-fold
cross-validation. The sample is divided into k
subsamples. We can evaluate k combinations of the
training and validation samples. On the other hand,
bootstrap or re-sampling methods can be used with
small sample sizes. In this research, large sample
sets are generated by re-sampling, and 100-fold
cross-validation is proposed using these re-sampled
data. In this research, 100-fold cross-validation for
small sample sizes is applied as follows: 1) We copy
the data from midterm exams in 2012 100 times
using JMP. 2) We add a uniform random number as
a new variable, sort the data in ascending order, and
divide into 100 subsets. 3) We evaluate four
functions by 100-fold cross-validation using these
100 subsets.
Revised IP-OLDF and S-SVM are analyzed by
LINGO (Appendix), developed with the support of
LINDO Systems Inc. Logistic regression and LDF
are analyzed by JMP, developed with the support of
the JMP division of SAS Japan.
There is merit in using 100-fold cross-validation
because we can easily calculate the confidence
interval of the discriminant coefficients and NMs (or
error rates). The LOO method can be used for model
selection, but cannot obtain the confidence interval.
These differences are quite important for analysis of
small samples. We now analyze four testlet scores in
2012.
4.2 LOO and Cross-validation
Table 10 shows the results of the LOO method and
EndofDiscriminantFunctionsbasedonVariance-covarianceMatrices
13
NMs in the original data. ‘Var.’ shows the suffix of
four testlet scores named ‘T’. Only 11 models were
showed, because four 1-variable models were
omitted from the table. The MNM of the 2-variable
model (T2, T4) in No. 6 is zero, as are those of the
4-variable model (T1-T4) in No.1, and the two 3-
variable models of (T1, T2, T4) in No. 2 and (T2, T3,
T4) in No. 3. The NMs of logistic regression and
SVM4 (c = 10
4
) are zero in these four models, but
NMs of SVM1 (c = 10
1
) are 2 and 3 in No.2 and
No.6, respectively. It is often observed that S-SVM
cannot recognize linear separablity when the penalty
c has a small value. The LOO method recommends
models in No.3 and No.6.
Table 10: LOO and NMs in original test data.
No Var. LOO LDF Logi MNM SVM4 SVM1
1 1-4 14 12 0 0 0 0
2 1,2,4 13 12 0 0 0 2
3 2,3,4 11 11 0 0 0 0
4 1,3,4 15 15 2 2 3 3
5 1,2,3 16 16 6 4 6 6
6 2,4 11 11 0 0 0 3
7 1,4 16 16 6 3 6 6
8 3,4 14 13 3 3 4 4
9 1,2 18 17 12 7 7 7
10 2,3 16 11 11 6 11 11
11 1,3 22 21 15 7 10 10
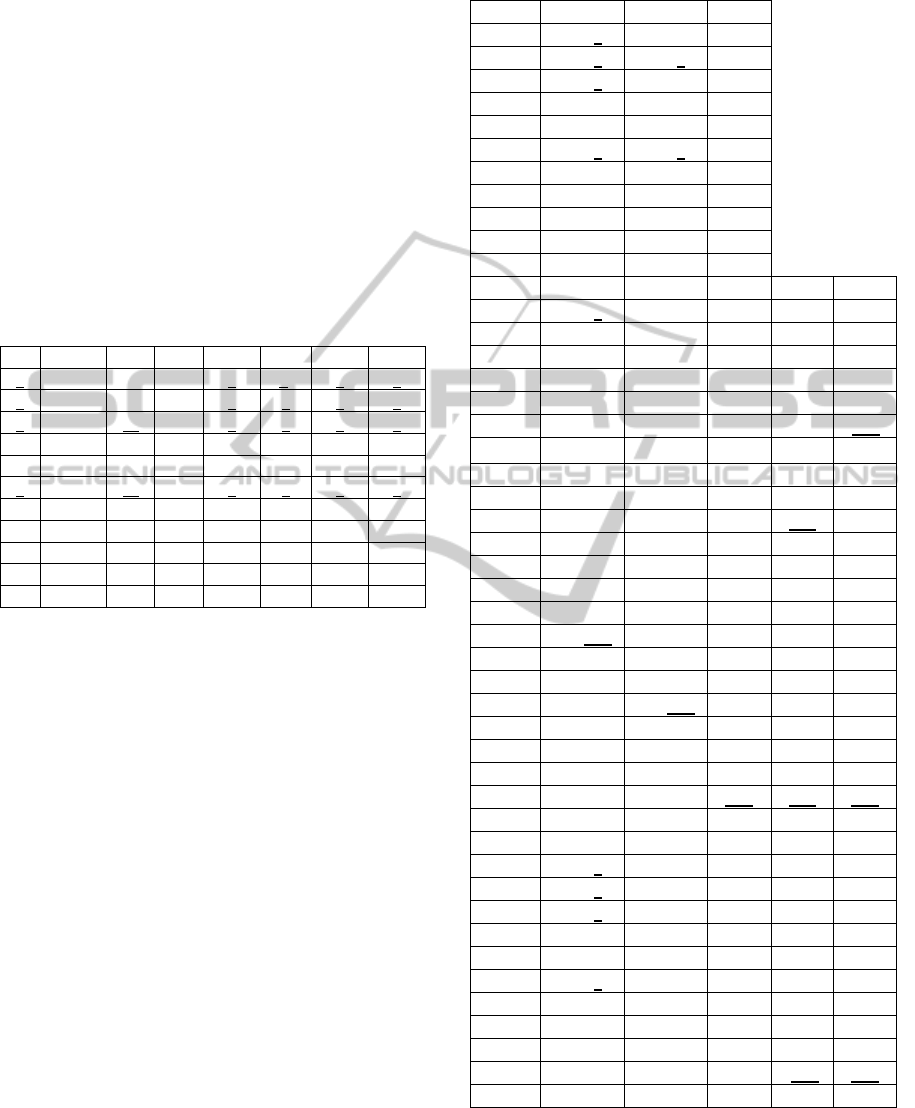
Table 11 shows the results given by Revised IP-
OLDF (MNM), SVM4, LDF, and logistic regression
(Logi.). ‘MEAN1’ denotes the mean error rate in the
training sample. Revised IP-OLDF and logistic
regression can recognize linear separability for four
models. For SVM4, only model No. 1 has an NM of
zero. The mean error rates of all LDF models are
over 9.48%. ‘MEAN2’ denotes the mean error rate
in the validation sample. Only two models (No.2 and
No. 6) of Revised IP-OLDF have NMs of zero. The
NMs of other functions are greater than zero, and
those of LDF are over 9.91%. We can conclude that
LDF is the worst of these four functions. Most
statisticians believe that NMs of Revised IP-OLDF
is less suitable for validation samples, because it
over fits for the training samples. On the other hand,
LDF does not lead to overestimation, because it
assumes a normal distribution. The above results
show that the presumption of ‘overestimation’ is
wrong. We may conclude that real data does not
obey Fisher’s assumption. To build a theory based
on an incorrect assumption will lead to incorrect
results.
‘Diff.’ is the difference between MEAN2 and
MEAN1. We think the small absolute value of ‘Diff.’
implies there is no overestimation.
Table11: Comparison of four functions.
MNM MEAN1 MEAN2 Diff.
1 0 0.07 0.07
2 0 0 0
3 0 0.03 0.03
4 0.79 2.44 1.65
5 2.25 4.64 2.39
6 0 0 0
7 1.78 3.40 1.62
8 2.28 3.14 0.85
9 4.88 6.63 1.75
10 4.52 6.42 1.90
11 4.94 7.21 2.27
SVM4 MEAN1 MEAN2 Diff. Diff1 Diff2
1 0 0.81 0.81 0 0.74
2 0.73 1.62 0.90 0.73 1.62
3 0.13 0.96 0.83 0.13 0.93
4 1.65 3.12 1.47 0.86 0.68
5 4.35 5.99 1.65 2.10 1.35
6 0.77 1.70 0.94 0.77 1.70
7 2.97 4.24 1.27 1.19 0.84
8 3.06 3.73 0.66 0.78 0.59
9 6.45 7.45 1 1.57 0.82
10 6.85 7.78 0.93 2.33 1.36
11 6.73 8.02 1.30 1.79 0.81
LDF MEAN1 MEAN2 Diff. Diff1 Diff2
1 9.64 10.54 0.90 9.64 10.47
2 9.89 10.55 0.66 9.89 10.55
3 9.48 10.09 0.61 9.48 10.06
4 11.44 12.04 0.6 10.65 9.60
5 12.36 12.68 0.32 10.11 8.04
6 9.54 9.91 0.37 9.54 9.91
7 11.77 12.16 0.40 9.99 8.76
8 10.81 11.03 0.22 8.53 7.89
9 13.19 13.46 0.28 8.31 6.83
10 12.49 12.65 0.16 7.97 6.23
11 16.28 16.48 0.20 11.34 9.27
Logi MEAN1 MEAN2 Diff. Diff1 Diff2
1 0 0.77 0.77 0 0.7
2 0 1.09 1.09 0 1.09
3 0 0.85 0.85 0 0.82
4 1.59 2.83 1.24 0.80 0.39
5 4.12 5.46 1.34 1.87 0.82
6 0 0.91 0.91 0 0.91
7 3.25 4.26 1.01 1.47 0.86
8 3.68 4.03 0.35 1.40 0.89
9 6.94 7.78 0.84 2.06 1.15
10 7.65 8.04 0.38 3.13 1.62
11 7.05 7.82 0.78 2.11 0.61
In this sense, LDF is better than the other
functions, because all values are less than 0.16.
However, only high values of the training samples
lead to small values of ‘Diff.’ ‘Diff1’ denotes the
ICORES2014-InternationalConferenceonOperationsResearchandEnterpriseSystems
14

value of (MEAN1 of other functions - MEAN1 of
Revised IP-OLDF) in the training samples, and
‘Diff2’ is the value of (MEAN2 of other functions -
MEAN2 of Revised IP-OLDF) in the validation
samples. The maximum values of ‘Diff1’ given by
SVM4 and logistic regression were 2.33 and 3.13,
respectively, and the maximum values of ‘Diff2’
given by these functions were 1.7 and 1.62,
respectively. The minimum values of ‘Diff1’ and
‘Diff2’ given by LDF were greater than 7.97% and
6.23%, respectively. It is concluded that LDF was
not as good as Revised IP-OLDF, S-SVM, and
logistic regression by 100-fold cross-validation.
In 2014, these results are recalculated using
LINGO Ver.14. The elapsed runtimes of Revised IP-
OLDF and S-SVM are 3 minutes 54 seconds and 2
minutes 22 seconds, respectively. The elapsed
runtimes of LDF and logistic regression by JMP are
24 minutes and 21 minutes, respectively.
5 CONCLUSIONS
In this research, we have discussed three problems
of discriminant analysis. Problem 1 is solved by
Revised IP-OLDF, which looks for the interior
points of the “Optimal Convex Polyhedron”
directly. Problem 2 is theoretically solved by
Revised IP-OLDF and H-SVM, but H-SVM can
only be applied to linear separable model. Error rates
of LDF and QDF are very high for linear separable
data. This means that these functions should not be
used for important discrimination tasks, such as
medical diagnosis and genome discrimination.
Problem 3 only concerns QDF and RDA. This
problem was detected using a t-test after three years
of investigation, and can be solved by adding a small
noise term to variables. Now, JMP offers a modified
RDA, and if we can find clear rules to choose proper
parameters, it may be better than LDF and QDF.
However, these conclusions are confirmed by the
training samples. In many cases, statistical users
have small sample sizes, and cannot evaluate the
validation samples. Therefore, a k-fold cross-
validation method for small samples was proposed.
These results confirm the above conclusion for the
validation samples. Many discriminant functions are
developed using various criteria after Warmack and
Gonzalez (1973). Ibaraki and Muroga (1970)
defined the same Revised IP-OLDF. The mission of
discrimination should be based on the MNM
criterion. Statisticians have tried to develop
functions based on the MNM criterion, but this can
now be achieved by Revised IP-OLDF using MIP. It
is widely believed that Revised IP-OLDF leads to
overestimations, but LDF is worse for validation
samples. It is a realistic option for users to choose
logistic regression if they do not use Revised IP-
OLDF or S-SVM. The evaluation of modified RDA
is a topic for future work.
ACKNOWLEDGEMENTS
My research started in 1997 and finished in 2012. It
was achieved by What’s Best! and LINGO of
LINDO Systems Inc., and SAS and JMP of SAS
Institute Inc.
REFERENCES
Edgar, A., 1935. The irises of the Gaspe Peninsula. Bulltin
of the American Iris Society, 59, 2-5.
Fisher, R. A., 1936. The Use of Multiple Measurements in
Taxonomic Problems. Annals of Eugenics, 7, 179–
188.
Flury, B., Rieduyl, H., 1988. Multivariate Statistics: A
Practical Approach. Cambridge University Press.
Friedman, J. H., 1989 . Regularized Discriminant
Analysis . Journal of the American Statistical
Association,84/405, 165-175.
Goodnight, J. H., 1978. SAS Technical Report – The
Sweep Operator: Its Importance in Statistical
Computing –
(R-100). SAS Institute Inc.
Ibaraki,T., Muroga, S., 1970. Adaptive linear
classifier by linear programming. IEEE
trans
action On systems science and cybernetics,
SSC-6, 53-62.
Lachenbruch, P. A., Mickey, M. R., 1968.
Estimation of
error rates in discriminant analysis.
Technometrics 10, 1-11.
Liitschwager, J. M., Wang, C., 1978. Integer programming
solution of a classification problem. Management
Science, 24/14, 1515-1525.
Sall, J. P., 1981. SAS Regression Applications. SAS
Institute Inc. (Japanese version is translated by
Shinmura, S.)
Sall, J. P., Creighton, L., Lehman, A., 2004. JMP Start
Statistics, Third Edition. SAS Institute Inc. (Japanese
version is edited by Shinmura, S.)
Schrage, L., 1991. LINDO-An Optimization Modeling
System-. The Scientific Press. (Japanese version is
translated by Shinmura, S., & Takamori, H.)
Schrage, L., 2006. Optimization Modeling with LINGO.
LINDO Systems Inc. (Japanese version is translated by
Shinmura, S.)
Shinmura, S., Miyake, A., 1979. Optimal linear
discriminant functions and their application.
COMPSAC79, 167-172.
EndofDiscriminantFunctionsbasedonVariance-covarianceMatrices
15

Shinmura, S., 1998. Optimal Linear Discrimrnant
Functions using Mathematical Programming. Journal
of the Japanese Society of Computer Statistics, 11 / 2 ,
89-101.
Shinmura, S., 2000. A new algorithm of the linear
discriminant function using integer programming. New
Trends in Probability and Statistics, 5, 133-142.
Shinmura, S., 2004. New Algorithm of Discriminant
Analysis using Integer Programming. IPSI 2004
Pescara VIP Conference CD-ROM, 1-18.
Shinmura, S., 2007. Overviews of Discriminant Function
by Mathematical Programming. Journal of the
Japanese Society of Computer Statistics, 20/1-2, 59-
94.
Shinmura, S., 2009. Improvement of CPU time of Revised
IPLP-OLDF using Linear Programming. Journal of
the Japanese Society of Computer Statistics, 22/1, 37-
57.
Shinmura, S., 2010. The optimal linear discriminant
function. Union of Japanese Scientist and Engineer
Publishing (in Japanese).
Shinmura, S., 2011a.Problems of Discriminant Analysis
by Mark Sense Test Data . Japanese Society of
Applied Statistics,40/3,157-172.
Shinmura, S., 2011b. Beyond Fisher’s Linear Discriminant
Analysis - New World of Discriminant Analysis -.
2011 ISI CD-ROM, 1-6.
Shinmura, S., 2013. Evaluation of Optimal Linear
Discriminant Function by 100-fold cross-validation.
2013 ISI CD-ROM, 1-6.
Stam, A., 1997. Nontraditinal approaches to statistical
classification: Some perspectives on Lp-norm
methods. Annals of Operations Research, 74, 1-36.
Markowitz, H. M., 1959. Portfolio Selection, Efficient
Diversification of Investment. John Wiley & Sons, Inc.
Miyake, A., Shinmura, S., 1976. Error rate of linear
discriminant function, F.T. de Dombal & F. Gremy
editors 435-445, North-Holland Publishing Company.
Vapnik, V., 1995. The Nature of Statistical Learning
Theory.Springer-Verlag.
Warmack, R. E., Gonzalez, R. C., 1973. An algorithm for
the Optimal Solution of Linear Inequalities and its
Application to Pattern Recognition. IEEE Transaction
on computing, C-22/12, 1065-1075.
APPENDIX
The important part of 100-fold cross-validation by
Revised IP-OLDF for the iris data (p=4, n=100) is
explained. “ ! Text strings ; ” is comment.
MODEL:
! SETS section defines one dimensional “set_name
/1..k/ : array_names; ” with k-elememts. SET P1 is
1-dimensional set with 5 elements including
constant, and the optimized discriminant
coefficients are stored in the array VAR. The
discriminant scores of the training and validation
samples are stored in the SCORE and SCORE2. IS
is a two dimensional array with (100, 5) elements
defined by 1-dimensional two sets of N and P1. The
training and validation samples are stored on Excel
and are input by “ IS, ES = @OLE(); in DATA
section”. MS controls 11 different discriminant
models. MB defines (11, 5) array named CHOICE
that defines independent variables in 11 different
models. ERR defines four (11,100) arrays such as
IC, EC, IC_2, EC_2 that store NMs in the training
and validation samples. ;
SETS:
P/1..4/:; P1/1..5/: VAR; P2/1..6/:;
N/1..100/: SCORE, E; N2/1..10000/: SCORE2;
MS/1..11/ : ; G100/1..100/ :; MS100/1..1100/ : ;
D(N, P1): IS; D2(N2, P2): ES;
MB(MS,P1): CHOICE;
ERR(MS, G100): IC, EC, IC_2, EC_2;
ENDSETS
! DATA defines the values of penalty c and Big M,
and input the data of CHOICE
, IS and ES from
Excel by “ CHOICE, IS, ES =@OLE( ) function ”. ;
DATA:
penalty=10000; bigm=10000;
CHOICE, IS, ES=@OLE( );
ENDDATA
! Define Revised IP-OLDF or S-SVM in this section.
“ @SUM(N(i): ” equals to ∑. “ @FOR(N(i): ”
defines 100 constraints and 100 binary integer e(i)
by SET N(i). ;
SUBMODEL RIP:
MIN=ER; ER=@SUM(N(i): E(i));
@FOR(N(i): @SUM(P1(j):IS(i,j)*VAR(j)*
CHOICE(k,j)) >= 1-BIGM*E(i));
@FOR(N(i): @BIN(E(i)));
@FOR(P1(j): @FREE(VARK(j)));
ENDSUBMODEL
! CALC control optimization models
( @SOLVE( ) ) by programming language using
@WHILE loops. NMs in the training samples (IC,
EC) and NMs in the validation samples (IC_2,
EC_2) are output by “ @OLE( )=IC, EC, IC_2,
EC_2; ”. K controls 11 models and F controls 100-
fold cross-validation. ;
CALC:
K=1; MSend=11;
@WHILE( K #LE# MSend: F=1;
@WHILE( F #LE# 100 : ……
@SOLVE(RIP); …..;
F=F+1;); K=K+1);
ENDCALC
DATA:
@OLE()=IC, EC, IC_2, EC_2; ENDDATA
ICORES2014-InternationalConferenceonOperationsResearchandEnterpriseSystems
16
