
Interactive Visualizer for the Extended Perspective System
as Support for Architectural Design
Robin Burgess
1
, Teresa Chambel
1
, Ana Paula Cláudio
1
, Maria Beatriz Carmo
1
, Carlos Albuquerque
1
,
José Vitor Correia
2
, Luís Romão
2
, Susana Rosado Ganhão
2
, Manuel Couceiro da Costa
2
,
Ana Santos Guerreiro
2
and Sara Garcia
2
1
Faculty of Science, University of Lisbon, Lisbon, Portugal
2
Faculty of Architecture, University of Lisbon, Lisbon, Portugal
Keywords: Non-linear Projection, Curvilinear Perspective, Drawing, Visualization, Architectural Design.
Abstract: The flexibility of free-hand drawing perspectives denotes the dynamic nature of human sight and no single
perspective system, linear or curvilinear, can translate human vision with such agility. For instance, linear
perspective cannot deal with large fields of view, and curvilinear perspectives introduce curvature in lines.
But together, complementing each other, they can overcome many of their limitations. This paper describes
an interactive computational tool for architectural visualization – a digital perspectograph that implements a
new theoretical and operative hybrid solution to perspective, the Extended Perspective System (EPS) – and
presents a user evaluation carried out to determine its usability, perceived usefulness, satisfaction and ease
of use, as an interactive tool to support the design process in architecture. It also aimed to learn about the
most effective and appreciated features and interface design options to support the EPS perspective, and
identify potential directions for improvement. The user study involved participants with different
backgrounds – students and experts, in the target audience of architects and informatics engineers with
experience in using and developing interactive tools, HCI and computer graphics. The visualizer was highly
appreciated, in terms of layout, available features, produced images and flexibility, and the most effective
design options were identified, mainly for their simplicity, visibility, and familiarity. It was considered
advantageous compared to conventional perspective visualizers, and users would like to see it integrated
into 3D modelling tools.
1 INTRODUCTION
The complexity and dynamics of human visual
perception can be observed, symptomatically, in the
structural
diversity of free hand perspective drawings.
No single rigorous geometric perspective system can
produce such a holistic graphical interpretation of
vision. For instance, linear perspective cannot deal
with
large fields of view without the known peripheral
distortions, while curvilinear perspectives alter the
geometric nature of lines.
Throughout the history of perspective, classical
linear perspective was counterpointed by several
authorial
propositions defining alternative curvilinear
perspective systems. These systems never gained a
broad
use, probably because of the intrinsic difficulty
of their graphical procedures. In fact, such
complexity renders its teaching and practice
complicated. But their sheer existence emphasizes
that linear perspective is just a particular intellectual
construct for pictorial purposes, and other ways of
translating visual data into depictions may be
considered. So, the notion of perspective may be
more inclusive, by addressing not just the result of a
static gaze, but also the overall result of dynamic
visual perception and visually based cognition.
The starting point for this research project was
previous work by members of the team: a systematic
approach to the issue of perspective that resulted in
the general formulation of a new representational
method called Extended Perspective System (EPS)
(Correia & Romão, 2007). This concept congregates
current perspective systems in a unified theoretical
build, turning them into just boundary states of a
broader dynamic system that contains an unlimited
set of new in-between states. The outcome is a
453
Burgess R., Chambel T., Cláudio A., Carmo M., Albuquerque C., Vitor Correia J., Romão L., Ganhão S., Couceiro da Costa M., Santos Guerreiro A. and
Garcia S..
Interactive Visualizer for the Extended Perspective System as Support for Architectural Design.
DOI: 10.5220/0004694604530463
In Proceedings of the 9th International Conference on Computer Graphics Theory and Applications (GRAPP-2014), pages 453-463
ISBN: 978-989-758-002-4
Copyright
c
2014 SCITEPRESS (Science and Technology Publications, Lda.)

significant increase in the variety of graphical
perspective states that fosters new applications,
useful in architectural drawing and design projects,
as well as virtual exploration of spatial and visual
immersiveness.
With the EPS, it is possible to generate
perspective images that convey larger fields of view
with less distortion for enhanced descriptive
capabilities. In addition, a computational tool that
implements the EPS concept has several advantages:
it supports complex calculations inherent to
curvilinear perspectives; allows users to quickly
explore different graphical perspective states in real
time by manipulating perspective parameters; is
compatible with digital formats widely used by
CAAD software.
Our multidisciplinary research team conceived
and implemented a novel digital perspectograph: a
tool, the EPS Visualizer, for producing vectorial
drawings from 3D architectural models, using new
alternative projection procedures.
This interactive application was designed and
implemented as a proof of concept of the EPS
conceptual model. By controlling a single camera
and a set of parameters, the user can visualize 3D
scenes and gain a better understanding of the spatial
characteristics of the model.
The challenge posed in the design of the
interface was to provide adequate support for the
distinctive EPS concepts. The interface has to
provide intuitive and effective interaction when
manipulating camera position, viewport control, and
projection surface parameters like radius and
eccentricity.
A user evaluation was carried out to determine
the EPS Visualizer usability, its perceived
usefulness, satisfaction and ease of use, to learn
about the most effective and appreciated features
and interface design options to support the EPS
perspective, receiving comments and suggestions,
and identify potential directions for inprovement.
This user study involved users with different
backgrounds - students and experts in architecture
and informatics.
This paper is organized as follows: section 2
describes some of the more relevant related work;
section 3 presents the ideas behind the formulation
of the EPS and addresses its definition; section 4
describes the EPS Visualizer; section 5 presents the
user evaluation; section 6 draws conclusions and
presents future work.
2 RELATED WORK
A common characteristic of the main historical
approaches to curvilinear perspective is that they
configure static concepts of perspectograph, by
electing a single kind of projection surface and
stipulating unique graphical procedures.
Hansen (1973) developed a hyperbolic linear
perspective, trying to respond graphically to the
historically alleged curvatures sensed in vision.
Casas (1983) and Moose (1986) developed graphical
methods to obtain 360º degrees spherical perspective
depictions of space. Barre and Flocon's (1968) La
perspective curviligne establishes the use of a sphere
surrounding the viewer as the ideal depiction
surface, where equal visual magnitudes would have
corresponding equal projected magnitudes.
However, for pragmatic purposes, the depiction is
then transferred to a picture plane with the
cartographic procedure that less distorts those
magnitudes. A very similar method, Perspective
Spherique, was also proposed by BonBon (1985).
Another curvilinear system, with a diffuse origin, is
the cylindrical perspective, where projections are set
upon a cylindrical surface. This surface is then
unrolled in order to obtain a final depiction on a
picture plane. This kind of perspective has recently
gained a broader visibility through digital panoramic
photography.
Our approach, as will be described, proposes a
more versatile concept, based on different principles:
the curved projection surface becomes mutable,
within specific constraints, and graphical results are
consequence of mapping that surface onto a planar
surface, using one of multiple alternative methods.
In computational drawing, linear perspective is
the prevalent system regarding the production of
depictions that intend to simulate the direct visual
appearance of things. But, despite its effectiveness,
it cannot deal with large fields of view, where raised
distortions will, at the limit, compromise the
recognition of the represented objects. Alternative
curvilinear systems, cylindrical and spherical
perspectives, much less known and hardly used, can
overcome this difficulty. These systems can translate
graphically the result of a viewer’s sight in motion,
conveying a sense of dynamic vision, although at the
cost of bending the represented straight lines. The
three systems: linear, cylindrical and spherical
perspectives, despite being separate theoretical
builds, can have complementary roles, in terms of
representational capabilities.
Several computational tools have been
implemented for curvilinear perspective, using a
GRAPP2014-InternationalConferenceonComputerGraphicsTheoryandApplications
454
number of different techniques. Some are based on
raytracing, such as in works like (Wyvill and
McNaughton, 1990; Glassner, 2000; Gröller, 1995;
Weiskopf, 2000). Though ray tracing solutions are
powerful, they are also computationally quite heavy.
Other approaches have used multiple cameras to
produce single images, such as (Rademacher and
Bishop, 1998; Agrawala et al., 2000; Singh, 2002;
Yu and McMillan, 2004). These approaches are
often artistic in nature and are not suitable to
reproduce the rigorous single-camera projections
that architects require.
Trapp and Döllner (2008), used cube mapping,
as described by (Gröller, 1995), to capture the
environment efficiently using established techniques
and maximizing the use of the capabilities of
graphics cards. They then applied transformations on
to those images in order to achieve the desired
curvilinear projections.
Brosz et al. (2007) described a projection
framework based on a flexible viewing volume. This
parametrically defined volume functions as a single
camera and as a projection surface and can take on
an almost inexhaustible number of different shapes.
This allows the framework to simulate a variety of
linear, non-linear and custom artistic projections.
The main purpose that led the team was the
design of a tool that implements a single unified
perspective system with which a much wider range
of possible perspective representations of an object
or a scene can be generated.
3 CONCEPTUAL MODEL
In the formulation of the EPS, linear (or planar),
spherical
and cylindrical perspectives were considered
fundamental landmarks to take into account. Next, we
present the conceptual model of EPS and show its
application in an architectural scene.
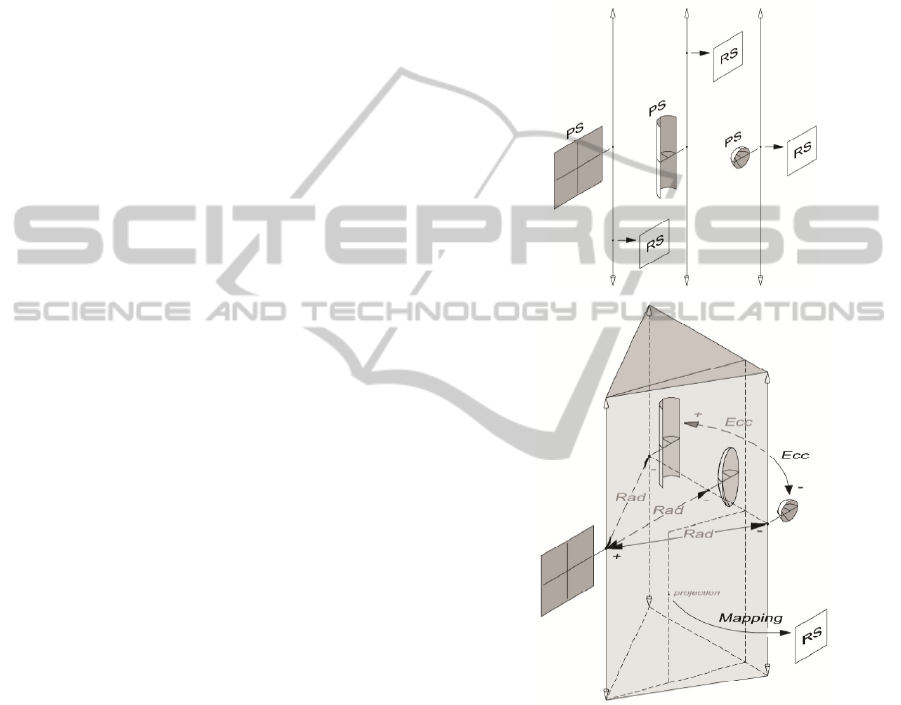
3.1 The Extended Perspective System
Three fundamental principles characterize the
framework of the EPS: first, the separation of the
projection
surface (PS) from the representation
surface (RS); second, the mutability of the projection
surface; and third, the selection of the methods for
transferring the projections from the PS to the RS.
The PS is the surface upon which the scene is
initially projected. The RS is the surface on to where
the projected information is then transferred, thus
producing the final result or perspective depiction.
These guidelines led to the following particular
specifications of the EPS: (a) the RS is a plane; (b)
the PS is a spheroid (an ellipsoid with a vertical axis
of revolution), initially having its center on the
viewer position, and tangent to the RS at a point on
its equator, which is also the viewer's target point;
(c) the spheroidal PS is subjected to parametric
transformations, controlled by two parameters:
radius (Rad) and eccentricity (Ecc).
Figure 1: The three referential perspective systems: planar,
cylindrical, spherical – separated (top), and gathered by
the EPS concept (bottom).
The Rad parameter defines the distance between the
target point and the centre of the PS. By
incrementing Rad, the center of the PS detaches
from the viewer and moves backwards along the
visual axis, so the PS is progressively up-scaled.
With an infinite Rad, the PS becomes a plane,
coinciding with the planar RS. Along variation of
the parameter Rad, in both directions, an infinite
number of intermediate states of PS is found. This
parameter determines the overall curvature of
depicted lines and attainable field of view.
InteractiveVisualizerfortheExtendedPerspectiveSystemasSupportforArchitecturalDesign
455
The Ecc parameter defines the ratio between the
vertical axis and the equatorial diameter of the
spheroidal PS. By incrementing Ecc, the spheroid
becomes progressively elongated. With Ecc at its
lower limit (1:1), the surface is a perfect sphere, and
at infinity the surface is cylindrical. Again, an
infinite number of intermediate ellipsoidal states can
be found. This parameter determines the curvature
of the vertical lines in the final depiction.
So, with the combined effect of the two
parameters, the PS can assume diverse forms, going
from spherical, to cylindrical or planar and through
an infinite number of intermediate states. This
relationship is seen in Figure 1.
Therefore, the EPS is able to reproduce planar,
cylindrical or spherical perspectives and, moreover,
an
infinite number of in-between hybrid perspectives.
When implementing and testing the EPS algorithm,
it proved necessary to separate the calculations of
cylindrical
projection, planar projection and
spherical/ellipsoidal projection. While in initial
conception cylindrical projection corresponded to
ellipsoidal projection with an infinite eccentricity
value, they turned out not to be entirely identical and
required different methods of mapping onto the
representation surface.
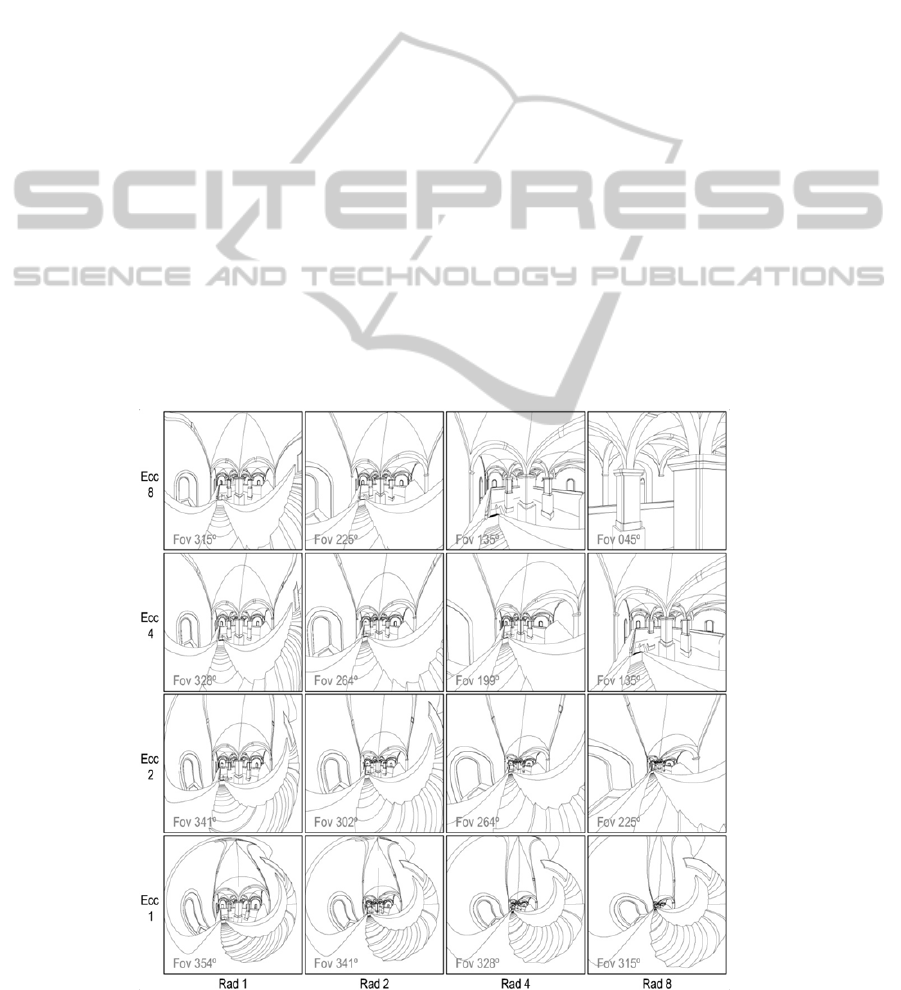
3.2 EPS in an Architectural Scene
The use of the new parameters Rad and Ecc in
addition to the already established variables, like
'distance' or 'zoom', turns perspective depiction of an
object into a choice made from a much wider range
of possibilities. Nonetheless, the number of variables
to control can be reduced by making some of them
dependent on others, for meaningful combinations.
In Figure 2, a set of 16 images, resulting from
variations of Rad, Ecc and Field of View (zooming
effect), exemplifies that diversity.
On the lower left corner, the EPS depiction turns
into current spherical perspective. On the upper left
corner, the EPS depiction nearly turns into current
cylindrical perspective. On the upper right corner,
the EPS depiction resembles current linear
perspective, with a narrow field of view. In the
middle, we find EPS hybrid depictions.
It is noticeable that a full range (0-360º) of field
of view is attainable, despite the eventual
anamorphic character of the image or some of its
parts. We believe it shall depend on the EPS user to
evaluate and decide on the appropriateness of the
depiction, regarding the specific representation
purposes or intents of visual analysis.
Figure 2: A table of diverse EPS depictions of an architectural scene - Mãe d’Água reservoir in Lisbon.
GRAPP2014-InternationalConferenceonComputerGraphicsTheoryandApplications
456
4 EPS VISUALIZER
The EPS Visualizer is an interactive application
designed and implemented as a proof of concept of
the EPS conceptual model. By controlling a single
camera and the parameters (Rad, Ecc, FoV), the user
can visualize 3D scenes and gain a better
understanding of the spatial
characteristics of the
model. To test alternative interface options, two
versions of the EPS Visualizer were conceived –
version A (VA) and version B (VB). The main
features and the evaluation of
the Visualizer are
presented in the next subsections.
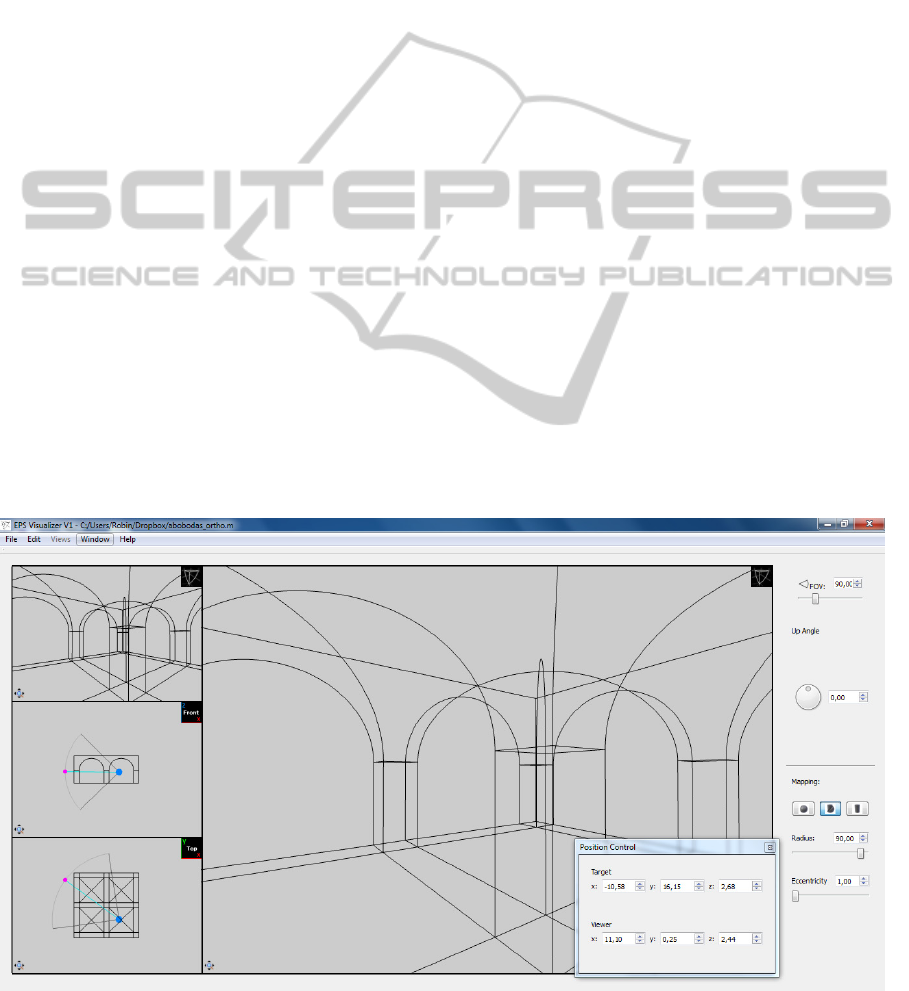
4.1 Layout
The layout of the main window is a simple one that
does not stray far from familiar ground (Figure 3).
There are four viewports, one larger and the other
three organized vertically on the left side of the
screen. Apart from these four viewports the main
window has only a small menu on the top left with
the File, Edit, Views, Windows and Help menus.
Each viewport can show one of eight different
views. Two views show the point of view of a
camera, one using EPS projection and the other
using classical perspective. The other six views
show orthogonal side-views of the model, one for
each of the six axis-aligned views: front, back, top,
bottom, left and right. By default, the large viewport
displays the EPS View.
An icon on the top right corner of each viewport
indicates which view is currently active on that
viewport, and a small button on the lower left corner
corresponds to the extend view option.
4.2 Camera and Cursor
The camera on which the EPS and classical
perspective views are based is defined by two points
and an up angle. The viewer point indicates where
the camera is located and the target point indicates
what direction the camera is looking at. The up
angle then gives the vertical orientation of the
camera's image, which would correspond to a
rotation of the camera along the viewer-target axis.
The camera's viewer and target points are
displayed on each of the six orthogonal views as a
part of the camera cursor. The camera cursor is
composed of a blue sphere that represents the viewer
point, a magenta sphere that represents the target
point and a circle sector (the circle is centred in the
Viewer and the Target is a point on the circle) of
which the internal angle corresponds to the field of
view of the camera. A thin circle sector represents a
narrow field of view, while a complete circle
represents the full 360º field of view. (The cursor
can be visualized in Figure 4, in each of the four
bottom viewports.)
It is possible to control the position and direction
of the camera in two ways. First, it is possible to
input the coordinates of the viewer and target points
directly in the position control window (Figure 3,
Figure 3: The EPS Visualizer Layout.
InteractiveVisualizerfortheExtendedPerspectiveSystemasSupportforArchitecturalDesign
457
bottom right). Second, it is possible to drag these
two points on the orthogonal views where the
camera cursor is displayed (Figure 4).
Two modes of dragging the points were
conceived. One mode, in VB, involves holding the
mouse over the viewer or target cursor sphere so that
it is highlighted. Then the left mouse button is
pressed and the corresponding point is dragged. It is
possible to drag both points together by pressing on
the line that connects the two points. This is a fairly
familiar point, click and drag method.
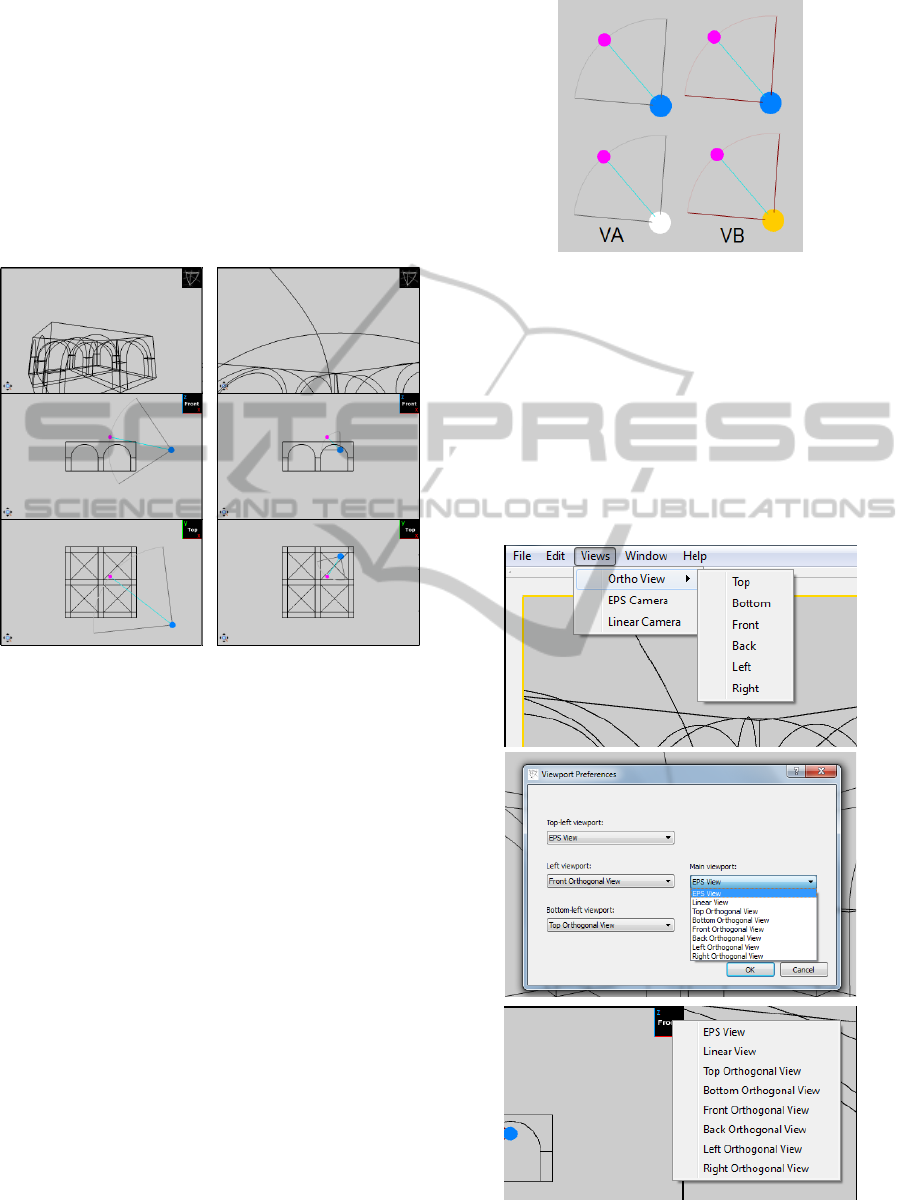
Figure 4: Camera and Cursor: Movement of the camera
and its effects (initial position in left column and final
position in right column). Viewports in: EPS view (top);
front view (middle); and top view (bottom).
The other mode, in VA, does not require the mouse
to be held over the point. Instead any point in the
viewport is acceptable. If the left mouse button is
pressed and the mouse dragged, the viewer point
will be highlighted and dragged along with it. If the
right mouse button is pressed, then the target point
will be highlighted and dragged instead. To move
both points in parallel, the user needs only to press
both buttons. While this method is less intuitive than
the other, it is potentially more efficient once the
user has grown accustomed to it.
Two possible colour schemes were chosen for
the cursor (Figure 5). One colours only the viewer
and target sphere, aiming to highlight only that
which can be dragged by the mouse (VA). The other
also colours the circle sector (red), highlighting the
selected controls in yellow, and displaying the three
icons (red circle sector, blue sphere, magenta sphere)
in their corresponding input boxes and sliders in the
control windows (VB).
Figure 5: The two cursor colour schemes (VA: minimal
colour; VB: colourful), in normal (top) and highlighted
viewer (bottom) modes.).
4.3 Viewport Control
By default, the four viewports display the EPS
camera view in the main viewport and the classical
perspective camera, front view and top view in the
other three viewports. However, three different
methods of changing the view of a viewport were
devised. Method 1 (Figure 6, top) requires the user
Figure 6: Changing the view: method 1, 2 and 3 (from top
to bottom).
GRAPP2014-InternationalConferenceonComputerGraphicsTheoryandApplications
458

to select the viewport by clicking on it, activating
the Views menu and picking the view they want
from that menu. Method 2 (Figure 6, middle)
requires the user to open a settings window from the
menu. The settings window has four dropdown
menus, one per viewport, and changes the views by
selecting them in the corresponding dropdown
menu. Method 3 (Figure 6, bottom) is the simplest,
requiring the user to click on the symbol at the top
right corner of the viewport and selecting the view
from the menu that pops up under the mouse.
Each viewport can also be panned by dragging
with the middle mouse button. While holding the
mouse over one of the orthogonal views, the mouse
wheel will zoom in and out. Over the two camera
views, the mouse wheel will control the FoV. The
zoom extends button, found in the lower left corner
of the viewport will re-centre the image. For the
orthogonal views it will also set the zoom so that the
whole model fits in the viewport; it will not change
the FoV for the two camera views.
4.4 Projection Control
Apart from the main window, the most important
window is the projection control window (Figure 3,
right). This window contains input boxes, sliders and
buttons, for the field of view, up angle, mapping
mode, radius and eccentricity parameters. The FoV,
up angle, radius and eccentricity parameters are each
controlled by an input box and a slider, the input box
doubling as a display for the current value. The up
angle slider is in the form of a dial. The mapping
mode is controlled by either a single button or one
per mode. The single button displays the current
active mode and clicking on it cycles through the
various modes. The alternative method has a smaller
button per mode, which remains pressed while the
corresponding mode is active. Each button has a
symbol representing the mapping mode but will
display the name of the mode in a tool tip.
5 USER EVALUATION
A user evaluation was carried out to determine the
EPS Visualizer usability, its perceived usefulness,
satisfaction and ease of use, as a tool to support the
design process in architecture. It was also aimed at
making decisions in regards to the various
alternative methods
designed, receiving comments
and suggestions, and identifying aspects to refine.
For a more comprehensive evaluation, this user
study involved users with different backgrounds -
students and experts, in the target audience of
architecture and informatics with experience in
using and developing interactive tools, HCI and
computer graphics.
5.1 Method
The evaluation followed a task-oriented approach
based mainly on Observation, and one-on-one semi-
structured Interviews, followed by a final
Questionnaire aiming at a global opinion on
usefulness of and user experience with the EPS
Visualizer.
Each interview would take place between one
interviewer and one subject, in front of a computer
with two screens, each screen displaying one of the
variant visualizers (VA and VB). After explaining
the purpose of the evaluation and a brief
introduction about the concept behind the Visualizer,
demographic questions were asked, followed by the
presentation of a short video demo (3 min) about the
Visualizer, around 7 min of free exploration, and a
set of 4 main tasks with the two versions of the
software, each version implementing different
options in regard to the alternative interfaces.
The fisrt three tasks, and their subtasks, took the
user through each feature and variant of the
interface. If a particular feature had a variant, then
the user would be prompted to try both versions and
indicate their preference. The order in which the
variants were tried was defined at the beginning of
the interview, being chosen alternately so as not to
favour one of them over the other. The fourth task
was more complex and free-form, requiring the
users to use the interface to reach a goal, in the form
of an image that they were to reproduce with the
visualizer. By this point, they would already be quite
familiar with the basic features of the interface.
During the tasks, the interviewer observed and
registered whether each sub-task was successful,
ocurring errors, hesitations, performance, comments,
and the resulting image of the fourth task (exported
from the Visualizer). At the end of each of the main
sub-tasks, users provided a 1-5 (very bad – very
good) rating based on the USE questionnaire (Lund,
2001), for Usefulness, Satisfaction and Ease of use.
Finally, users filled in a questionnaire about their
experience with the software, focusing on their
global opinions and including the well known SUS:
System Usability Scale (Brooke, 1996) usability
questions, due to its simplicity and robustness,
allowing some standardized usability measures that
are considered reliable. The answers were mostly in
the form of a 1-5 scale (‘never’ to ‘always’; or ‘very
InteractiveVisualizerfortheExtendedPerspectiveSystemasSupportforArchitecturalDesign
459

weak’ to ‘very good’ and NA for 'not applicable’),
with some open ones, allowing the students to
express their opinions more freely.
Each evaluation session (tasks + interview +
questionnaire) took a rough average of one hour.
5.2 Population
The evaluation process had the participation of 50
subjects. Most of the population could be separated
into three groups: ASG – Architecture Students
Group – with 24 first and second year subjects, aged
18-20; APG – Architecture Professionals Group –
with 14 subjects, 13 from architecture and 1 in the
related fields of mathematics, geometry and
painting, aged 27-62; all of them working
professionally in these areas, 5 BSc, 3MSc, 6 PhD;
all but 2 have experience in architectural projects,
for 13 years on average; and IEG – Informatics
Engineering Group - with 12 subjects, 9 MSc and 3
PhD students of computer engineering who took
courses on computer graphics and HCI, aged 23-32.
Almost all the participants had prior experience
with 3D modelling software, and most reported
using perspective views in these software tools. Half
of the APG users resported knowing the concept of
curvilinear perspective; also half reported already
knowing of the EPS perspective concept. They also
reported drawing by hand in perspective fairly
frequently (Mean (in 1-5 scale): 3.5; Standard
Deviation: 1.0), and playing 3D videogames rarely
(1.6;1.0). 63% of ASG users knew the curvilinear
perspective concept, but none knew about the EPS
concept. They draw by hand in perspective more
frequently than other groups (3.9;0.9), but seldom
play 3D videogames (1.9;1.0); whereas the IEG
users knew of neither curvilinear or EPS perspective
concepts, and rarely draw by hand in perspective
(1.7;0.9), but they play 3D video games quite often
(3.8;1.2).
5.3 Results
The analysis of the collected data allowed finding a
tendency in perceived usefulness, ease of use and
satisfaction with the Visualizer, comparing design
alternatives, assessing main usability aspects, and
obtaining feedback from target users. The main
results are presented next; some aspects are
highlighted by graphics, and reflected in the most
proeminent comments that are presented.
5.3.1 Initial Observations
During their initial exploration of the software, users
noticed the absence of the orbit viewer, and a real-
time update in the EPS View. Some users suggested
the zoom command be made uniform, as different
zooming types are activated in the same way -
graphical zoom in orthogonal views and FoV in
camera views.
5.3.2 Camera and Cursor
In task one, users began by importing a given model,
which they easily accomplished. They then
introduced numerical values for the camera position,
radius and eccentricity and FoV, which they found
to be easy to use (4.8;0.4) and satisfactory (4.5;0.8).
Notably, the APG user group had greater ease and
satisfaction with this subtask. Afterward, users were
given two orthogonal projections of the model, seen
from the top and front views, where points were
marked for the viewer and target. They were asked
to place the two points near the marked positions by
dragging the cursor in both variants of the software
(dragging by using each mouse button for each
element - viewer or target (VA) vs. by clicking on
the element (VB)). When asked which version they
preferred, users overwhelmingly chose VB (84%)
over VA (16%). They indicated that it was easier to
use (VA:3.8;1.0;VB:4.5;0.6) and were more satisfied
(VA:4.2;0.7;VB:4.6;0.6), and reported finding VB
more intuitive. Indeed the alternative is not
commonly found and is thus less familiar. Some of
the users who preferred VA promptly identified it as
a shortcut with the potential to be appreciated more
by more experienced users in the long term.
Users also preferred the colour scheme where the
circle sector and the highlighted control were
coloured (VB:83%) over the one that only coloured
the viewer, target and connecting line (VA:17%), as
they found it to be more easily distinguished from
the background and the 3D model itself.
5.3.3 Viewport Control
In task two, users were first asked to change one of
the viewports to a given view, being given no
indication of how or even that there were three
alternate methods to arrive at this result.
Of the three methods (M1, M2, M3), the users
most often first found method 3 which required the
users to click on the symbol at the top right corner of
the viewport (M1:28%;M2:8%;M3:64%). They were
then shown all three methods and were asked which
they preferred. The most popular was 3 (94%), due
to being faster and more direct. In a distant second
place was method 1 (6%) that required the selection
of the viewport and use of the Views menu. Indeed,
GRAPP2014-InternationalConferenceonComputerGraphicsTheoryandApplications
460
method 1 was most often indicated as being an
alternative method to method 3. Despite being the
least preferred option (0%), method 2 was
sometimes indicated by users as being a good option
for setting the default views for each viewport, as
opposed to when spontaneously changing a viewport
while working. The ASG and APG groups were the
ones who found this subtask the easiest.
For the next subtask, users were required to use
the zoom and pan features of the viewports so as to
focus a viewport on a given detail of the model.
Here too, they were given two variants to try, where
the mapping between the mouse wheel and the zoom
function was inverted. The majority of users
expressed a preference for the choice where a
forward movement of the mouse wheel results in
zooming in and a backwards movement results in
the opposite effect (73%). APG was the group that
found manipulating the viewport the easiest.
The last subtask of task two required users to
turn on the grid (U(sefulness):3.1;1.3; S(atisfaction):
3.2;1.2; E(ase of Use):3.7;1.1).
5.3.4 Projection Control
Task three began by requiring the subject to switch
the mapping mode. The two variant button schemes
were used. Between the two, users preferred having
multiple buttons (73%) as opposed to a single one,
as it made all the possible options immediately
visible to the user and was more efficient. However;
users also indicated some confusion about the
meanings of the icons used.
Again, the APG and ASG groups found this task
the easiest and most satisfactory.
Task three then requires the users to rotate the
image by 95°, render the image, save the projection
as an epsv file and export an SVG image of the EPS
view. The Up Angle was considered more easy to
use (4.6;0.6), than satisfactory (3.7;1.2) or useful
(3.4;1.1).
5.3.5 Final Task: Reproduce an Image
in EPS
The fourth task required the use of EPS Visualizer,
and its specific features to recreate a given image. It
was more complex and free-form than the previous
tasks. Users seemed to have some difficulty with the
task due to their initial unfamiliarity dealing with a
different way of perceiving space and interpreting
the image perspective, and yet they evaluated the
Visualizer’s ease of use during the task as (3.4;0.8).
Almost all users found the use of the mouse
consistent (Yes:92%; No:8%; S:4.2;0.9;E:4.1;0.8)
and found the radius and eccentricity parameters
very useful (Radius:4.2;0.7;Eccentricity:3.8;1.0).
The eccentricity parameter was found less useful by
the IEG than by the architecture groups (ASG and
APG), which is understandable due to the less
familiarity with the use of different perspectives.
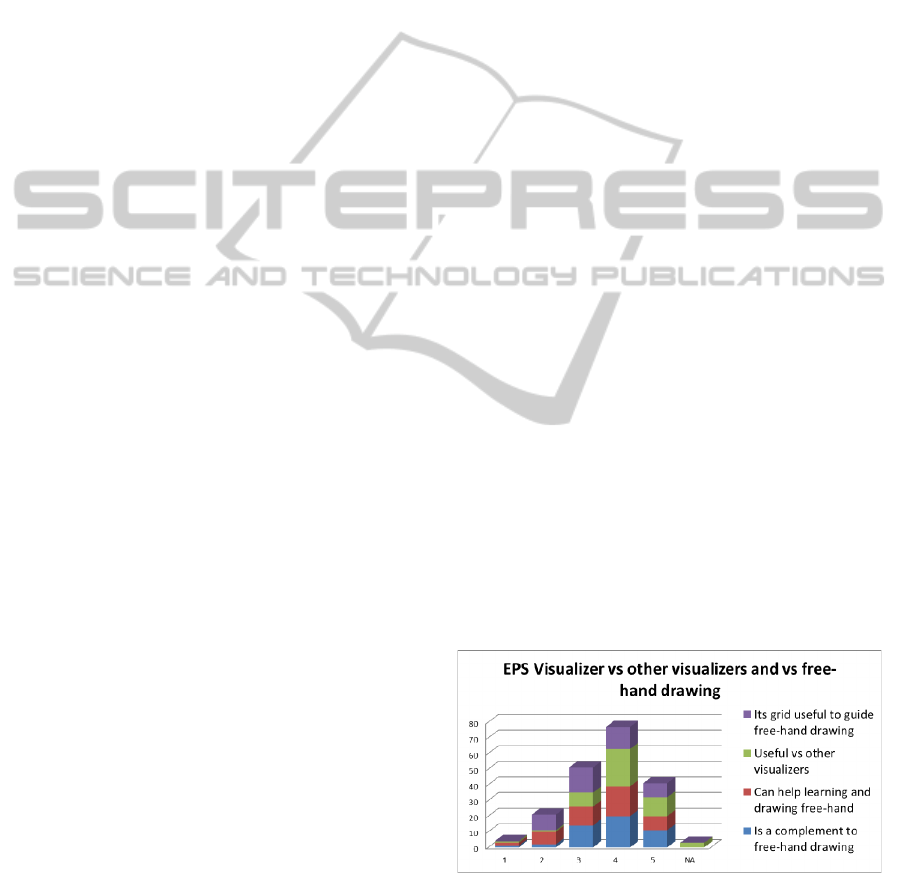
5.3.6 Global Opinion
Users stated that they would use the EPS Visualizer
as a support for the design process, during the stage
of prior study and development quite often (3.9;0.9),
and during the final stage of presentation just as
often (3.8;1.1). They often found the EPS Visualizer
to be a complement to free-hand drawing (3.8;0.9)
(Figure 7), and an aid in learning and drawing in
free-hand style (3.5;1.1). When compared with other
conventional perspective visualizers, users found the
EPS Visualizer advantageous (4.0:0.9). They also
found the Grid useful to guide free-hand drawing in
perspective (3.4;1.0). As suggestions for additional
graphical elements, four users mentioned XYZ axis,
two suggested the inclusion of a horizon line
reference, and also two suggested the grid should be
more flexible to allow free positioning and 3D.
The answers to the SUS usability questions were
processed in the standard way by converting the
answered values so that they would fit a 0-4 scale
(less-more positive), and then adding them up and
multiplying the total by 2.5, reaching a 0-100 value
– the SUS score for each user answers. The average
SUS score in our case was 76 (std:12), which is a
very positive result, reflecting the appreciation of the
system. Most salient results refer to not finding the
application cumbersome (3.5), much too inconsistent
(3.2), unnecessarily complex (3.2), found the various
functions
well-integrated (3.2) and would imagine that
most people would learn to use it very quickly (3.1).
Figure 7: EPS Visualizer vs. other perspective visualizers
and free-hand drawing.
When asked about some global EPS Visualizer
features (Figure 8), in general the users showed no
particular preference (nor were there visible trends
InteractiveVisualizerfortheExtendedPerspectiveSystemasSupportforArchitecturalDesign
461
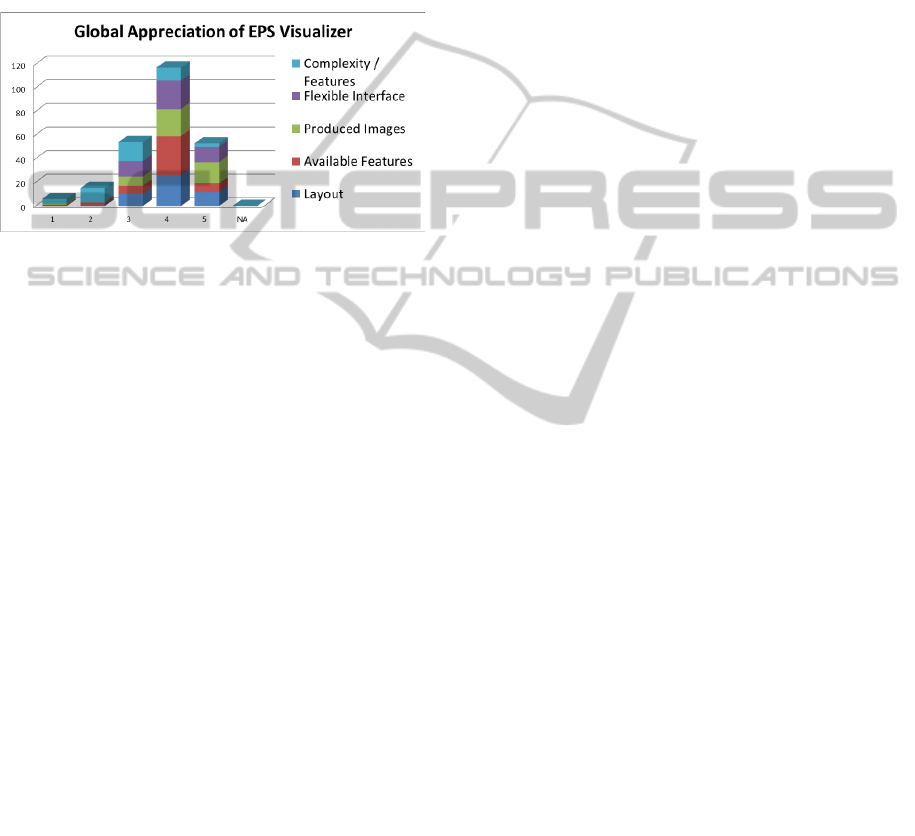
in the different user groups), between layout,
available features, produced images, and flexible
interface. Most of them did not find the system too
complex for the available features, hence the higher
frequency of lower values in this dimension.
Although the differences between user groups are
small: for ASG and APG users, the EPS resulting
images were the most important, whereas for IEG
users, it was the available features that were most
important.
Figure 8: Global Appreciation of EPS Visualizer.
As for future versions: most users would like to see
the EPS features integrated into 3D modeling tools
(4.3,0.9), although more by APG (4.5;1.1), then by
the ASG (4.3;0.08), and IEG (4.0;0.6); and
suggested other applications for the EPS Visualizer,
such as product design, video games, education (e.g.
concept illustration in analytical geometry classes),
and photography. As for what to add to the EPS
Visualizer, four mentioned 3D modeling, more
advanced graphics rendering, among others, mainly
concerned with additional flexibility. They found the
presented demo useful (4.5;0.9). The most
appreciated features included: the new perspective
possibilities; the ease of use; increased field of view;
easier perspective of space; viewer and target
manipulation; and the simplicity of the interface.
Least
appreciated features included: the floating
windows overlapping the main window, although the
possibility
to integrate them at the borders of the main
window
was already implemented but not yet visible;
inability to move the camera via the EPS and linear
views;
confusing viewer and target control (in contrast
with being considered a favourite by other users).
6 CONCLUSIONS AND FUTURE
WORK
This paper described the EPS Visualizer, aimed at
supporting the design process in architecture and
presented a user evaluation of its interface and
usefulness.
This interactive tool implements the EPS
representational system, with flexibility in the
parametrization of the perspectives. It allows users
to interactivelly control the radius and eccentricity of
the projection surface, while navigating in the 3D
scene, by controlling the camera and the viewport,
as a way to explore and learn about perspective,
make drawings in diverse new types of perspectives
and support free-hand drawing, e.g. through the use
of grids. In the evaluation carried out to determine
its usability as a tool to support the design process in
architecture, the visualizer was very appreciated, in
terms of layout, available features, produced images
and flexibility, and the most effective design options
were identified, mainly for their simplicity,
visibility, and familiarity. SUS usability scores also
confirm this general satisfaction with the use and
adoption of this tool.
Overall, the results validate interface design and
encourage future work highlighting directions for
improvements and new developments.
These directions include: improving camera
control features; rendering capabilities; integration
with existing 3D modeling software, this way the
EPS depictions could be used together with editing
and throughout all the design process; development
of the EPS system itself, adding new parameters and
projection surfaces and thus increasing the variety of
projections available to the user; and expansion
beyond the domain of architectural design into other
realms such as product design, videogames,
education, art and culture, through new ways to
communicate and depict the world.
ACKNOWLEDGEMENTS
This work was financially supported by the
Portuguese Foundation for Science and Technology
(FCT) through the NAADIR project (PTDC/AUR-
AQI/098388/2008) and by the R&D units LaSIGE
and LabMAg. We are grateful for the assistance of
Vera Sanchez Osório and Diogo Pereira Henriques
in the user evaluation task and Christian Marques in
the initial prototype implementation.
REFERENCES
Agrawala, M., Zorin, D., Munzner, T., 2000. Artistic
multiprojection rendering. In Proceedings. of the
Eurographics Workshop on Rendering Techniques, pp.
125-136, London, UK. Springer-Verlag.
GRAPP2014-InternationalConferenceonComputerGraphicsTheoryandApplications
462

Bonbon, B. S., 1985. La Geometrie Spherique
Tridimensionnelle. Éditions Eyrolles, Paris.
Brooke, J., 1996. "SUS: a "quick and dirty" usability
scale". In P. W. Jordan, B. Thomas, B. A.
Weerdmeester, & A. L. McClelland. Usability
Evaluation in Industry. London: Taylor and Francis.
Brosz, J., Samavati, F. F., Carpendale, S. M. T., Sousa, M.
C. 2007. Single camera flexible projection. In
Proceedings of the 5th International Symposium on
Non-Photorealistic Animation and Rendering
(NPAR’07), pages 33–42. ACM.
Casas, F. R., 1983. Flat-Sphere Perspective, Leonardo,
Vol.16, No. 1 (Winter) pp. 1-9, The MIT Press.
Coleman, P., Singh, K. R., 2004. Rendering your
animation nonlinearly projected. In Proceedings of the
3rd international symposium on Non-photorealistic
animation and rendering, NPAR ’04, pp. 129–156,
New York, NY, USA, ACM.
Correia V., Romão, L., 2007. Extended perspective
System. In Proceedings of the 25th eCAADe
International Conference, pp. 185-192.
Flocon, A., Barre, A., 1968. La Perspective Curviligne,
Flammarion Éditeur, Paris.
Glassner, A. S., 2000. Cubism and cameras: Free-form
optics for computer graphics. Technical Report MSR-
TR-2000-05, Microsoft, California.
Gröller, E., 1995. Nonlinear ray tracing: Visualizing
strange worlds. Visual Computer, 11(5): pp. 263-274.
Hansen, R., 1973. This Curving World: Hyperbolic Linear
Perspective, The Journal of Aesthetics and Art
Criticism, Vol. 32, No. 2 (Winter) pp. 147-161, Wiley.
Lund, A. M., 2001. Measuring Usability with the USE
Questionnaire. STC Usability SIG Newsletter, 8:2.
Moose, M., 1986. Guidelines for Constructing a Fisheye
Perspective, Leonardo, Vol. 19, No. 1, pp. 61-64, The
MIT Press.
Rademacher, P., Bishop, G., 1998. Multiple-center-of-
projection images. In Proceedings of the 25th annual
conference on Computer graphics and interactive
techniques, SIGGRAPH ’98, pp. 199–206, New York,
NY, USA, ACM.
Singh, K., 2002. A fresh perspective. Graphics Interface
(GI'02), pp. 17-24, May (2002).
Trapp, M., Döllner, J., 2008. A generalization approach
for 3d viewing deformations of singlecenter
projections. In GRAPP International Conference on
Computer Graphics Theory and Applications, pp.
163-170, January.
Weiskopf, D., 2000. Four-dimensional non-linear ray
tracing as a visualization tool for gravitational physics.
In Proceedings of the conference on Visualization ’00,
VIS ’00, pp. 445–448, Los Alamitos, CA, USA, IEEE
Computer Society Press. (2000).
Wyvill, G., McNaughton, C., 1990. Optical Models. In
Proc. of the 8th international conference of the Comp.
Graphics Society on CG International: comp.
Graphics around the world, pp. 83-93. Springer
Verlag, November.
Yu, J., McMillan, L., 2004a. A framework for
multiperspective rendering. In Rendering Techniques,
pp. 61–68.
Yu, J. and McMillan, L., 2004b. General linear cameras.
In ECCV (2), pp. 14–27.
InteractiveVisualizerfortheExtendedPerspectiveSystemasSupportforArchitecturalDesign
463
