
A Computational Metric of the Quality of Circulation
in Interior Spaces
Arash Bahrehmand, Alun Evans and Josep Blat
GTI (Interactive Technology Group), Universitat Pompeu Fabra, Tanger 122-140, Barcelona, 08018, Spain
Keywords: Space Quality, Circulation, Visualization, Visibility, Computational Metric, Graph based Grid, Path
Finding.
Abstract: Space, in terms of interior and exterior design, is one of the most important issues facing all architects. In
particular the movement of people through sequences of spaces forms a large part of the circulation problem
in architecture planning. Although several studies have applied network models on urban analysis to take
advantage of graph based queries, understanding interior design principles based on graph attributes shows
potential for further research. This paper presents a computational solution to analyse, visualize, and
evaluate the circulation quality of indoor spaces. To achieve it, first we create a grid graph based on a
geometrical representation of space. Using this grid, a semantic weighted graph is generated, that helps us to
provide a measured score for the circulation of people in a given space. The results were tested against
architects’ scoring, showing that the measure is adequate. We also discuss the efficiency of our approach.
1 INTRODUCTION
Over the past few years, scientists have been
applying advances in fields such as Artificial
Intelligence or Computer Graphics to address
multifaceted problems through intelligent
applications. This is part of a growing digital
revolution that has been dramatically transforming
traditional disciplines. Architecture is among the
most prevalent fields, and has received considerable
attention from researchers, with the aim of
improving the design phase and visualizing
architects ideas. Recently, researchers are focusing
on a new trend of design methods that exploit
computational approaches to measure the quality of
design elements (e.g. windows, columns, beams)
from various points of view. However, there is still a
need to provide strong support for architects’
creativity through computerized methods, which
assess the space quality.
Space, in terms of interior and exterior design, is
one of the most important issues facing all
architects. In this context, it can be defined as a
collection of connected points satisfying particular
geometric constraints. Judging the quality of a space
means assessing to which extent the space
configuration satisfies the expectations of the
designer and the client. Spatial measurement
solutions help an architect to evaluate how near each
of his/her different plans are to the project
objectives. A wide range of methods can be used to
measure quality of space plans to obtain an
appropriate view of their consequential spatial
quality, before a final decision about the plan to be
implemented is made. For instance, accurate
statistical information could help to analyse how the
configuration of architectural elements influences
people's experience and behaviour. This is especially
the case for large projects, involving numerous
objectives, where an architect needs improved
analysis tools. This analysis entails a creative
consideration of all quality factors, where there is a
need to determine the programmatic principals in a
physical arrangement to satisfy the client’s demands.
Movement patterns of people can be influenced
by the perceptual thread that connects different
points of the built spaces. Circulation is a substantial
element in interior design, and architects’ early
designs include a relationship matrix that defines the
essence of the accessibility among rooms. To
support the transition from this matrix to a more
creative space planning, an analytic tool of
circulation that takes into account different
principles of design will be needed. The principal
contribution of this paper is a computational solution
to analyse, visualize, and evaluate the circulation
130
Bahrehmand A., Evans A. and Blat J..
A Computational Metric of the Quality of Circulation in Interior Spaces.
DOI: 10.5220/0004689201300137
In Proceedings of the 5th International Conference on Information Visualization Theory and Applications (IVAPP-2014), pages 130-137
ISBN: 978-989-758-005-5
Copyright
c
2014 SCITEPRESS (Science and Technology Publications, Lda.)

quality of indoor spaces, providing circulation scores
to 3D plans, in order to help architects to decide
among different designs. Our approach accepts a 3D
plan and a relationship matrix as inputs. Then an
algorithm extracts a grid graph at a fine level of
granularity that contains all the geometrical
properties of the plan. In the next step, a topological
graph is generated that reveals the cost of movement
among different spaces, and the traffic flow cost of a
3D plan is calculated. Finally, circulation quality is
measured based on similarity of the topological
graph and the relationship matrix, and the traffic
score of the given 3D plan.
The remainder of the paper is organized as
follows. Section 2 provides a review of some related
work that attempted to measure circulation quality in
architecture. Section 3 introduces our proposed
approach. Section 4 discusses the experimental
results for three different 3D plan. Finally, a
conclusion and discussion based on our finding from
this study are presented in section 5.
2 RELATED WORK
One of the earliest studies in the field uses a shared
concept between architecture and geography, isovist
(Benedikt, 1979),
which is defined as the part of
space visible from a given vantage point. The
vantage point is the position of the viewer so that the
quality is measured based on his/her point of view.
Thus, isovist is a smart way of understanding an
interior environment from the point of view of
individuals, as they interact with it
. This obtained
visible space is associated with different measures
such as area, distance, and occlusion. Kyeonah Yu
(Yu, 2006) takes the advantages of isovist in path
finding algorithms through a visibility graph.
(Wiener and Franz, 2005) try to find out a
relationship between spatial characteristics of
buildings and spatial experience and behaviour of
people.
Architecture is not a static experience but is
experienced dynamically through circulation in the
space (Puusepp, 2011). Church (Church and
Marston, 2003) introduced a comparative access
measurement that can be combined with traditional
measures of absolute access to assist architects in
making decision about finding optimized paths in
urban design. Paul C Merrell et al. presented an
intelligent approach for generating residential
building layouts automatically (Merrell et al., 2010).
Their method takes advantages of machine learning
and optimization techniques for producing plausible
building layouts. Although in the optimization
procedure the accessibility term, along with other
architectural terms, is applied for cost evaluation, it
only considers the number of missing connections
and entrances. Building Information Modelling
(BIM) is the process of producing and managing
data involving digital representations of physical and
functional characteristics of a building during its life
cycle. (Lee et al., 2008) present a BIM-enabled
graph application for analysing accessible routes
within indoor spaces. They use an accessible
distance measurement technique and provide a
visualization system highlighting spaces that are in
the path. In the field of interior spaces, much work
has been done to provide a spatial model for
measuring the navigations quality between different
space units. In addition, some studies concentrated
on location-aware navigation in the form of
navigation queries that help the users to find a point
of interest through evaluating some factors such as
travel time(Afyouni et al., 2012). According to
(Afyouni et al., 2012) two types of spatial models
are recognized: geometric and symbolic spatial
models.
2.1 Geometrical Representation
Geometric spatial models are based on geometrical
characteristics of the space. A widespread approach
in the field consists of splitting the plan into certain
number of non-overlapping parts. A well-known
grid-based approach uses a regular tessellation
method. Moravec et al (Moravec and Elfes, 1985)
present high-resolution spatial maps in a system that
navigates a mobile robot to a desired destination.
Although grid based approaches are appropriate
for navigation and easy to implement, they are
expensive in terms of memory and processing time
for large spaces. This well-known geometric
structure splits a space into regions close to a set of
particular points of interest (Choset, 1997).The main
drawback of Voronoi tessellations is that, in some
situations, the path may not be optimal (Afyouni et
al., 2012).
2.2 Symbolic-based Models
Symbolic-based approaches try to generate a graph
based on topological characteristics of a given space
(Dürr and Rothermel, 2003), where nodes are
semantic locations (e.g., rooms, doors) and edges are
connections that provide the possibility of
movement between locations (Choset and Burdick,
2000); (Remolina et al., 1999). Place based graphs
AComputationalMetricoftheQualityofCirculationinInteriorSpaces
131

are the general form of symbolic graphs where
nodes are rooms and edges are doors connecting
rooms. This modelling approach has been receiving
much attention in navigation planning and
answering nearest neighbour queries.
Figure 1: The input 3D plan.
In (Dik-Lun et al., 2004) a semantic model is
presented where the classic place-based approaches
are associated with some more knowledge such as
the distance between nodes. (Li et al., 2010) define a
grid graph-based model of an indoor plan. The space
is divided into some spatial units according to the
floor plan, and then these units are represented by a
grid graph where nodes and edges are labelled based
on their belonging to spatial units. Their modelling
approach can be applied in route, diffusion, and
topological analysis.
To sum up, the common limitations of the
presented methods naturally fall into one of three
categories: ignoring site-specific aspects;
overlooking the purpose of the building when
generating semantics behind the symbolic graph;
and finally the lack of a combined approach that
takes advantage of both grid and symbolic graph at
the same time.
3 PROPOSED APPROACH
This paper addresses how an architect can select the
best (plan) among different creative design
alternatives in terms of circulation functionality.
While there are several guidelines for configuring
architectural elements, the main motivation behind
all of them is to design architectural spaces to be
unobtrusive and efficient, so as to support all
possible accessibility requirements. The matrix
format is a commonly used method for organizing
information in the pre-design stage. The density and
complexity level of this matrix depends on the size
and project requirements (Karlen, 2011). As pointed
out above, architects often use a special type of
matrix, called relationship matrix, representing
relationships and adjacencies between spaces. The
relationship matrix consists solely of an
interpretation of accessibility information and does
not propose any planning solution. Therefore, in the
design process architects should comply with the
expectations set out in the relationship matrix.
Finding the best design solution in large projects,
with a dense matrix, is typically not interesting for
the analyser, and it is prone to error. In order to
have an accurate understanding of accessibilities in
an environment, our algorithm accepts both
relationship matrix as an input as well as 3D plan
that is annotated by the architect. This is a key
innovation of the method we propose. Figure 1
illustrates an annotated 3D floor plan. Annotations
help us to identify the functionality of each sub-
space in the building. We proposed a similarity
metric that measures the similarity of a symbolic
matrix of a given 3D plan to the relationship matrix.
In addition, several factors that are not addressed by
similarity measurement, e.g. traffic and overall
travel cost, are taken into consideration in measuring
the circulation quality of a 3D plan.
3.1 Creating the Grid Graph
As pointed out above, the grid-based model is a
well-known approach for representing navigable and
impassable regions in space by assigning different
labels to graph nodes. In order to create
automatically a fine grid-based graph based on the
geometrical attributes of 3D plan, we use a ray
casting method. The granularity of the graph
depends upon the partitioning complexity of the
plan. Graph nodes, called GNodes, represent
predefined places that have been extracted
automatically from geometrical structure in the 3D
plan. Each node has a label, for symbolic graph
extraction, and at maximum 8 neighbours for
navigation purposes.
First, a grid-based graph is created on top of the
3D building, according to the bounding projection of
the 3D plan. Then, from each GNode a ray is cast
down the 3D plan and, based on the collision of the
ray and the 3D element inside the plan, the label of
the corresponding node is determined. If the
collision is detected on the wall the label is set to
“impassable”, otherwise the label is assigned a value
according to the spatial unit detected by a ray
colliding with the building ground. As mentioned
above, annotations reveal the name of each spatial
unit in the 3D building, therefore these names are
applied for determining label values of grid graph
nodes. For instance, if a ray collides with kitchen
IVAPP2014-InternationalConferenceonInformationVisualizationTheoryandApplications
132

ground, the corresponding grid node gets the label
value of ‘kitchen’.
3.2 Generating the Symbolic Graph
In this step, we use a grid base graph to generate a
topological (symbolic) graph that presents the
possibility and cost of moving from one space to
another. Nodes, called SNodes, symbolize
predefined space landmarks extracted from Gnode
labels. Edges stand for the weighted connections that
make it possible to interact between space units
(Remolina et al., 1999; Werner et al., 2000;
Remolina and Kuipers, 2004). As pointed out above,
GNodes are labelled according to their belonging to
a corresponding subspace. In order to create SNodes,
first, the GNodes are grouped based on their label
values and then, according to each group, an SNode
with a label corresponding to the inherited group
label is created. The weight of each edge depends on
the length and complexity of shortest path between
two space units. Fig.3 illustrates a typical symbolic
graph for the plan in figure 1.
3.2.1 Shortest Path Distance
Shortest path is represented by an edge whose value
is the length of shortest path, in terms of number of
GNodes in the path, between the center of a space
unit corresponding to center of other space. In order
to find the shortest path an A* path finding on grid
graph is implemented in a way that walls are
considered as impassable objects. In order to
normalize the shortest path distance, we divided it
by the longest possible path distance in the floor.
The longest path is a path that passes through all
nodes in the grids without any duplication and
ignoring impassable walls. The shortest path is
calculated between two points that we calculate as
the center points of the two corresponding spaces.
Our definition of a center point is a point inside the
space that has the minimum variation between its
distances to all corner points of the space. The
algorithm below describes the distance is calculated.
In (1) the normalized value of shortest path is
calculated.
Max
ba
ba
SP
SP
NSP
,
,
(1)
Where
ba
SP
,
is the number of nodes in the path
between a, b.
3.2.2 Path Complexity
It is generally accepted that people tend to walk
along the easiest, simplest and most visible path
(Lee et al., 2008). Human navigation pattern relies
on mental planning processes which are
continuously updated based on individual current
perceptual configuration of the space. In doing so,
we measure the complexity level of a path based on
substantial factors: path visibility and direction
changing.
As pointed out above, isovist measures local
spatial configurations in terms of visibility from a
vantage observation point. Thus, each point in the
space has a particular isovist value based on its
position in the space. In Figure 4
an isovist map is
illustrated based on the isovist value grid points
where the brighter a point is, the more isovist value
it has. Of course, the more a pedestrian knows about
the configuration of the space though which his
walking through it, the better s/he can find his/her
way. Due to the isovist quantity, we can measure the
perception level of an individual at each point of the
path. Therefore, by summing up the isovist value of
all points in a path we can assess the quality of view
point along the path. In other words, the summation
value determines the simplicity level of way-finding
along a given path. In (2), NIsovist
i
is the normalized
value of Isovist of GNode
i
and MaxIsovist is the
maximum value of Isovist among all GNodes.
MaxIsovist
Isovist
NIsovist
i
i
(2)
Therefore in (3) SPIsovist
a,b
is the Isovist value of
the shortest path between GNode
a
and GNode
b
and
ba
SP
,
is the number of GNodes in the path.
ba
SPi
i
ba
SP
NIsovist
Iso
ba
,
,
,
(3)
One of the most substantial factors that affects both
simplicity and visibility is the number of direction-
changes through the path. In this sense, one prefers
to move in a path that is as straight as possible.
Hence, the more the direction of the path is changed,
the more complex the path is.
In order to recognize when the direction is
changed we use a distance measurement hypothesis.
A path consists of a series of connected nodes in a
way that each node, except the first on, is connected
to his parent node. In order to normalize the number
of direction changing we have divide it by maximum
possible number of direction changing in a path. In
AComputationalMetricoftheQualityofCirculationinInteriorSpaces
133
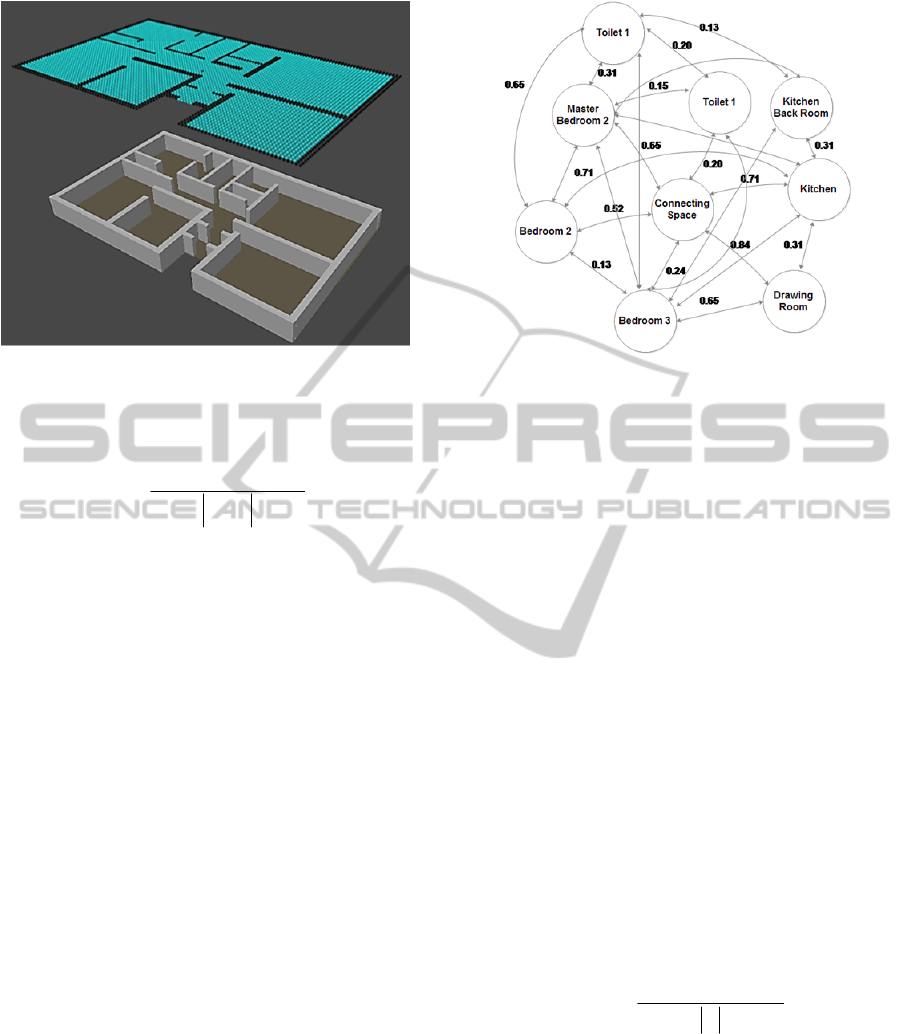
Figure 2: The generated grid-based graph.
doing so, the maximum value happens when the
direction changes, approximately, in all GNodes.
ba
ba
ba
SP
NumOfDirCh
NDC
,
,
,
(4)
3.2.3 Edge Weight
The weight of the edge between Snodes a and b is
calculated through the combination of path
complexity and shortest path distance of the path
that connects space unit a to b. For example in a
educational building, with many students and
classes, finding a shortest path is substantial while in
a museum the path length is not substantial but it
should cover objectives of the expedition.
3
,
2
,
1
,,
)1(*)(*)1(
babababa
NDCIsoNSPWeight
(5)
Where
i
s adjust the weight between different
terms based on the site-specific circumstances. For
this paper,
i
was kept at a value of 1.0
3.3 Calculating Similarity
Our similarity metric measures the similarity
between two matrices: the relationship matrix and
symbolic matrix.
The former is the input matrix that determines the
accessibility type of space units, while the latter is
the matrix representation of symbolic graph. In fact,
symbolic matrix is an s by s matrix, where s is the
number of space units. If there is a single door
between space unit a to b, then the element S
a,b
is
Weight
a,b
, otherwise it is 0. The reason we used
weights instead of binary representation of the
matrix is because, even if two spaces are adjacent,
Figure 3: An example of symbolic graph of input plan.
the door position can still have a substantial
influence on the circulation pattern.
On the other hand, the input relationship matrix
(or adjacency matrix) represents three levels of
connectivity importance, Must, Should and Could,
for those space units that are connected through only
one door. For instance, the importance level of those
spaces that are connected by Must is much more
important than those that are connected by Should.
For the sake of using this matrix in similarity
computations, instead of qualitative terms we use
three equivalent quantitative values as 1, 0.5 and
0.25 for Must, Should and Could respectively. Table
1 and Table 2 Illustrate a sample convert from a
relation matrix
R
to
R
. Moreover, if a plan does
not satisfy even one of the Must conventions, the
plan should be ignored. In fact, the similarity
determines how much the proposed plan satisfies
relationship matrix’s conventions. The similarity of
relationship matrix R and symbolic matrix S is
calculated through (6). The more similarity, the
more successful the proposed plan is in
implementing relationship matrix demands.
R
jiSjiR
PathSim
Rji
SR
,
,
,*,
(6)
3.4 Traffic
In architecture, traffic is defined as the possible
number of people who are walking in a space at the
same time.
In architecture design, a connecting space is
understood as a particular space with disjoint
address spaces and a set of links connecting pairs of
IVAPP2014-InternationalConferenceonInformationVisualizationTheoryandApplications
134
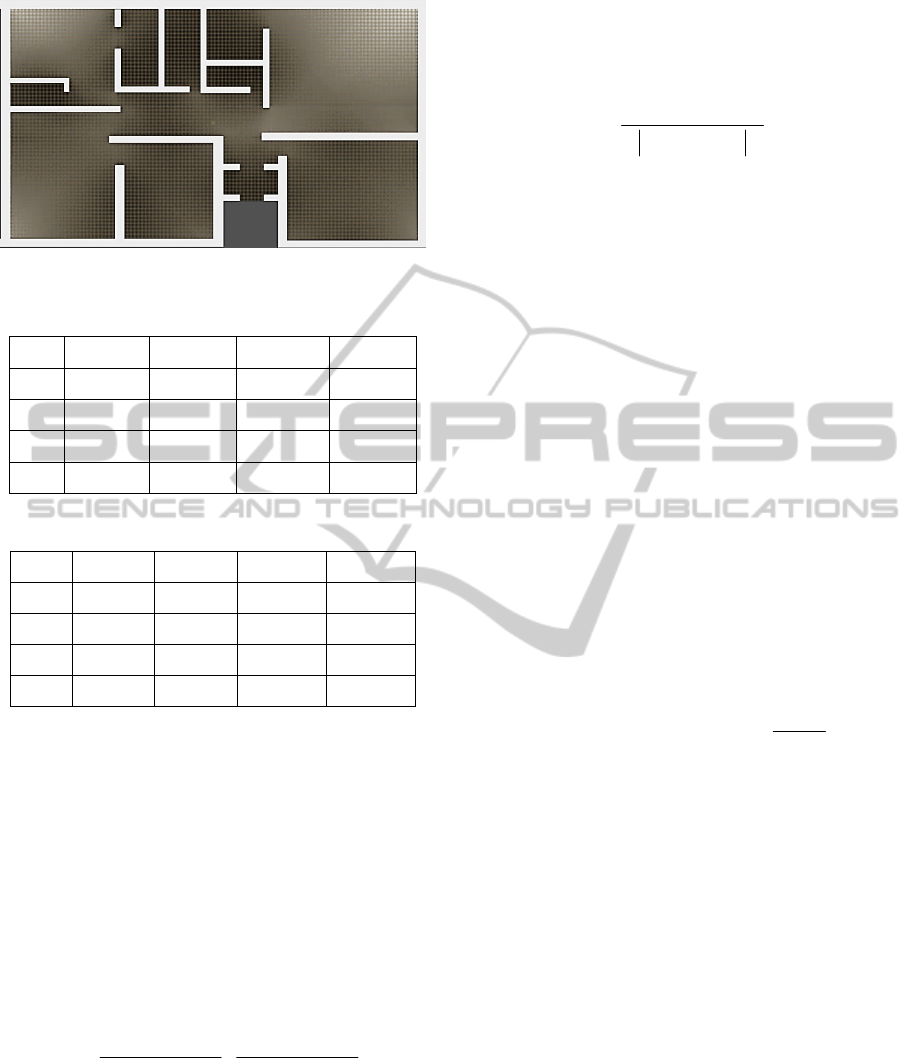
Figure 4: Isovist map of the floor plan.
Table 1: A simple relationship matrix.
R A B C D
A 0 Should Could Must
B Should 0 Should Could
C Could Should 0 Must
D Must Could Must 0
Table 2: Quantitative representation of Matrix R.
R’ A B C D
A 0 0.5 0.25 1
B 0.5 0 0.5 0.25
C 0.25 0.5 0 1
D 1 0.25 1 0
space units and sharing the same channel (Araújo et
al., 2009). One of the most significant aspects of
connecting space is the amount of possible traffic
that may occur within this space. Although,
increasing the size of connecting space can decrease
the traffic, leaving a large space only for connecting
space (Karlen, 2011). Therefore, architects try to
consider an appropriate size with lowest traffic for
connecting space. In order to measure the traffic,
first we should find the connecting space in the
symbolic graph. The connecting space is the space
that has most neighbours in the symbolic graph. In
(7) quality of traffic for floor plan p is computed.
SpaceConnectingSpaceConnecting
p
p
Area
NumofPath
Area
Area
Traffic
(7)
Where Area
ConncetingSpace
is the number of Grid nodes
in the connecting space.
3.5 Overall Path Efficiency
Overall path efficiency (OPE) calculates the
summation of all possible shortest path’s weights
between all space units. The more summation of
paths is the more efficiency can be realized for the
plan’s circulation.
2
,
,
SpaceUnits
Weight
OPE
SpaceUnitsba
ba
(8)
Where the SpaceUnits is the set of all space units in
a 3D plan.
3.6 Circulation Quality
Finally, circulation quality is calculated through
weighted combination of explicit and implicit
factors. The relationship matrix is determined
explicitly by architect while path complexity and
overall path efficiency are inferred implicitly from
the 3D plan. In (9) the circulation quality of plan P
is measured and two parameters,
and
, are
defined to adjust the weight of different factors
where based on the plan application. These values
are defined empirically and determine the
significance of each factor in measuring the quality
of circulation according to building´s practices and
conditions. For instance, in hospital the significance
of shortest path is much higher than other
parameters, therefore the value
of should be
increased.
)
)1(
*(*)1(*
,
P
PSRP
Traffic
OPEPathSimCQ
(9)
4 EVALUATION
The evaluation method is defined as comparing the
preferences of real architects with our generated
results. The comparison process consists of
presenting several different floor plans to architects
and asking them to sort these design solutions based
on circulation quality, then by comparing their
results, we can find out how accurate our program is
in satisfying architectural expectations. For this
paper, a preliminary study with 6 architects was
conducted. The participants were from Spain, the
Netherlands, and Iran. Despite the fact that our
proposed approach is more applicable in complex
buildings such as hospitals and schools, to simplify
the process of estimation for architects, home floor
plans (instead of complex buildings’ plan) were used
in this evaluation. Four floor plans, along with a
relationship matrix, were presented to architects.
AComputationalMetricoftheQualityofCirculationinInteriorSpaces
135

Each of these floor plans is a design alternative that
covers the expectations of relationship matrix to
some extent. Each participant was asked to sort the
input floor plans by considering the relationship
matrix and other factors that he/she believes have
influence on circulation. Participants were free to
devote as much time as they need for sorting plans.
First, we sorted alternative floor plans through
our proposed approach in which the output is a
sorted list and
5.0,
. Then we asked
participants to sort floor plans and create a sorted list
for presenting the order. Table 3 shows the results
where values determine the rank of the
corresponding floor plan. In order to measure the
overall efficiency of our algorithm we compare the
order of participants’ lists with our list’s order. The
comparison is performed through a similarity metric
that measures how closes our list is to a list that
generated by a participant.
,
(,) (,)
(,)
i
uv
rank u i rank v i
SimDiff
MaxDifference u v
(10)
Where rank(u,i) implies the priority of plan i in list
u. In addition, MaxDifference(u,v) calculate the
maximum possible dis-similarity between two lists u
and v.
,
2 1
(11)
Where n is the number of plans in list u that in our
case is 4, thus
=8.
Table 3: Evaluation results of our approach and
participants.
OA P1 P2 P3 P4 P5 P6
Plan01 2 3 2 2 3 3 3
Plan02 3 2 3 3 4 1 2
Plan03 1 1 1 4 2 2 1
Plan04 4 4 4 1 1 4 4
Table 3 shows the SimDiff for all participants. The
result of our experiment is illustrated in Table 4.
Finally, the average of SimDiff scores demonstrates
that our approach judge the circulation quality of a
plan 62 percent similar to an architect´s mind. Also,
we measured the similarity between architects using
the same equation. The result of this calculation was
38.3%). This lack of similarity between architects,
and the higher equivalent value of our technique,
suggests that our technique provides an independent
method of assessing space quality that is less subject
to individual bias.
Each architect spent more than 30 minutes for
sorting floor plans while computation time of our
algorithm is only a few minutes. We believe that in
multifaceted building projects our proposed
algorithm not only accelerates the decision-making
process, but also assists architects to prevent errors
and undesirable planning results.
5 CONCLUSIONS
Circulation is perhaps the most significant
component in defining and expressing spatial form
and function. Through a circulation path, a semantic
relationship between spatial units is created which
not only defines the quality of accessibility, but also
influences other spatial quality metrics such as
privacy. In this paper, we attempt to measure the
circulation quality in interior spaces. The study is
founded on asking ourselves how an architect can
select the best solution among different creative
design alternatives in terms of circulation
functionality. Our proposed metric does not take into
consideration changes in floor level when measuring
the weight between space units. As a further line of
research, it would be extremely interesting to
measure the influence of floor height on path weight
for those buildings containing stairs and ramps.
Another promising direction is measuring the quality
of circulation based in some particular situations
such as hospitals and schools. In addition, we can
develop this domain for analysing the quality of
space according to other metrics such as privacy and
illumination.
Table 4: The overall difference of our proposed approach
based on SimDiff.
P1 P2 P3 P4 P5 P6 Avg
SimDiff
0.25 0 0.25 0.75 0.5 0.25 0.33
ACKNOWLEDGEMENTS
This research was partially funded by the IMPART
FP7 project http://impart.upf.edu/
REFERENCES
Afyouni, I., Ray, C. & Claramunt, C., 2012. Spatial
models for context-aware indoor navigation systems:
A survey. Journal of Spatial Information Science, (4).
Araújo, G. A., Carvalho Jr, F. H. & Corrêa, R. C., 2009.
IVAPP2014-InternationalConferenceonInformationVisualizationTheoryandApplications
136

Implementing Endogenous and Exogenous Connectors
with the Common Component Architecture. In
Proceedings of the 2009 Workshop on Component-
Based High Performance Computing. New York, NY,
USA: ACM, pp. 12:1–12:4.
Benedikt, M., 1979. To take hold of space: isovists and
isovist fields. Environment and Planning B.
Choset, H, 1997. Incremental construction of the
generalized voronoi diagram, the generalized voronoi
graph, and the hierarchical generalized voronoi graph.
In Proc. First CGC Workshop on Computational
Geometry.].
Choset, Howie & Burdick, J., 2000. Sensor Based
Exploration: The Hierarchical Generalized Voronoi
Graph.
Church, R. L. & Marston, J. R., 2003. Measuring
Accessibility for People with a Disability.
Geographical Analysis, 35(1), pp.83–96.
Dik-Lun, H. H., Hu, H. & Lee, D., 2004. Semantic
Location Modeling for Location Navigation in Mobile
Environment. In In Proc. Of the IEEE International
Conference on Mobile Data Management (MDM. pp.
52–61.
Dürr, F. & Rothermel, K., 2003. On a Location Model for
Fine-Grained Geocast. In A. Dey, A. Schmidt, & J.
McCarthy, eds. UbiComp 2003: Ubiquitous
Computing SE - 2. Springer Berlin Heidelberg, pp.
18–35.
Karlen, M., 2011. Space Planning Basics, Wiley.
Lee, JK et al., 2008. Accessible Distance Measurement
Using GT Metric Graph. In CIB W084,Georgia
Institute of Technology. pp. 15–16.
Li, X., Claramunt, C. & Ray, C., 2010. A grid graph-based
model for the analysis of 2D indoor spaces.
Computers, Environment and Urban Systems, 34(6),
pp.532–540.
Merrell, P., Schkufza, E. & Koltun, V., 2010. Computer-
generated residential building layouts. In ACM
SIGGRAPH Asia 2010 papers. New York, NY, USA:
ACM, pp. 181:1–181:12.
Moravec, H. P. & Elfes, A., 1985. High resolution maps
from wide angle sonar. Robotics and Automation.
Proceedings. 1985 IEEE International Conference on,
2, pp.116–121.
Puusepp, R., 2011. Generating circulation diagrams for
architecture and urban design using multi-agent
systems.
Remolina, E. et al., 1999. Formalizing Regions in the
Spatial Semantic Hierarchy: an AH-Graphs
implementation approach. In C. Freksa & D. Mark,
eds. Spatial Information Theory. Cognitive and
Computational Foundations of Geographic
Information Science SE - 8. Springer Berlin
Heidelberg, pp. 109–124.
Remolina, E. & Kuipers, B., 2004. Towards a general
theory of topological maps. Artif. Intell., 152(1),
pp.47–104.
Werner, S., Krieg-Brückner, B. & Herrmann, T., 2000.
Modelling Navigational Knowledge by Route Graphs.
In Spatial Cognition II, Integrating Abstract Theories,
Empirical Studies, Formal Methods, and Practical
Applications. London, UK, UK: Springer-Verlag, pp.
295–316.
Wiener, J. & Franz, G., 2005. Isovists as a Means to
Predict Spatial Experience and Behavior. In C. Freksa
et al., eds. Spatial Cognition IV. Reasoning, Action,
Interaction SE - 3. Springer Berlin Heidelberg, pp.
42–57.
Yu, K., 2006. Finding a Natural-Looking Path by Using
Generalized Visibility Graphs. In Q. Yang & G.
Webb, eds. PRICAI 2006: Trends in Artificial
Intelligence SE - 20. Springer Berlin Heidelberg, pp.
170–179.
AComputationalMetricoftheQualityofCirculationinInteriorSpaces
137
