
Group Tracking and Behavior Recognition in Long Video Surveillance
Sequences
Carolina G
´
arate, Sofia Zaidenberg, Julien Badie and Francois Br
´
emond
STARS Team, INRIA, 2004 Route des Lucioles, BP93, 06902, Sophia Antipolis Cedex, France
Keywords:
Computer Vision, Group Tracking, Behavior Recognition, Video Surveillance.
Abstract:
This paper makes use of recent advances in group tracking and behavior recognition to process large amounts
of video surveillance data from an underground railway station and perform a statistical analysis. The most
important advantages of our approach are the robustness to process long videos and the capacity to recognize
several and different events at once. This analysis automatically brings forward data about the usage of the
station and the various behaviors of groups in different hours of the day. This data would be very hard to
obtain without an automatic group tracking and behavior recognition method. We present the results and
interpretation of one month of processed data from a video surveillance camera in the Torino subway.
1 INTRODUCTION
Group tracking and event recognition in surveillance
and security is an important research area. Dangerous
and criminal behaviors are mostly observed within
groups of people. This paper presents an approach for
group tracking and behavior recognition in a subway
station applied to long video surveillance sequences
(around 2 hours per video). As stated in (Guo et al.,
2010), in recent years, research on action recognition
focused on isolated action recognition for short videos
and (Guo et al., 2010) recently proposed an approach
for arbitrary lengths of videos. Our approach recog-
nizes events in long videos and handles multiple ac-
tions at once. The long videos used in (Guo et al.,
2010) are not more than 20 minutes long and their ap-
proach can recognize multiple actions, however one
action after another.
Our technique considers a chain process consist-
ing of 5 consecutive steps as shown in Figure 1 for
group tracking and behavior recognition. The steps
are: 1) segmentation, 2) blob detection, 3) physical
objects tracking, 4) group tracking and 5) event de-
tection, similarily to (Zaidenberg et al., 2012). Ho-
wever our approach combine the technique presented
in (Zaidenberg et al., 2012) with a global tracker al-
gorithm (Badie et al., 2012) to improve the results of
the group tracking. More specifically, after apply the
group tracking algorithm presented in (Zaidenberg
et al., 2012) we apply the global tracker algorithm
and finally the event recognition technique. In this
paper, we focus on the steps 4 and 5. For the previous
stages in the processing chain, we use a MoG-based
approach for step 1 (Nghiem et al., 2009), a connected
region approach for step 2, and an appearance match-
ing approach for step 3 (Chau et al., 2013).
Figure 1: Processing chain for videos.
(Chang et al., 2011) propose a group detection-
tracking technique based on paths producing a
weighted graph where the edges represent the pro-
bability of individuals belonging to a group. On the
other hand, they use a probabilistic motion analy-
sis technique for scenario recognition which uses the
spatio-temporal pattern. However, the events recog-
nized in (Chang et al., 2011) are very general, e.g.
group formation, group dispersion, etc. Our work
models more complex scenarios: we consider, among
others, queues at turnstiles, groups blocking a pas-
sage, etc. Ryoo and Aggarwal’s (Ryoo and Aggarwal,
2010) technique detects group formation and group
activities using a stochastic grammar. Grouping is de-
termined using spatio-temporal relations.
(McKenna et al., 2000) propose a robust approach
which tracks people as they form groups using an
adaptive background subtraction technique and using
color information to handle occlusions. Nevertheless,
they do not consider the group as a new entity because
396
Gárate C., Zaidenberg S., Badie J. and Brémond F..
Group Tracking and Behavior Recognition in Long Video Surveillance Sequences.
DOI: 10.5220/0004682503960402
In Proceedings of the 9th International Conference on Computer Vision Theory and Applications (VISAPP-2014), pages 396-402
ISBN: 978-989-758-004-8
Copyright
c
2014 SCITEPRESS (Science and Technology Publications, Lda.)

their technique tracks individuals before and after the
group formation. (Zaidenberg et al., 2011) proposed
a group tracking approach which first uses a people
detector followed by a frame-to-frame tracker (F2F).
The output of the F2F tracker is a set of trajectories of
the people which is used together with additional fea-
tures to create groups and then to track them. Howe-
ver, the human detector technique requires the videos
to be corrected/calibrated before proceeding to the ex-
periment. On the other hand, our technique does not
need any pre-processing of the video.
Vishwakarma and Agrawal in (Vishwakarma and
Agrawal, 2012) classify and list the existent event
recognition techniques. The classification begins with
2 main categories: non-hierarchical and hierarchi-
cal. The non-hierarchical category is divided into
two classes: space-time and sequential. Then the
space-time category is divided into 3 classes: vol-
ume, trajectories and features. For the sequential
classification there are 2 subcategories: exemplar and
state-based. On the hierarchical branch there are 3
subcategories: statistical, syntactic and description-
based. Our approach uses for behavior recognition
the framework ScReK (Scenario Recognition based
on Knowledge) (Zaidenberg et al., 2012), which is un-
der the description-based/hierarchical category. We
decided to use ScReK for the simplicity of scenario
modeling in different application domains.
2 GROUP TRACKING
The social definition of a group is people that know
each other or interact with each other. McPhail and
Wohlstein (McPhail and Wohlstein, 1982) propose
two criteria defining a group: proximity and/or con-
versation between two or more persons. It is difficult
to automatically detect in a video if the people know
each other or their type of interaction. This leads us
to use a derived definition on observable properties
as in (Zaidenberg et al., 2012) and (Zaidenberg et al.,
2011), hence a group is: two or more people who are
spatially and temporally close to each other and have
similar direction and speed of movement, or people
having similar trajectories.
The group tracking technique presented in this
paper is based on the one proposed in (Zaiden-
berg et al., 2012). The input of our algorithm is
a set of trajectories of the physical objects. The
approach characterizes a group through three fea-
tures: the average of the intra-object distance, the
average standard deviations of speed and direction.
These 3 features are used to define a coherence cri-
terion: groupIncoherence = ω
1
· distanceAvg + ω
2
·
speedStdDev + ω
3
· directionStdDev, where ω
1
,ω
2
and ω
3
are normalization parameters. We actually
need to minimize groupIncoherence value because
with a lower value, the group coherence is higher. In
the experimentation the values assigned to these pa-
rameters are: ω
1
= 7 and ω
2
= ω
3
= 5 (after using
cross validation), benefiting distance over speed and
direction similarity which are quite noisy. From this
definition, when a group has a low value of the coher-
ence criterion (the groupIncoherence), it means that
the probability of this entity being a real group is high.
Our group tracking algorithm consists of 4 phases:
creation, update, split/merge and termination. For a
robust detection of coherent groups, we use people
trajectories over a time window, called delay T . This
parameter is set to 20 frames for our experimentation.
This value was chosen as a trade-off between the need
for trajectories to be long enough but without adding
a big delay to the system.
To find similar trajectories, we use the Mean-Shift
clustering algorithm (Fukunaga and Hostetler, 1975)
because it does not require to set as input the num-
ber of clusters. However, Mean-Shift does require a
tolerance parameter determining the size of the neigh-
borhood for creating clusters.
A trajectory is defined as Tra j = {(x
i
, y
i
), i =
0. . . T −1} ∪{(s
x
i
, s
y
i
), i = 1 .. . T −1} where T is the
temporal window of analysis (or delay), (x
i
, y
i
), i ∈
[0;T − 1] in each trajectory is the position of a group
in the same frame i, and (s
x
i
, s
y
i
) = speed(i − 1, i), i ∈
[1;T − 1] is the speed of the group between frames
i − 1 and i. If k positions on the trajectory are miss-
ing because of lacking detections, we interpolate the
k missing positions between known ones. Each tra-
jectory is a point in a 2(2T − 1)-dimensional space.
Mean-Shift is applied on a set of such points.
We set the tolerance to 0.1, considering group-
ing trajectories distant by less than 10% of the max-
imum. This value is quite low because clustering is
used only to group very close people, the case where
people temporarily split being handled by the update
step described below.
The creation step consists in creating a group for
each cluster of two or more physical objects (not an-
notated as NOISE) and not yet being assigned to an ex-
isting group. In case of a single physical object la-
beled as GROUP_OF_PERSONS at frame t
c
− T , its trajec-
tory is analyzed through the time window , t
c
being
the current time. If this physical object maintains the
size of a group, or is close to other physical objects,
then the creation of a group is possible and the algo-
rithm computes its groupIncoherence. If the resulting
value is low enough, the group is kept.
The update step considers the relative evolu-
GroupTrackingandBehaviorRecognitioninLongVideoSurveillanceSequences
397

tion of a physical object and a group through the
time window (from frame t
c
− T to t
c
) using the
groupIncoherence defined above. It adds the physi-
cal object under consideration to the group and com-
putes the incoherence of the obtained group through
the time window. If the new physical object is really
part of the group, the groupIncoherence value stays
low and the physical object is definitely added to the
group.
The split step considers a physical object which
moved away for a large number of frames from its
group. Then, it is highly probable that this physical
object is not going to be included into the group dur-
ing the update step. Therefore, the physical object
splits from the group. If a new group is formed from
this object and other objects that have split from the
same group, then we consider that the old group has
split into the new and what remains of the old. The
merge step considers 2 groups g
1
and g
2
which can
be merged if 2 physical objects, one in each group at
frame t
c
−T +k (k ∈ [0; T −1]), are linked to the same
object in frame t
c
−T +l (l ∈ [k + 1;T − 1]). The old-
est group between g
1
and g
2
is kept and all the physi-
cal objects of the disappearing group are included into
the remaining group.
The termination step consists in deleting the old
groups. A physical object detected at a largely out-
dated frame (e.g. t
c
− 5T ) is erased at frame t
c
− T
and the empty groups are erased also. This implies
that the groups without new physical objects for 5T
frames are erased.
At the end of the group tracking phase, we obtain
an output, which is used as the input of the behav-
ior recognition stage. The output consists of a set of
tracked groups (maintaining a consistent id through
frames). Each group is associated with 7 features
(such as the intra-object distance, the speed or the ori-
entation, among others) and is composed of detected
physical objects at each frame.
2.1 Global Tracking
In some cases, the tracking algorithm may have diffi-
culties to keep track of a group. For example, it hap-
pens when a group leaves the scene and re-enters or
when an element of the scene occludes the group for
a significant time. In this case, the tracking algorithm
considers that the two groups are different and labels
them with a different ID. In order to solve this pro-
blem, we use a method called re-acquisition that tries
to connect the current IDs with the previously lost IDs
in a predefined time window, based on the appearance
of each group. This step can be considered as an ex-
tension of the tracking algorithm at a larger scale.
The first step of the re-acquisition method is to
extract relevant data from each group to compute a
visual signature. To compute this visual signature, a
descriptor based on covariance matrices is used (Bak
et al., 2011). This descriptor has shown very good re-
sults in the case of multi-camera re-indentication of
people. The second step is to arrange the groups into
several clusters depending on the distance between
their visual signature. The groups belonging to the
same cluster are then considered as the same group
because their visual signature is nearly identical.
The main advantage of the re-acquisition method
is to reduce the tracking errors due to occlusions
by merging the IDs of groups representing the same
group of people.
3 BEHAVIOR RECOGNITION
The behavior recognition stage used in the present
approach is the one proposed in (Zaidenberg et al.,
2012) named ScReK. (Zaidenberg et al., 2012) iden-
tify 2 phases in a behavior recognition process: the
application knowledge (what are the expected ob-
jects? what are the event models?) and the event
recognition algorithm. They consider that knowledge
should be modeled by vision experts (specialists in
vision algorithms) together with and application do-
main experts (specialists in the expected events of
their domain).
The knowledge is modeled through the ontol-
ogy shown in Figure 4 and the grammar proposed
in (Zaidenberg et al., 2012). The ontology is imple-
mented with the ScReK declarative language. The
grammar describes the objects and events using the
extended BNF (Backus Naur Form) representation.
The objects are defined using an inheritance mech-
anism: the object O
i
inherits all the attributes of its
parent O
j
. The attributes are defined based on 11 ba-
sic types: boolean, integer, double, timestamp, time
interval, 2D point (integer and double), 3D point (in-
teger and double), and list of 3D points.
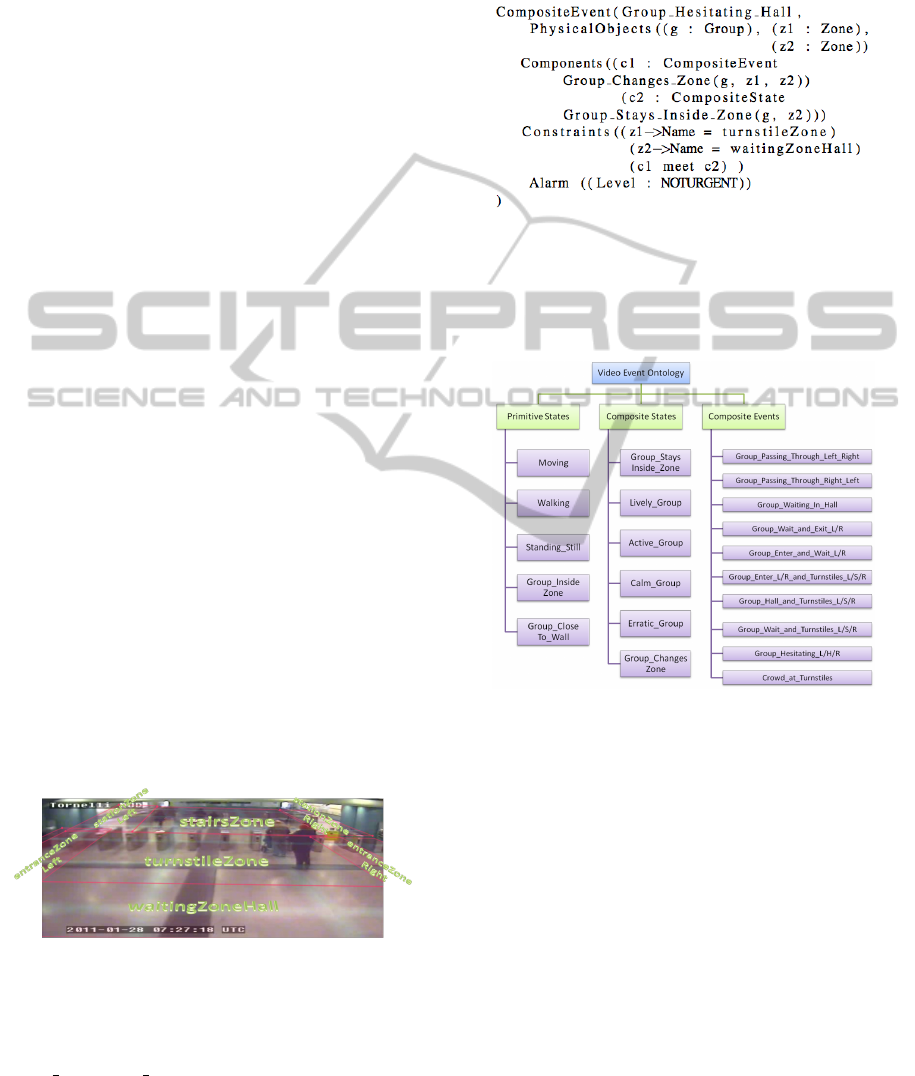
On the other hand, with ScReK we also represent
the knowledge of the event models. They consist of
6 parts: (1) Type of the scenario (4 values are possi-
ble: PrimitiveState, CompositeState, PrimitiveEvent,
CompositeEvent). (2) Name of the event model. (3)
List of physical objects involved in the event. (4) List
of sub-events composing the event model. (5) List
of constraints for the physical objects or the compo-
nents (6) Alarm level giving the importance of the
scenario model (3 values are possible: NOTURGENT,
URGENT, VERYURGENT). This is illustrated with the ex-
ample presented in Figure 3.
VISAPP2014-InternationalConferenceonComputerVisionTheoryandApplications
398
The behavior recognition algorithm deals with
spatio-temporal constraints on the detected groups.
The algorithm uses optimal event models due to the
restrictions of: maximum two components and one
temporal constraint (Allen’s algebra) between these
components. Using this optimization, the algorithm
generates an event model tree. The tree defines
which sub-event (component) triggers the recognition
of which event: the sub-event which happens last in
time triggers the recognition of the global event. For
instance, if the event A has two components B and
C with constraint: before C, then the recognition of
C triggers the recognition of A. The tree triggers the
recognition of the only events that can happen, de-
creasing the computation time.
4 EXPERIMENTS
The experiments of our research are oriented on
demonstrating the robustness of our approach and due
to the large amount of data that we have processed, it
was possible to generate statistics. In fact, we have
applied the process chain (see Figure 1) on the dataset
recorded in January 2011 for an European project in
the Torino subway, on the camera named Tornelli.
Recordings contain 1 month of data and were done
from 2010/12/30 to 2011/02/03, from 7 to 11am and
4 to 10pm. We have processed 241 video chunks of 2
hours, that is to say 482 hours of video. We focus on
analyzing the results obtained in the group tracking
and event recognition stages.
The behavior recognition process needs the model
of the group events that we want to recognize in the
scene Tornelli. Several of these events use the defi-
nition of predefined contextual zones in this scene, as
shown in Figure 2.
Figure 2: Contextual zones of the Tornelli view.
Based on the defined zones, we have mo-
deled scenarios, representing interesting trajecto-
ries of subway users. For instance, the scenario
Group
Hesitating Hall represents groups going first
to the turnstiles and then returning to the hall instead
of going through the turnstiles. It appears that most of
the time, when someone does not have a valid ticket
then needs to come back to use the vending machines
across the hall and after the group goes through the
turnstiles. This scenario is expressed as follows, in
Figure 3:
Figure 3: Example of the model event: Group Hesitating
Hall.
Considering the above, we obtain the ontology for
the Tornelli view. In Figure 4 we show an extract of
the ontology obtained.
Figure 4: Extract of the proposed group event ontology for
the Tornelli view.
Using our approach in the dataset mentioned
above, together with the ontology shown in Figure 2,
it was possible for us to recognize multiple behaviors
at once in each processed video.
4.1 Results and Interpretation
The number of accumulated groups over the record-
ing period per hour is shown in Figure 5: the first re-
sult of this study is to confirm that the peak hours are
indeed 7-8 am and 5-6 pm. It can also be noticed that
people tend to travel in groups rather in the afternoon
than in the morning. Indeed, people traveling in the
morning are mostly people going to work, when af-
ternoon travelers are more likely to be tourists or peo-
ple traveling for leisure. This tendency is confirmed
by the generally higher number of groups observed
GroupTrackingandBehaviorRecognitioninLongVideoSurveillanceSequences
399
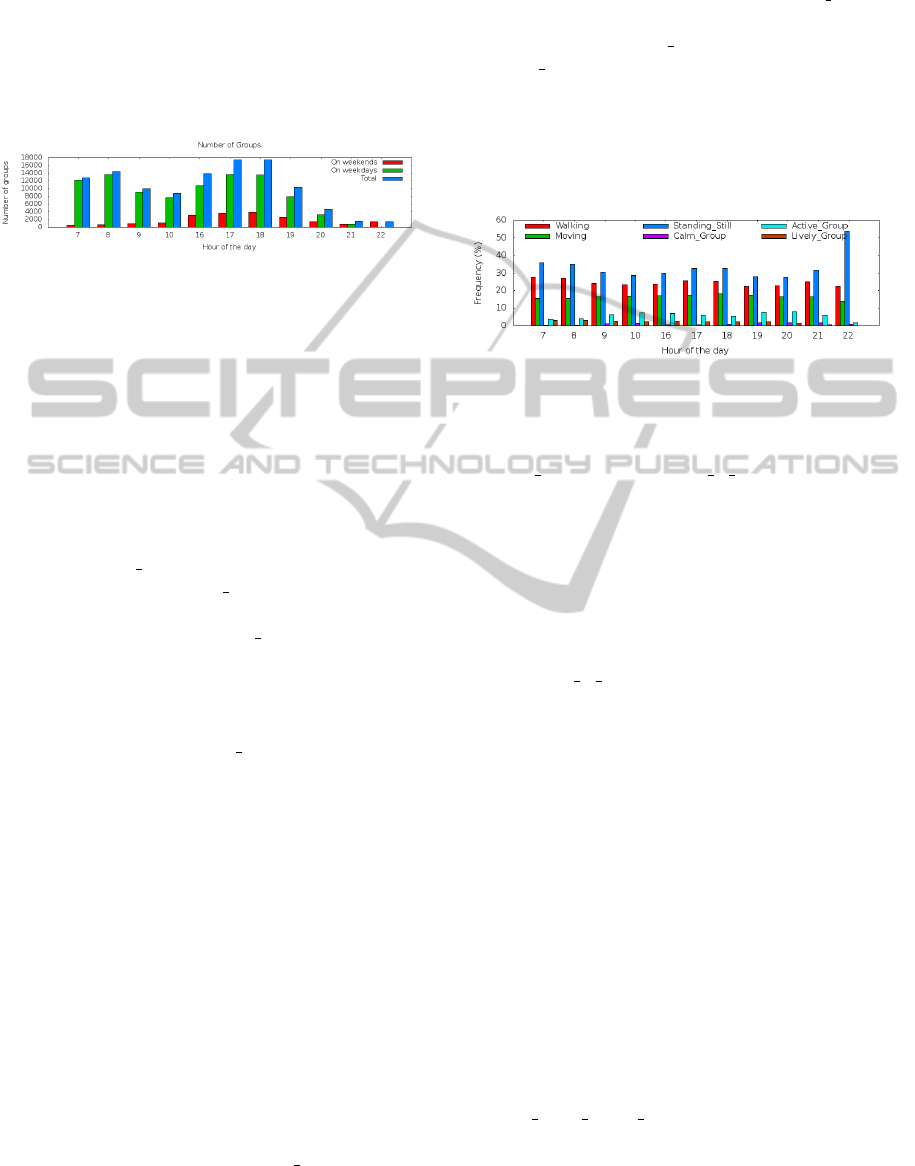
in the afternoon compared to the morning. Figure 5
also plots the difference in the number of groups on
weekends (Saturdays and Sundays) and on weekdays
(from Mondays to Fridays). The result, as expected,
confirms that the number of groups is lower on week-
end mornings and heigher on weekend evenings than
during the week.
Figure 5: Number of detected groups per hour of the day
and difference between weekends and weekdays.
We have measured which activities are the most
frequent depending on the hour of the day. In the
next graphs (Figures 6 to 12), the x axis represents the
hour of the day and the y axis, the percentage of oc-
currences of the given activity within all activities de-
tected in the given hour (listed in Figure 4). We count
as an occurrence the detection of a group performing
an activity (at a given hour). The same group can per-
form several activities at the same time or at different
times. For instance, a group can be detected as “Walk-
ing” and “Erratic Group” because “Walking” refers to
the speed, whereas “Erratic Group” refers to the tra-
jectory. Similarily, the same group can be “Walking”
at a point in time and “Standing Still” at another.
Figure 6 compares 3 categories of speed of move-
ment and 3 agitation levels of groups. This compar-
ison shows first that the speed of groups does not
depend much on the time of day. The most repre-
sented category is “Standing Still” where the speed
(s) is the lowest (s < threshold
1
). The next most
frequent category is “Walking” (which also includes
running since all speed above a threshold is included
in it: s > threshold
2
). Finally comes the mid-
dle category “Moving” corresponding to slow mo-
tion (threshold
1
6 s < threshold
2
). The values for
threshold
1
and threshold
2
are defined considering the
interval [minimum, maximum] for people speed in this
type of videos, the interval is divided in 3 equivalents
parts. This is the moment to remind that the same
group can perform several activities. When groups
go through the turnstiles, they almost always stop for
a few seconds. An individual going through the turn-
stiles has, most of the time, to significantly slow down
or stop for a short time. In a group, all the members
have to go through for the group to move on. Hence
the stopping time is increased in the case of a group.
The high frequency of the “Standing
Still” activity is
explained by the turnstiles visible in this view.
The agitation level is represented by the variation
of the size of the bounding box of a group. We con-
sider 3 categories from no agitation (“Calm Group”,
having a bounding box with very stable size) to
little agitation (“Active Group”) to high agitation
(“Lively Group”, the bounding box’s size varies a
lot, meaning that group members move around more).
Figure 6 shows that most of the time, this middle cat-
egory predominates. Groups are neither too calm,
nor too agitated. Moreover, it is more common for
a group to be lively rather than calm.
Figure 6: Comparison of speed of groups and variation of
group’s bounding boxes during the day.
Figure 7 presents the distribution of the activities
“Erratic Group” and “Crowd at Turnstiles” over the
hours of the day. Unlike the previous graph (Fig-
ure 6), this graphs’ y axis represents the percentage of
occurrences of each activity in the given hour in re-
lation to other hours (not other activities in the same
hour as it is the case previously). This Figure shows
that trajectories tend to be more erratic, that is to say
less straight, at peak hours. In fact, when more people
are present, it is harder to keep a straight trajectory.
The “Crowd at Turnstiles” scenario represents very
wide groups staying in the turnstile zone for longer
than 10 seconds. This occurs when the station is
crowded and the algorithm fails to detect the small
group structures and detects the whole crowd as one
group. Although this scenario approximately con-
firms the afternoon peak hours (5-6 pm), the morning
peak hours (7-8 am) are not well distinguished. Nev-
ertheless, the algorithm seems to be working as ex-
pected because in the evening there are definitely less
crowds. This leads to the conclusion that this partic-
ular scenario occurs even outside of peak hours and
is not representative of peak hours. Figure 8 presents
an example of a little crowd forming at the turnstiles
during peak hours. Indeed, as shows this example,
the width of a group is not enough to define a crowd
and to be more precise, we would need to estimate the
density of people inside this group.
Figure 9 shows the frequencies of the activity
“Group Stays Inside Zone” in various zones of the
scene (as shown Figure 2). This scenario is detected
when a group stays inside a zone for more than 10
seconds, not moving. One can notice that groups stay
the most in the turnstile zone, which is consistent with
VISAPP2014-InternationalConferenceonComputerVisionTheoryandApplications
400
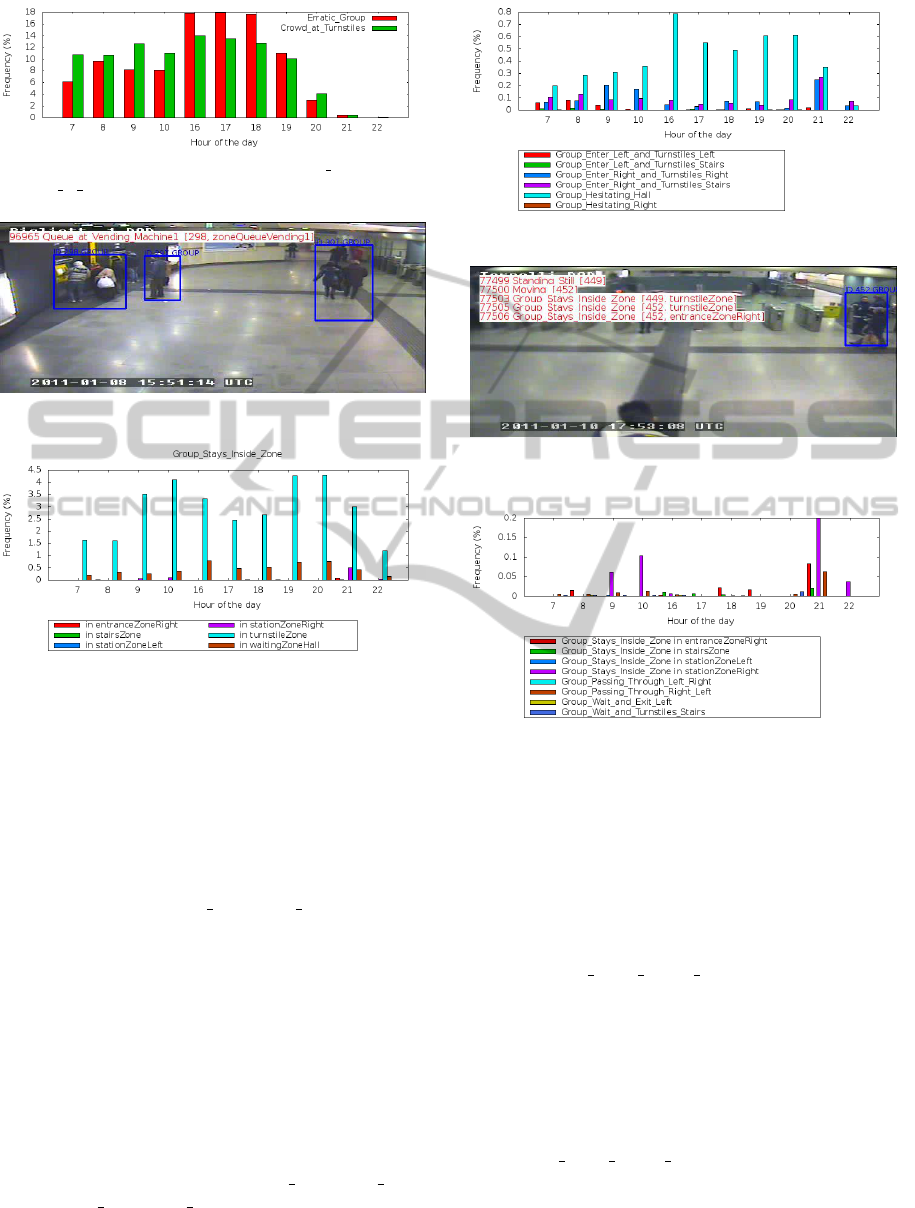
Figure 7: Distribution of the “Erratic Group” and
“Crowd at Turnstiles” activities over the hours of the day.
Figure 8: Example of queue at vending machine.
Figure 9: Comparison of stagnancy zones.
the conclusion of Figure 6 (groups have to stop at the
turnstiles). The other significant zone of stagnancy
is the waiting hall, where people meet, wait for each
other, wait for someone to buy tickets, or just stay
to chat. Once inside the station, people mostly go
straight to the trains.
Figure 10 compares several typical trajectories
that groups take in the station. The most frequent
activity is entitled “Group Hesitating Hall” and is de-
fined as a group first detected in the turnstile zone then
transitioned to the waiting hall zone. We call this hes-
itating because the group has not decided to enter the
station yet. In most cases, someone is needed to buy
a ticket. This activity occurs more frequently in the
afternoon than in the morning. This can be explained,
as already mentioned, by the fact that morning travel-
ers are mostly people going to work, hence they know
the way, have their ticket, and go straight to their
train without hesitating. Afternoon users are more
frequently unusual users, hence more prone to hesi-
tating. The similar activities “Group
Hesitating Left”
and “Group Hesitating Right” represent groups that
went from the turnstile zone to the left or right en-
trance zone. The first four scenarios in Figure 10 de-
Figure 10: Comparison of frequent behaviors.
Figure 11: Illustration of a stagnant group: in the right en-
trance zone a group of subway security staff is stagnant.
Figure 12: Comparison of rare behaviors.
scribe various typical trajectories: entering from the
left or the right, going through the turnstiles and to
the left or right side of the station.
We can observe that here again, activities on the
right side of the station are better represented than on
the left side. This is most likely due to the harder
detection in the left side of the image.
Figure 11 shows an example of occurrence of the
events “Group Stays Inside Zone in entranceZoneR-
ight”, where the stagnant group is actually a subway
security team.
Figure 12 first focuses on the other zones where
stagnancy was detected that do not appear clearly
on Figure 9. In figure 12, we can see that groups
sometimes stay on the right zone of the station, but
never on the left (in fact, there is only 1 occurrence
of “Group Stays Inside Zone in stationZoneLeft”).
Similarily, groups sometimes stay in the right en-
trance of the station, but never in the left. This phe-
nomenon can be explained by the quality of the im-
age. In fact, the camera lens is a little blurry on the
GroupTrackingandBehaviorRecognitioninLongVideoSurveillanceSequences
401

left side, which might explain low detection quality.
Nevertheless, Figure 12 shows that stagnancy in those
unusual zones mostly occurs outside of peak hours.
During peak hours, there are too many people for a
group to comfortably stagnate in one of those transit
zones.
Figure 12 also shows other trajectories taken
by groups but the occurrence rate of these tra-
jectories is lower than those in Figure 10. We
have detected a few groups passing through the
station without entering the turnstiles (17 occur-
rences of “Group Passing Through Left Right” and
1 of “Group Passing Through Right Left”), 2 occur-
rences of groups waiting in the hall and then leaving
the station. Finally, we have detected 8 occurrences of
groups waiting in the hall before entering the station
and taking the stairs. The rarity of these detections
might be explained by the difficulty to detect such
events, especially during peak hours.
5 CONCLUSIONS
We have presented an approach for group tracking
and behavior recognition. Our approach works in real
time and in long surveillance videos (1 month per
view). In the experiment section, we have shown that
our method is capable of recognizing multiple and
different events at the same time. This demonstrates
the robustness of our approach to processing videos
regardless of their length. Thanks to the simplicity of
using the event recognition language (ScReK), it was
possible to model complex scenarios for the Tornelli
scene as shown in Figure 8.
On the other hand, the amount of videos processed
allows us to analyze the results, obtaining the different
comparisons presented in the graphs of the previous
section.
We consider for future work the addition of prob-
abilities to the event recognition phase, which could
help to predict dangerous and criminal events. The
results obtained here show us a big challenge for pre-
diction of such events because there are not many ex-
amples with this kind of behaviors.
ACKNOWLEDGEMENTS
The research leading to these results has received
funding from the European Communitys Seventh
Framework Programme FP7/2007-2013 - Challenge
2- Cognitive Systems, Interaction, Robotics - under
grant agreement n 248907-VANAHEIM.
REFERENCES
Badie, J., Bak, S., Serban, S., and Bremond, F. (2012).
Recovering people tracking errors using enhanced
covariance-based signatures. In International Work-
shop on Performance Evaluation of Tracking and
Surveillance (PETS).
Bak, S., Corvee, E., Bremond, F., and Thonnat, M. (2011).
Multiple shot human re-identification by mean rie-
mannian covariance grid. In International Confer-
ence on Advanced Video and Signal Based Surveil-
lance (AVSS).
Chang, M., Krahnstoever, N., and Ge, W. (2011). Prob-
abilistic group-level motion analysis and scenario
recognition. In International Conference on Computer
Vision (ICCV).
Chau, D., Thonnat, M., and Bremond, F. (2013). Automatic
parameter adaptation for multi-object tracking. In In-
ternational Conference on Computer Vision Systems
(ICVS).
Fukunaga, K. and Hostetler, L. (1975). The estimation of
the gradient of a density function, with applications in
pattern recognition. In IEEE trans. Information The-
ory.
Guo, P., Miao, Z., Shen, Y., and Cheng, H. (2010). Real
time human action recognition in a long video se-
quence. In International Conference on Advanced
Video and Signal-Based Surveillance (AVSS).
McKenna, S. J., Jabri, S., Duric, Z., Rosenfeld, A., and
Wechsler, H. (2000). Tracking groups of people. In
Computer Vision and Image Understanding.
McPhail, C. and Wohlstein, R. T. (1982). Using film to
analyze pedestrian behavior. In Sociological Methods
& Research.
Nghiem, A., Bremond, F., and Thonnat, M. (2009). Con-
trolling background subtraction algorithms for robust
object detection. In International Conference on
Imaging for Crime Detection and Prevention (ICDP).
Ryoo, M. and Aggarwal, J. (2010). Stochastic representa-
tion and recognition of high-level group activities. In
International Journal of Computer Vision (IJCV).
Vishwakarma, S. and Agrawal, A. (2012). A survey on ac-
tivity recognition and behavior understanding in video
surveillance. In The Visual Computer.
Zaidenberg, S., Boulay, B., and Breemond, F. (2012). A
generic framework for video understanding applied to
group behavior recognition. In International Confer-
ence on Advanced Video and Signal-Based Surveil-
lance (AVSS).
Zaidenberg, S., Boulay, B., Garate, C., Chau, D., Corvee,
E., and Bremond, F. (2011). Group interaction and
group tracking for video-surveillance in underground
railway stations. In International Workshop on Be-
haviour Analysis and Video Understanding (ICVS).
VISAPP2014-InternationalConferenceonComputerVisionTheoryandApplications
402
