
Environment Adaptive Pedestrian Detection using In-vehicle Camera
and GPS
Daichi Suzuo
1
, Daisuke Deguchi
2
, Ichiro Ide
1
, Hiroshi Murase
1
, Hiroyuki Ishida
3
and Yoshiko Kojima
3
1
Graduate School of Information Science, Nagoya University, Furo-cho, Chikusa-ku, Nagoya-shi, Aichi, Japan
2
Information and Communications Headquarters, Nagoya University, Furo-cho, Chikusa-ku, Nagoya-shi, Aichi, Japan
3
Toyota Central Research and Development Laboratories, Inc., 41–1 Yokomichi, Nagakute-shi, Aichi, Japan
Keywords:
Pedestrian Detection, ITS, Semi-supervised Learning.
Abstract:
In recent years, accurate pedestrian detection from in-vehicle camera images is focused to develop a safety
driving assistance system. Currently, successful methods are based on statistical learning. However, in such
methods, it is necessary to prepare a large amount of training images. Thus, the decrease in the number of
training images degrades the detection accuracy. That is, in driving environments with few or no training
images, it is difficult to detect pedestrians accurately. Therefore, we propose an approach that collects training
images automatically to build classifiers for various driving environments. This is expected to realize highly
accurate pedestrian detection by using an appropriate classifier corresponding to the current location. The
proposed method consists of three steps; Classification of driving scenes, collection of non-pedestrian images
and training of classifiers for each scene class, and associating a scene-class-specific classifier with GPS loca-
tion information. Through experiments, we confirmed the effectiveness of the method compared to baseline
methods.
1 INTRODUCTION
In recent years, traffic accidents involving pedestri-
ans are becoming a social problem. Therefore, assis-
tance technology for safety-driving is necessary, such
as warning of the existence of pedestrians. Addition-
ally, driverless vehicles are expected to be upcoming
in the near future, due to the recent evolution of au-
tomatic driving technology. Pedestrian detection is
one of the key function to develop these systems. To
tackle this problem, various methods have been pro-
posed using in-vehicle camera images.
For example, Dalal et al. developed a method for
pedestrian detection that combines the Histograms of
Oriented Gradients (HOG) feature and the Support
Vector Machine (SVM) classifier (Dalal and Triggs,
2005). In the case of such a statistical learning ap-
proach, a large number of training images is needed
for accurate detection. Thus, the decrease of the num-
ber of training images degrades the detection accu-
racy. In driving environments with few or no training
images, it is difficult to detect pedestrians accurately.
Some methods achieve highly accurate pedestrian
detection by restricting its application to a specific
Figure 1: Examples of various environments. It is difficult
to detect pedestrians accurately for all environments with a
general detector.
environment so as to make use of particular knowl-
edge (Broggi et al., 2009) (Vinicius et al., 2012), but
such an approach is not sufficient to detect pedestrians
from an in-vehicle camera, since driving environment
varies widely such as the examples shown in Figure 1.
To solve this problem, some research groups pro-
posed methods that collect training images of pedes-
trians automatically from videos. For stationary cam-
eras, there are methods based on background subtrac-
354
Suzuo D., Deguchi D., Ide I., Murase H., Ishida H. and Kojima Y..
Environment Adaptive Pedestrian Detection using In-vehicle Camera and GPS.
DOI: 10.5220/0004677003540361
In Proceedings of the 9th International Conference on Computer Vision Theory and Applications (VISAPP-2014), pages 354-361
ISBN: 978-989-758-004-8
Copyright
c
2014 SCITEPRESS (Science and Technology Publications, Lda.)
Driving Environment B
Classifier H
B
Driving Environment A
Classifier H
A
Driving Environment C
Classifier H
C
Environment-Classifier map
associated by GPS
Figure 2: The concept of the pedestrian detector adapted to the driving environment.
tion for collecting pedestrian images (Nair and Clark,
2004) (Wang and Wang, 2011). However, it is dif-
ficult to apply techniques used in these methods for
in-vehicle camera videos. W¨ohler et al. solved this
problem by employing tracking (W¨ohler, 2002).
The above methods construct a single classifier
to detect pedestrians from all environments. On the
other hand, some methods take a transfer learning ap-
proach to change the performance of the classifier for
each environment (Pang et al., 2011). However, to
apply these methods, it is required to prepare training
samples obtained from each environment manually.
Therefore, we take an approach that collects train-
ing images automatically to build classifiers for var-
ious driving environments. By choosing an optimal
classifier for the current environment, accurate detec-
tion is expected. We call this approach as “driving
environment adaptation.”
A driving environment affects the appearance of
pedestrians and their background, which decreases
the detection accuracy. Factors blamed for this effect
are:
• The location changes the background appearance.
• The time affects the illumination of the driving
scene.
• Weather conditions and seasons affect the appear-
ance of pedestrians and backgrounds.
Compared to the effect of time, weather condi-
tions and seasons, the effect of location is more sig-
nificant. It is difficult to prepare training images man-
ually considering the variation of all locations. For
this reason, adapting the pedestrian detector to loca-
tion should be effective. Figure 2 shows the concept
of the pedestrian detector adapted to the location.
When building a classifier, pedestrian and non-
pedestrian images are required. In addition, ap-
pearance of the non-pedestrian (background) image
changes significantly according to the location. On
the other hand, the variety of appearance of pedestri-
ans is not so large compared with the non-pedestrian
images. Hence, this paper focuses on the collection
of non-pedestrian images.
The proposed method is composed of the follow-
ing parts:
1. Classification of driving scenes
2. Collection of non-pedestrian images for each
scene class
3. Associating a scene-class-specific classifier with
GPS location information
The main contribution of this paper is the intro-
duction of the concept of an environment adaptive de-
tection mechanism for pedestrian detection from in-
vehicle camera images. This framework can be com-
bined with any conventional learning-based pedes-
trian detection methods.
In the following, section 2 explains the details of
the proposed method. Section 3 describes the experi-
ments. The results of the experiments are discussed in
section 4. Finally, we conclude this paper in section 5.
2 BUILDING A PEDESTRIAN
DETECTOR ADAPTED TO THE
DRIVING ENVIRONMENT
This section describes the details of the proposed
method.
EnvironmentAdaptivePedestrianDetectionusingIn-vehicleCameraandGPS
355
Location 6
place 2 place 5
Non-pedestrians
Pedestrians
...
...
Driving
environment
Past videos
for adaptation
Driving Environment A Driving Environment B
...
...
...
Classifier H
A
Driving environment Classifier
Locations
A H
A
1, 2, 3, 6, ...
B H
B
4, 5, ...
...
...
...
Classification of
driving scenes
Collection of
non-pedestrian images
Location-Classifier Table
Location 1
...
...
Training of classifiers
for each scene class
Assosiating a scene class
specific classifier with
GPS location information
Baseline
training images
Location 2 Location 3 Location 4 Location 5 Location 6
Location 1 Location 4
Classifier H
B
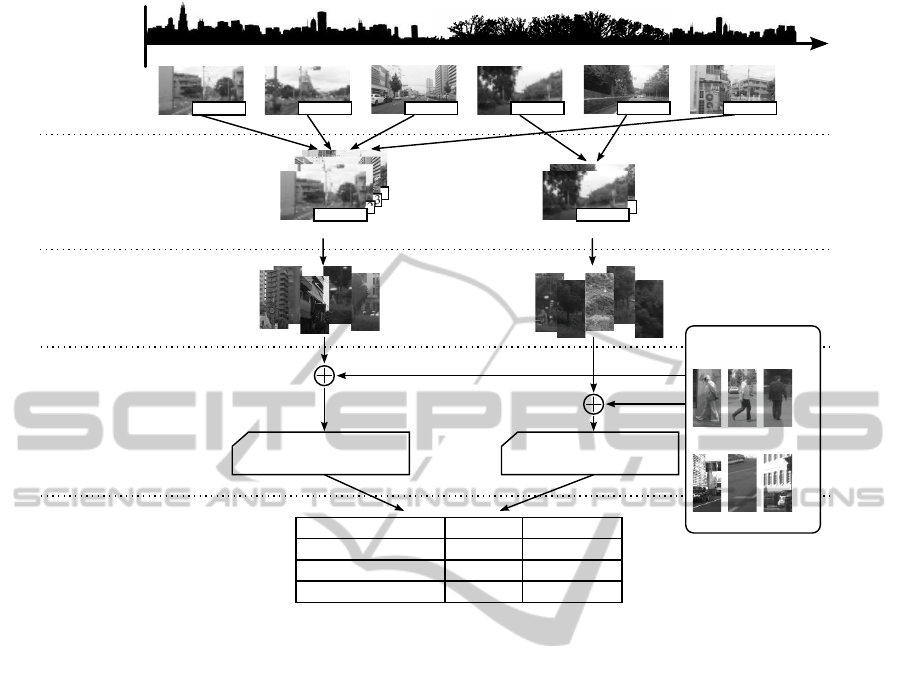
Figure 3: The proposed framework of adapting a pedestrian detector to driving environments using in-vehicle camera videos
captured multiple times along the same route.
2.1 Overview of the Proposed Method
The proposed method consists of two phases; the
adaptation phase and the detection phase.
The adaptation phase is the process that constructs
a pedestrian detector adapted to a location. Figure 3
shows the framework of the adaptation phase. First,
the proposed method classifies driving scenes based
on the appearance, and then automatically collects
non-pedestrian images from in-vehicle camera videos
corresponding to each scene class. Finally, the classi-
fier is adapted to the environment by using training
images obtained in each scene class. Since a geo-
graphic location can be obtained from GPS, the clas-
sifiers adapted to each driving scene class is associ-
ated with GPS location information. This relation is
represented as a “location-classifier table.”
The detection phase is the process that detects
pedestrians using a classifier adapted to the current
driving scene class. Such a classifier is obtained by
looking-up the location table referring to the current
location obtained by GPS.
Since we suppose that the appearance of the same
region should be similar regardless of the direction of
the car, the differences of orientations are not consid-
ered.
The following sections describe the details of each
process.
2.2 Adaptation Phase
2.2.1 Classification of Driving Scenes
The proposed method classifies driving scenes us-
ing in-vehicle camera videos captured multiple times
along the same route. In this process, Bags of Vi-
sual Words (BoVW) (Csurka et al., 2004) based on
the Speeded Up Robust Features (SURF) feature de-
scriptor (Bay et al., 2008) are extracted for each frame
as the driving scene feature descriptor. Then, driving
scenes are classified by k-means clustering using the
scene features. Here, the parameter k indicates the
number of driving scene classes.
In the following, we used 100 bins for the BoVW
codebook. That is, driving scene features are repre-
sented by a 100-dimensional vector.
VISAPP2014-InternationalConferenceonComputerVisionTheoryandApplications
356
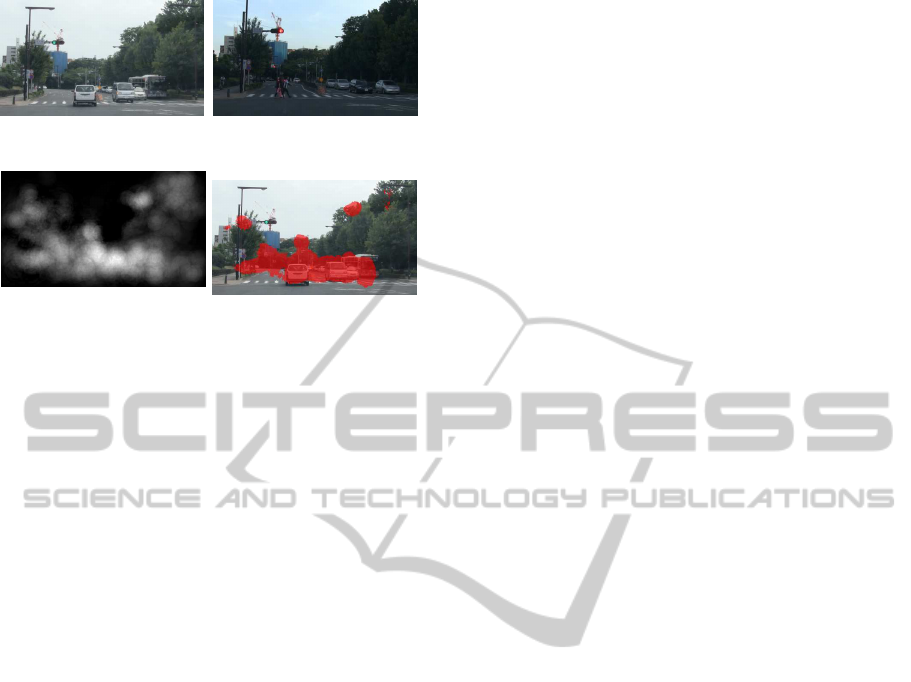
(a) An example of the pair of input images captured at the same location at a
different time.
(b) Anomalous (foreground)
likelihood map.
(c) Anomalous region detected by
thresholding the likelihood map.
Figure 4: The input images and the result of anomalous re-
gion detection.
2.2.2 Collection of Non-pedestrian Images and
Training of Classifiers for each Scene Class
After the classification of driving scenes, to obtain
classifiers adapted to a scene class, the proposed
method collects non-pedestrian images automatically
from corresponding in-vehicle camera videos. Train-
ing images are collected by clipping images randomly
that contain no pedestrian. To achieve this, the pro-
posed method detects anomalous regions from two
images taken at the same location at a different time,
based on the ideas of local feature correspondence-
based change detection (Sand and Teller, 2004) (Mit-
sumori et al., 2009).
First, the two images are aligned by calculat-
ing the homographic transformation based on lo-
cal feature correspondences. Then, local features
are extracted, and their correspondences between the
aligned images are calculated again. The existence
of corresponding keypoints between regions indi-
cates their similarity. Conversely, regions with miss-
correspondences or no correspondenceare considered
as anomalous. Through this process, an anomalous
(foreground) likelihood map is obtained. By thresh-
olding this likelihood map, anomalous regions are de-
tected.
Figure 4 shows the result of the anomalous region
detection. We can see that the method can extract
differences between the images caused by vehicles
and pedestrians robustly against illumination varia-
tions and small misalignments.
Collecting non-pedestrian images is the process
that clips images randomly from outside the anoma-
lous regions. Images clipped by this process are as-
sumed not to include any pedestrian. Through this
process, images for the negative samples, that are ex-
pected not to include pedestrians, are obtained. By
learning the collected images and manually prepared
images, a classifier adapted to a scene class is ob-
tained.
2.2.3 Associating a Scene Class Specific
Classifier with GPS Location Information
By referring to GPS location information associated
with each frame, the relationship between locations
and driving scene classes is obtained. This relation-
ship is represented by a table. In this table, the keys
to look up for a classifier associated with a scene class
are multiple GPS locations. This concept can be con-
sidered that each location is linked with an optimal
classifier, such as shown in the example illustrated in
Figure 2.
2.3 Detection Phase
In the detection phase, the proposed method selects
a classifier adapted to the current location associ-
ated with the input image, which should be the op-
timal. This is performed by referring to the location-
classifier table using GPS location information as a
key. Since classifiers are sparsely associated with the
table, the proposed method searches for a classifier
by the k-nearest neighbor scheme. Since the addi-
tional computation introduced in the detection phase
compared with a general pedestrian detection scheme
is just selecting a classifier, this method is practical
enough for real-time processing.
3 EXPERIMENTS
We conducted experiments to evaluate the effective-
ness of the proposed method. This section introduces
the dataset, the comparative methods, and the evalua-
tion method.
3.1 Dataset
We prepared a dataset composed of in-vehicle camera
videos with frame-wise GPS location information that
were captured multiple times along the same route.
This data consists of three sequences of in-vehicle
camera videos which have GPS location information
for each frame. They were captured along the same
route at a different day, time and weather conditions.
Each video had a resolution of 1,920×1,080 pixels
with 28 mm focal length, recorded in 24 fps progres-
sive mode.
EnvironmentAdaptivePedestrianDetectionusingIn-vehicleCameraandGPS
357
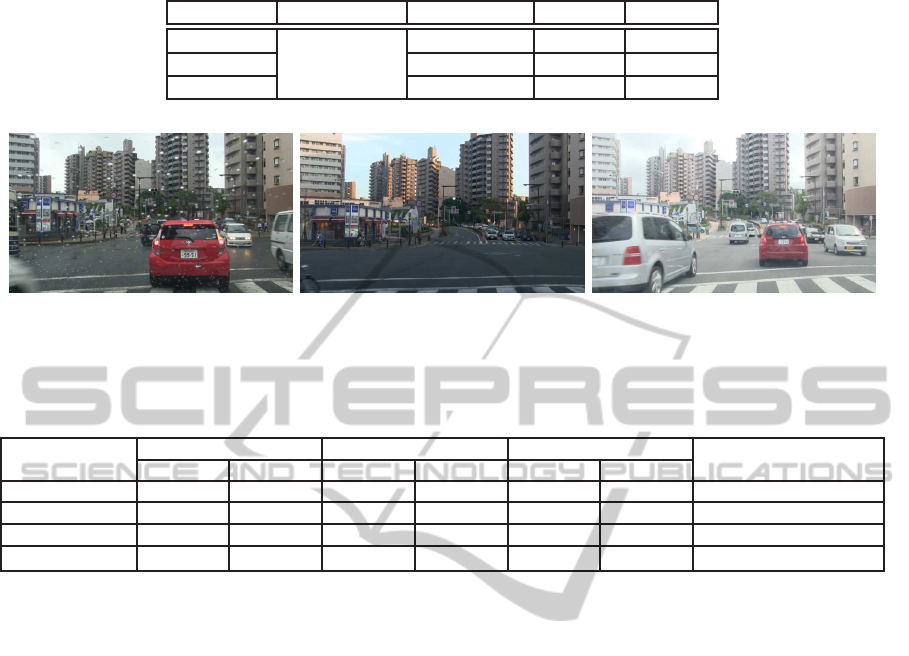
Table 1: Specification of the dataset.
Sequence Travel length Video length Weather Time
Evaluation
7 km
23 min. Cloudy Daytime
Training 1 35 min. Fine Sunset
Training 2 28 min. Rain Sunset
(a) An example of the
training sequence 1
(b) An example of the
training sequence 2
(c) An example of the
evaluation sequence
Figure 5: Examples of in-vehicle camera images used in the experiments. These images were taken in the same location under
different conditions.
Table 2: The outline of the methods (the number of training images).
Method
Manual preparation Automatic collection Total
Environment adaptive
Positives Negatives Positives Negatives Positives Negatives
Baseline 4,104 5,000 – – 4,104 5,000 –
Comparative 1 4,104 10,000 – – 4,104 10,000 –
Comparative 2 4,104 5,000 – 5,000 4,104 10,000 –
Proposed 4,104 5,000 – 5,000 4,104 10,000 X
The route contained main roads, residential areas,
and suburbs. Table 1 shows the specifications of each
video, and Figure 5 shows examples from each video.
We used two sequences for the training, and the re-
maining sequence for the evaluation.
Additionally, training images for building a pre-
adaptation classifier were prepared manually. These
were collected from images taken in an area different
from the experimental data.
3.2 Comparative Methods
Table 2 shows the outline of the methods. The pro-
posed method is the environment adaptive detection
that combines the driving scene classification and the
automatic training image collection. The baseline
method used the pre-adaptation detector built only
with manually prepared training images. Compara-
tive method 1 increased the number of training images
of the baseline method, without collecting training
images automatically and driving scene classification.
Comparative method 2 used the detector adapted to
the whole training video without driving scene classi-
fication, that is equivalent to the case of the proposed
method supposing if the number of scene classes were
1. The same number of training images was used in
the proposed method and the comparative methods.
3.3 Evaluation
In the pedestrian detection experiment, we focused on
pedestrians that had a height of 192 pixels or more in
the image, without large occlusion. The evaluation
sequence contained a total of 372 pedestrians.
To detect pedestrians from an input image, multi-
scale window search was conducted. Detection win-
dows were fully raster-scanned over the image, and
detection score was calculated by a classifier from
the feature of the clipped window. Detection win-
dows whose score was above the detection threshold
were regarded as pedestrians. Through this process
with changing the scale of input image, various sized
pedestrians could be detected. The detection result
was considered to be a true positive if the overlap of
the rectangles with the ground truth reached 30%. In
order to prevent false positives, it is effective to in-
troduce some hypotheses on the position of pedestri-
ans. However, since we attempted to validate only the
accuracy of the classifier, this experiment was con-
ducted without such schemes.
To build the classifier, any conventional learning-
based method can be used in the proposed method. In
this experiment, the HOG feature and the soft-margin
linear SVM implemented in LIBLINEAR (Fan et al.,
2008) were used.
VISAPP2014-InternationalConferenceonComputerVisionTheoryandApplications
358
0.1
0.2
0.3
0.4
0.5
0.6
0.7
10
−5
10
−4
10
−3
Miss rate
False Positives Per Window (FPPW)
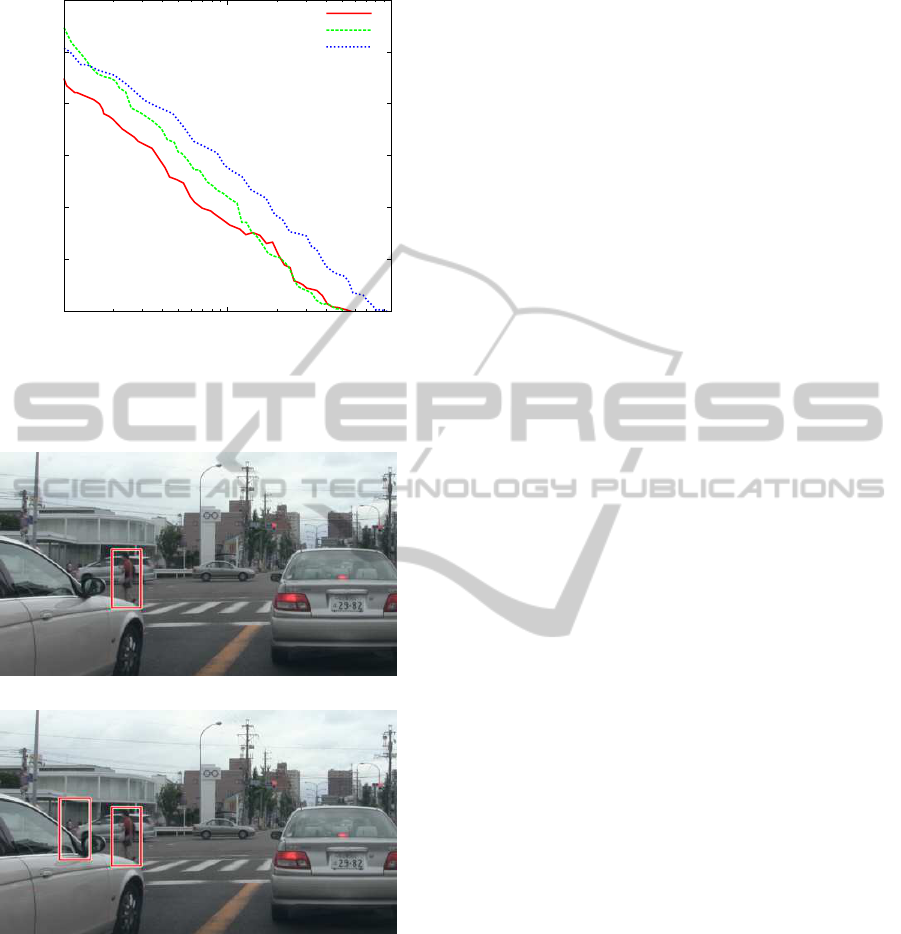
Figure 6: The result of the accuracy evaluation of envi-
ronment adaptive pedestrian detection (when the number of
driving scene classifier was k = 10).
(a) Location adapted detector.
(b) Baseline detector.
Figure 7: Example 1 of the detection result of the proposed
method and the baseline method.
Here, we plot the detection-error-tradeoff (DET)
curve by changing the detection threshold to eval-
uate the detection accuracy, whose horizontal axis
represents the number of false positives per window
(FPPW), and the vertical axis the miss rate (unde-
tected rate). So, a curve closer to the origin indicates
that it is more accurate. This graph is drawn by plot-
ting the evaluation results by changing the parameter
of the SVM classifier.
4 RESULTS AND DISCUSSIONS
This section shows the results of the experiment. In
the following, we first evaluate the general perfor-
mance, and next detailed analyses of how the pro-
posed method works.
4.1 Evaluation of the Accuracy of the
Pedestrian Detector adapted to
Driving Environment
Figure 6 shows the results of each method. We can
see that the environment adapted pedestrian detector
was the most accurate compared with all the other
methods. As seen in the comparative methods 1 and
2, collection of training images from actual video
was much effective than simply increasing the num-
ber of training images. Furthermore, the result of the
proposed method indicates that using location depen-
dent classifiers was more successful. Especially when
FPPW = 10
−4
, the miss rate of the proposed method
decreased 28% compared with the baseline. Also in
comparison with the comparative methods, the pro-
posed method was the most accurate in most cases.
As shown in Figs. 7 and 8, that are examples of
the detection result of the baseline method and the
proposed method, adaptation of pedestrian detectors
to the environment decreased the number of miss-
detection.
However, miss-detection was frequently observed
in vehicle regions such as those shown in Figure 9.
In the proposed method, the collected images will not
include any vehicle region that can be used as nega-
tive samples. Thus, when collecting non-pedestrian
images, it is desirable to collect such regions to pre-
vent such miss-detection. However, since the pro-
posed method is based on image difference, it is not
possible to extract only pedestrian regions precisely.
Solution to this problem will be considered in the fu-
ture.
4.2 Investigation of the Relation
between the Number of Driving
Scene Classes and the Detection
Accuracy
In the experiment, we had a fixed parameter that
represented the number of driving scene classes; k.
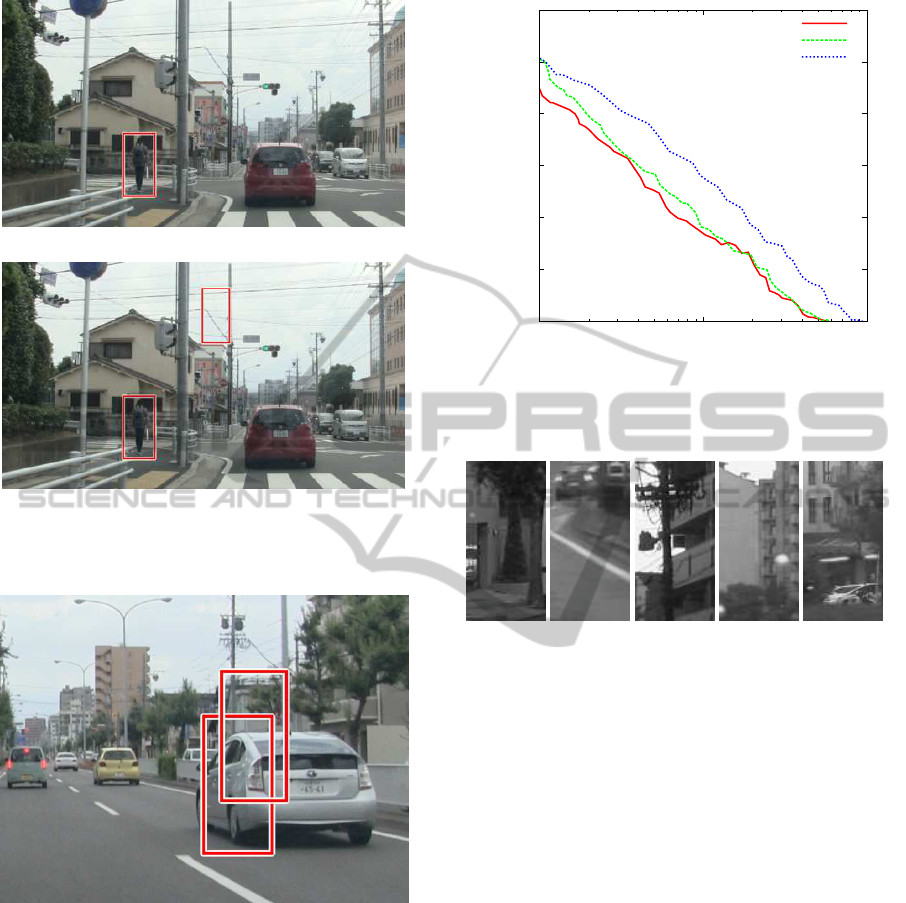
Figure 10 shows the detection accuracy of the pro-
posed method by changing k. Finer classification
makes the accuracy better, but it also increases the
size of the classifier pool. Therefore, it is a trade-off
EnvironmentAdaptivePedestrianDetectionusingIn-vehicleCameraandGPS
359
(a) Location adapted detector.
(b) Baseline detector.
Figure 8: Example 2 of the detection result of the proposed
method and the baseline method.
Figure 9: An example of miss-detection that could not be
eliminated by the proposed method.
between the cost and the accuracy, so we must choose
an adequate value for k.
Figure 11 shows examples of the collected non-
pedestrian images. Even if the scene is crowded with
pedestrians, the proposed method was able to auto-
matically collect non-pedestrian images properly. In
order to improvetraining image collection, a more so-
phisticated method might be effective instead of ran-
dom clipping. For example, collecting images close
to the road surface, or using miss-classified results
(false positives).
Figure 12 shows the result of scene classification
0.1
0.2
0.3
0.4
0.5
0.6
0.7
10
−5
10
−4
10
−3
Miss rate
False Positives Per Window (FPPW)
k =
k =
k =
Figure 10: Relationship between the number of driving
scene classes k and the detection accuracy. Here, k = 1 is
equivalent to comparative method 2.
Figure 11: Examples of non-pedestrian training images col-
lected automatically.
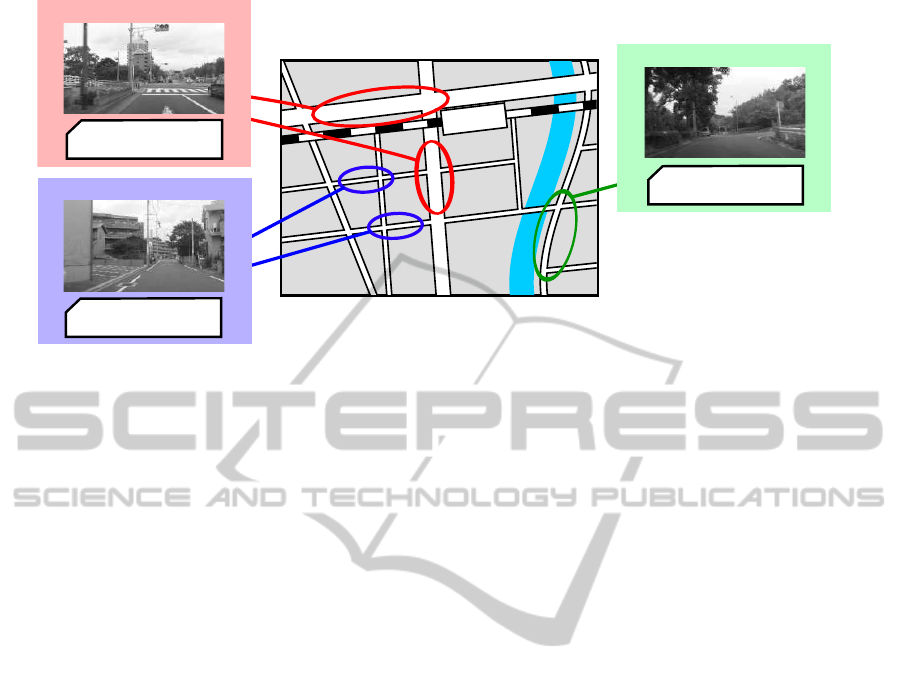
mapped using GPS location information. Each color
plotted on the road corresponds to a scene class. We
can observe that there are some cases that the color
changes frequently in a short section. It indicates
that the classification results were not stable. This
is because the proposed method classified the driving
scene for each frame independently. Incorrect classi-
fications were caused by the degradation of the entire
image, such as a big motion blur, occlusions by vehi-
cles in front, or over-exposure. To tackle these prob-
lems, removing outliers using temporal information
might be effective.
5 CONCLUSIONS
In this paper, we introduced the concept of location
adaptive pedestrian detection, and proposed a method
to create an accurate pedestrian detector adapted to
locations. To apply the optimal classifier for a scene
class, we built classifiers adaptive to driving envi-
ronments by collecting scene-wise training images.
Through experiments, we confirmed the effectiveness
of the proposed method. This framework can be com-
VISAPP2014-InternationalConferenceonComputerVisionTheoryandApplications
360
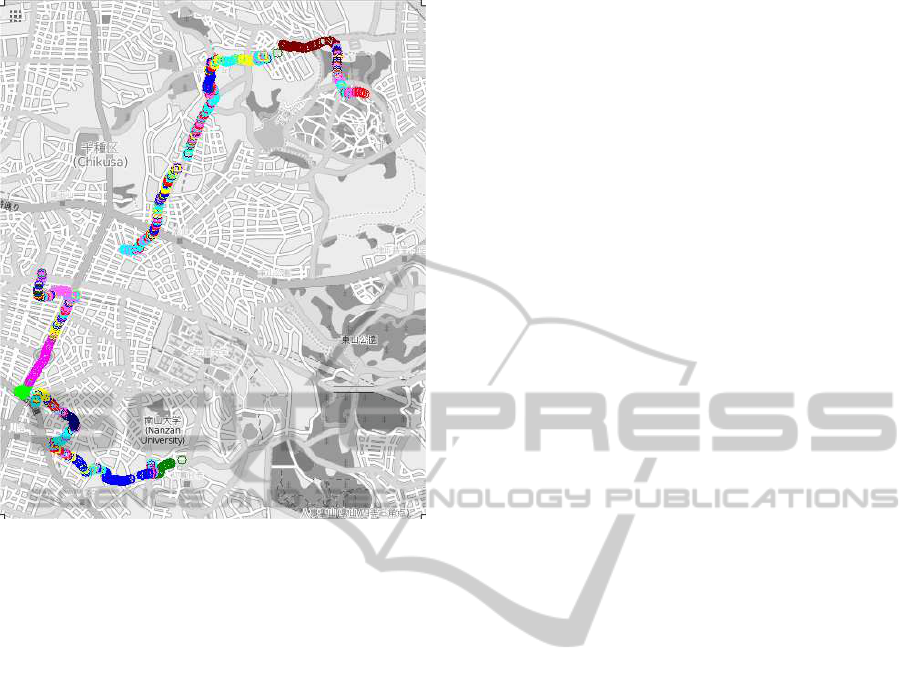
Figure 12: The result of driving scene classification drawn
on the map. Each circle with a different color plotted on the
road corresponds to a scene class.
bined with any conventional learning based pedes-
trian detection methods.
For future work, we will extend the method so
that it can be adapted to other factors of the driv-
ing environment such as time, weather conditions, or
season changes. In addition, we will improve the
scene classification by replacing the current BoVW
and k-means scheme, and the training image collec-
tion methods.
ACKNOWLEDGEMENTS
Parts of this research were supported by a Grant-in-
Aid for Young Scientists from MEXT, a Grant-In-Aid
for Scientific Research from MEXT, and a CREST
project from JST.
REFERENCES
Bay, H., Tuytelaars, T., and Gool, L. V. (2008). Surf:
Speeded up robust features. Computer Vision and Im-
age Understanding (CVIU), 110(3):346–359.
Broggi, A., Cerri, P., Ghidoni, S., Grisleri, P., and Jung,
H. G. (2009). A new approach to urban pedestrian
detection for automatic braking. IEEE Transactions
on Intelligent Transportation Systems, 10(4):594–605.
Csurka, G., Dance, C. R., Fan, L., Willamowski, J., and
Bray, C. (2004). Visual categorization with bags of
keypoints. In Proceedings of Workshop on Statistical
Learning in Computer Vision in the The 8th European
Conference on Computer Vision (ECCV), pages 1–22.
Dalal, N. and Triggs, B. (2005). Histograms of oriented gra-
dients for human detection. In Proceedings of 2005
IEEE Computer Society Conference on Computer Vi-
sion and Pattern Recognition, volume 1, pages 886–
893.
Fan, R.-E., Chang, K.-W., Hsieh, C.-J., Wang, X.-R., and
Lin, C.-J. (2008). LIBLINEAR: A library for large
linear classification. Journal of Machine Learning Re-
search, 9:1871–1874.
Mitsumori, R., Uchiyama, H., Saito, H., Servi`eres, M., and
Moreau, G. (2009). Change detection based on SURF
and color edge matching. In Proceedings of Workshop
on Vision and Control for Access Space (VCAS) in the
9th Asian Conference on Computer Vision (ACCV).
12p.
Nair, V. and Clark, J. J. (2004). An unsupervised, on-
line learning framework for moving object detection.
In Proceedings of 2004 IEEE Computer Society Con-
ference on Computer Vision and Pattern Recognition,
volume 1, pages 317–324.
Pang, J., Huang, Q., Yan, S., Jiang, S., and Qin, L. (2011).
Transferring boosted detectors towards viewpoint and
scene adaptiveness. IEEE Transactions on Image Pro-
cessing, 20(1):1388–1400.
Sand, P. and Teller, S. (2004). Video matching. ACM Trans-
actions on Graphics, 23(3):592–599.
Vinicius, P., Borges, K., Tews, A., and Haddon, D. (2012).
Pedestrian detection in industrial environments: See-
ing around corners. In Proceedings of 2012 IEEE In-
ternational Conference on Intelligent Robots and Sys-
tems, pages 4231–4232.
Wang, M. and Wang, X. (2011). Automatic adaptation of a
generic pedestrian detector to a specific traffic scene.
In Proceedings of 2011 IEEE Computer Society Con-
ference on Computer Vision and Pattern Recognition,
pages 3401–3408.
W¨ohler, C. (2002). Autonomous in situ training of clas-
sification modules in real-time vision systems and its
application to pedestrian recognition. Pattern Recog-
nition Letters, 23(11):1263–1270.
EnvironmentAdaptivePedestrianDetectionusingIn-vehicleCameraandGPS
361
