
Focus Evaluation Approach for Retinal Images
Diana Veiga
1,2
, Carla Pereira
1
, Manuel Ferreira
1,2
Luís Gonçalves
3
and João Monteiro
2
1
ENERMETER, Parque Industrial Celeirós 2ª Fase, Lugar de Gaião, Lotes 5/6, 4705-025 Braga, Portugal
2
Centro Algoritmi, University of Minho, Azurém, 4800-058 Guimarães, Portugal
3
Oftalmocenter, Rua Francisco Ribeiro de Castro, nº 205, Azurém, 4800-045 Guimarães, Portugal
Keywords: Digital Fundus Photography, Focus Measures, Image Processing.
Abstract: Digital fundus photographs are often used to provide clinical diagnostic information about several
pathologies such as diabetes, glaucoma, macular degeneration and vascular and neurologic disorders. To
allow a precise analysis, digital fundus image quality should be assessed to evaluate if minimum
requirements are present. Focus is one of the causes of low image quality. This paper describes a method
that automatically classifies fundus images as focused or defocused. Various focus measures described in
literature were tested and included in a feature vector for the classification step. A neural network classifier
was used. HEI-MED and MESSIDOR image sets were utilized in the training and testing phase,
respectively. All images were correctly classified by the proposed algorithm.
1 INTRODUCTION
Eye fundus imaging allows the observation of the
retina and the analysis of its constituents. With this
medical imaging examination several pathologies
can be diagnosed, mainly those related with blood
vessels modifications. In recent years there have
been numerous research attempts for the
development of systems to automatically analyze
fundus images. The success of these systems is
frequently affected by image quality which
sometimes is poor due to bad acquisition conditions
or the presence of occlusions, cataracts and opacities
in patients’ eyes. For a proper automated analysis,
fundus images must present a minimum quality that
not always is possible to guarantee by clinicians in
the capturing moment. Focus is one of the
parameters responsible for a reduced quality image,
which we propose to verify in digital fundus
photography.
The task of eye fundus image acquisition
demands a specific training as numerous conditions
must be fulfilled. Moreover, despite some
commercial fundus cameras comprise tools to assist
the photographer in the operation, focusing on the
fundus can be difficult and subjective.
Focus measures appear as methods to estimate
the sharpness of an image. Various algorithms have
been proposed for auto-focusing, estimating depth,
or just to determine the degree of blurring (Marrugo,
2012); (Yap, 2004); (Yang, 2003); (Pertuz, 2013)
(Moscaritolo, 2009). Pertuz et al., (2013) divides the
most popular measures in different groups:
Gradient-based operators, Wavelet-based operators,
Statistic-based operators, DCT-based operators and
Miscellaneous operators. However, very few of
these methods have been tested in fundus images
(Marrugo, 2012).
In general, a single focus operator is applied to
an image. Nonetheless, since fundus images content
extremely varies, a single focus operator cannot
always achieve a correctly focus estimation. To
address this issue, in this work, a group of focus
measures were selected and combined to be used in
a neural network classifier. A new approach to
automatically classify retinal images as
focused/defocused is described. Several experiments
were carried out using real focused fundus images
and synthetically defocused ones. Numerous focus
operators were tested and applied on the referred
digital images and their response to blur was
evaluated. In addition, this study reports the
application of an artificial neural network classifier
to obtain the final classification of retinal images.
Three focus measures were considered as input
features to the classifier: a wavelet-based measure, a
456
Veiga D., Pereira C., Ferreira M., Gonçalves L. and Monteiro J..
Focus Evaluation Approach for Retinal Images.
DOI: 10.5220/0004671104560461
In Proceedings of the 9th International Conference on Computer Vision Theory and Applications (VISAPP-2014), pages 456-461
ISBN: 978-989-758-003-1
Copyright
c
2014 SCITEPRESS (Science and Technology Publications, Lda.)
moment-based measure and a third measure based
on a statistic operator.
The paper is organized in the following sections:
Section 2 defines the methodology of the proposed
approach presenting the focus measures selected and
the neural network classifier. Also the datasets of
retinal images used in the experiments are detailed
in this section. Results are demonstrated and
discussed in Section 3. Finally, conclusions and
future work are addressed in section 4.
2 METHODOLOGY
The proposed approach aims to classify an eye
fundus image as focused or defocused after its
acquisition by the expert. The classifier inputs result
from the application of different focus operators. In
order to have a reasonable focus measure, some pre-
requisites must be complied: the obtained value
should decrease as blur augments; it should be
content-independent and robust to noise.
2.1 Eye Fundus Images
The Hamilton Eye Institute Macular Edema Dataset
(HEI-MED) (Giancardo, 2012) and the MESSIDOR
database were used to test the focus measures and
the implemented classifier. HEI-MED contains 169
fundus images of different patients, with a
reasonable mixture of ethnicities and disease state.
MESSIDOR database is comprised by 1200 images,
but only 200 were utilized.
Fundus images were artificially degraded to
achieve a defocused image from a focused one. The
degradation process operates on an input image
f(x,y), where a degradation function h(x,y) together
with additive noise η(x,y) produce a degraded image
g(x,y). If η(x,y) = 0, it yields the expression
,
,∗,
(1)
The symbol * refers to convolution. The 2-D
Gaussian function was used as degradation function
to produce the blurring effect. This function is
named point spread function (PSF) since this will
blur (spread) a point of light to some degree, with
the amount of blurring being determined by the
kernel size of 3030, 5050 and standard
deviation 5,15,30,45. Other size masks were
tested but only these were chosen to be shown here
as they are representative in terms of initial visual
detection of the blurring effect and distortion of the
image.
The training set consists of 200 images, 100
randomly chosen from the HEI-MED dataset and the
same images defocused. The test set is composed by
200 images, 100 original images and another 100
degraded with blur, from MESSIDOR. Figure 1
show three example images focused and defocused
from HEI-MED and MESSIDOR dataset.
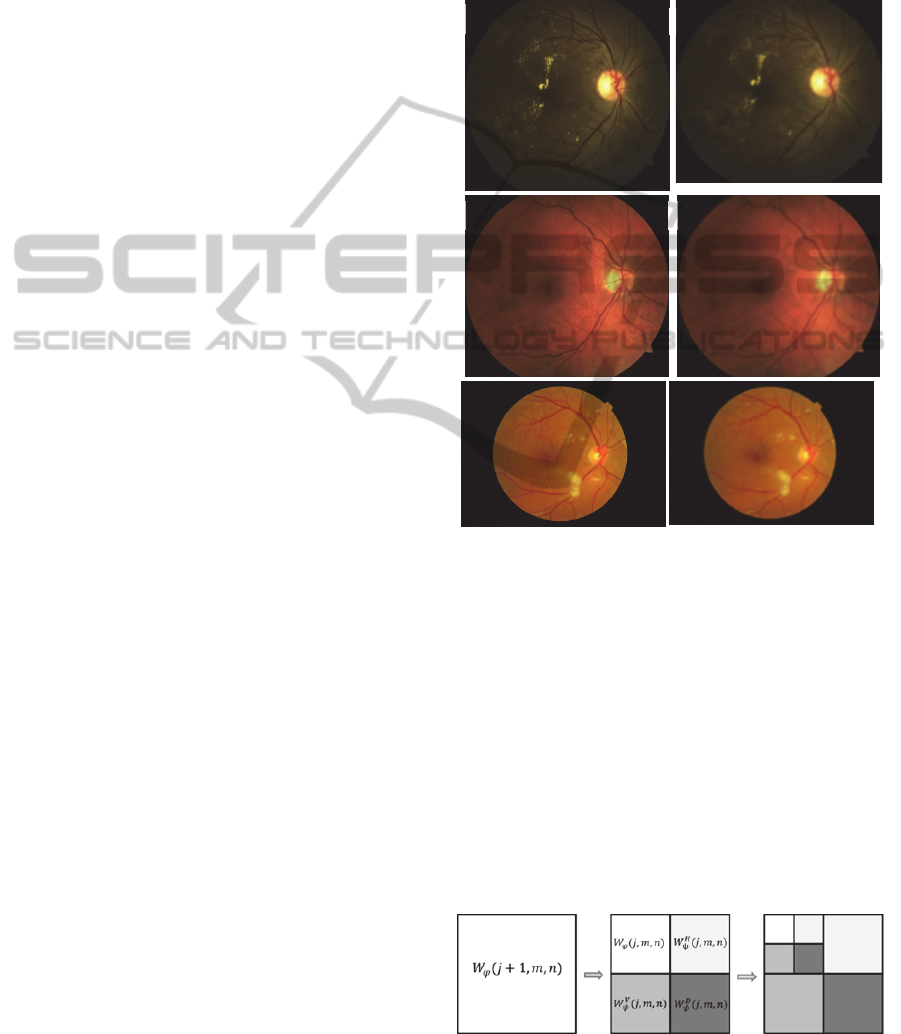
Figure 1: Digital fundus photographs from HEI-MED and
MESSIDOR. a) and c) Original image from HEI-MED; b)
and d) image a) and c) artificially defocused, respectively;
e) original image from MESSIDOR; f) artificially
defocused image from MESSIDOR. All defocused images
were obtained with kernel 3030and σ=45.
2.2 Wavelet-based Focus Measure
The focus measure operator utilized has been
proposed by Yang et al., (2003) and is constructed in
the wavelet transform domain. Wavelets measure
functional intensity variations along different
directions: horizontal (columns), vertical (rows) and
diagonal. A schematic representation of the wavelet
decomposition is depicted in Figure 2.
Figure 2: The 2-D Wavelet transform decomposition level
j, along m rows and n columns.
a
b
c
d
f
e
FocusEvaluationApproachforRetinalImages
457

The focus measure operator is defined as the
mean value of sum of detail coefficients of wavelets
decompositions in the first level, as follows (Yang,
2003):
∑∑
1,,
1,,
1,,
(2)
Here, the Daubechies Db6 mother wavelet was used
in the first level of decomposition, following the
same conditions as in (Yang, 2003). This measure
reflects the high-frequency component of the image,
which results from the high-pass filters of the
discrete wavelet transform. It is possible to perceive
that as blur increases the high-frequency information
contained in the image will decrease, making this
operator a good metric to evaluate focus.
2.3 Moment-based Focus Measure
Orthogonal moments have been used in many
applications such as image analysis, pattern
recognition, image segmentation, edge detection,
image registration among others. Their success is
due to their low information redundancy, capacity of
object description, invariance properties,
information compactness and transmission of spatial
and phase information of an image (Papakostas,
2009); (Wee, 2010). The most well-known
orthogonal moments are the Zernike and Legendre
moments. Chebyshev moments differ from the
previous as they are discrete orthogonal moments.
Inspired by the studies of Raveendran et al.
(Yap, 2004); (Wee, 2010), an image focus measure
based on Chebyshev moments was developed.
Different computation strategies appear to accelerate
these moments computation (Papakostas, 2009).
Here, the recursive strategy was followed to
calculate the Chebyshev polynomials, as in (Wee,
2010),
1
212
1
(3)
Where the order p is 1,…,1, and the
Chebyshev polynomials of zero and first order are
0
1 and
1
12, respectively.
In 2-dimensional images of size ,
Chebyshev moments of order behave as a
filterbank, where the convolution of a kernel defined
by the Chebyshev polynomials, with the image will
retain the image information. Figure 2 displays the
basis images (kernels) for the 2-dimensional discrete
Chebyshev moments until the 4
th
order (2+2).
After performing the convolution with the
obtained kernels, the maximum intensity value of
each 88 non-overlapping square region was
computed and the average for each order moment
was subsequently determined. The matrix M(x,y)
shows the moments organization,
,
(4)
Figure 3: Basis images of low-order Chebyshev moments.
The final focus measure is calculated as the ratio
between the summed values for moments of order p
+ q > 1 and p + q =< 1,
(5)
2.4 Statistical-based Focus Measure
The last focus measure applied to extract image
content information uses a median filter and
calculates the mean energy of the resulting image.
The median filter is normally used in
preprocessing steps of fundus images analysis
algorithms to reduce noise. This filter outperforms
the mean filter since it preserves useful details of the
image. The difference is that the median filter
considers the nearby neighbors to decide whether or
not a central pixel is representative of its
surroundings and replaces it with the median of
those values. By subtraction of the filtered image to
the original green plane image a difference image
with enhanced edges is obtained, Idif(x,y).
The statistics-based focus measure, FM
med
, is
calculated using the following expression,
VISAPP2014-InternationalConferenceonComputerVisionTheoryandApplications
458
,
(6)
This focus measure explores the fact that in a sharp
image, edges will appear with increased definition
than in blurred images. Consequently, the energy of
the former will be higher than the latter.
2.5 Artificial Neural Network (ANN)
Classifier
Neural networks are powerful computational tools
that attempt to mimic the brain function. Similarly to
the brain, artificial neural networks comprise
neurons organized in several layers. Different types
of ANN are described in literature and the selection
task of the most adequate is not an easy one.
Here, a multi-layer neural network with one
hidden layer constituted by 20 neurons was
constructed. The number of neurons was
experimentally tested. As hidden neuron activation
function the hyperbolic tangent sigmoid transfer
function was used. In the output layer, we used the
logistic sigmoid activation function, which is also a
sigmoidal function defined in [0, 1].
In this work, the classifier purpose is to classify
digital fundus photographs as focused or defocused,
for which we attribute classes 1 and 0, respectively.
The input vector for the neural network consists of a
three dimensional feature vector, corresponding to
the focus measures scores for each image. Three
focus measures were developed and added to the
classifier input features.
For the training phase the developed network
used backpropagation algorithm with the mean
square error function to enhance its performance.
3 RESULTS & DISCUSSION
In this section, the results of the applied focus
measures and the neural network classifier outputs
are presented.
First, the focus measures were tested
independently on the original focused and artificially
blurred images of the HEI-MED dataset. Different
kernel sizes (3030, 4040, 5050) and
standard deviations were used to blur the images.
The Gaussian function was employed as the PSF.
All focus measures were computed in the green
plane of the RGB fundus images. A mask of the
field of view was determined and applied to only
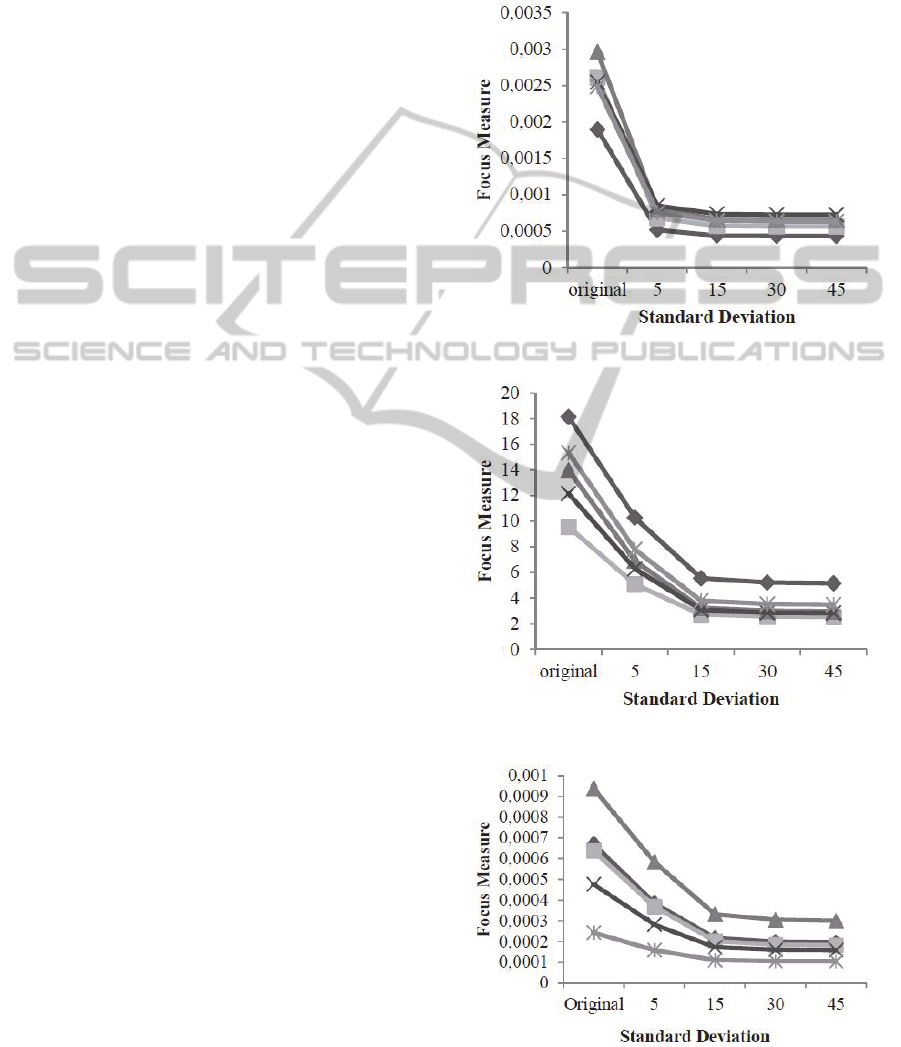
investigate the retina content. Figures 4, 5 and 6
show the measurements results of focus by varying
the standard deviation of five images of the selected
image database. The defocused images analyzed
were obtained with the kernel of size 3030.
Figure 4 regards to the wavelet-based focus
measure, Figure 5 to the moment-based approach
and Figure 6 to the statistics-base method.
Figure 4: Wavelet-based focus measure.
Figure 5: Basis images of low-order Chebyshev moments.
Figure 6: Basis images of statistic-based focus measure.
FocusEvaluationApproachforRetinalImages
459

It is possible to observe in Figures 4, 5 and 6 that
the focus measures are monotonically decreasing,
that is, as blur augments the focus operators output
value become lower. In the case of the wavelet-
based operator (Figure 4), the focus measure has a
larger decrease from the original image to the
blurred one with σ=5. However, the decline is less
accentuated between the different defocused scales.
In the moment-based and statistics-based operators
(Figure 5 and 6), the focus value decreases between
the original and σ=15 defocused image, remaining
almost equal for further blurring degree. This
behavior was observed in the entire set of images. It
is also important to note that even within the set of
original focused images, the measured value of
focus varies widely. Nonetheless, the value always
decreases when blur is present.
To make our approach more robust and flexible
in terms of the eye fundus content diversity, a group
of focus measures were combined to form the input
vector of a classifier. The classifier adds robustness
to the developed approach since it contours the
pitfalls of each method individually. A feedforward
backpropagation neural network was constructed to
the classification phase of the fundus images
regarding focus. The training was conducted with
100 images randomly chosen of the HEI-MED
dataset and 100 images artificially blurred. Next, the
network was tested with 200 images from the
MESSIDOR database.
Figure 7: ROC curve of the test images (MESSIDOR)
classification.
The output of the classifier comprises only two
classes: 1-focused, and 0-defocused. Matlab was
used to produce the ROC curve and calculate the
AUC (area under curve). ROC curves plot the true
positive fraction (or sensitivity) versus the false
positive fraction (or one minus specificity). Here,
sensitivity refers to the ability to classify an image
correctly as focused when it really is focused and
specificity is the number of defocused images
classified as focused. It was obtained an optimal
ROC curve with 100 % sensitivity and specificity
with all images correctly classified (Figure 7). The
AUC was consequently 1.
4 CONCLUSIONS
A new focus measure approach was presented in this
paper. It is based on focus operators that were never
tested in fundus images. The moment-based focus
measure was adapted from literature and the
statistics-based operator was developed and added to
increase the approach robustness. All operators were
tested independently. Due to the variability of
fundus images, a combined approach that could
embrace these variances and surpass the focus
measures handicaps was developed. Blurred images
were correctly identified among a heterogeneous
group of focused and defocused images.
Results are promising and further images should
be tested. As future work, we expect to gather
original defocused images to test the proposed
method. Also, it is expected to combine this
technique with another that identifies the presence of
bright artifacts originated in the acquisition moment
by illumination. Other classifiers will also be tested
in order to compare performance.
Image quality evaluation of fundus images is an
important task that should precede the diagnosis by
an automatic system. The proposed focus method
can be an essential part of such a system.
ACKNOWLEDGEMENTS
Work supported by FEDER funds through the
“Programa Operacional Factores de Competitividade
– COMPETE” and by national funds by FCT –
Fundação para a Ciência e a Tecnologia. D. Veiga
thank the FCT for the SFRH/BDE/51824/2012.
MESSIDOR images were kindly provided by the
Messidor program partners.
REFERENCES
Giancardo, L. et al., 2012. Exudate-based diabetic macular
edema detection in fundus images using publicly
available datasets. Medical image analysis, 16(1),
pp.216–26.
Marrugo, A.G. et al., 2012. Anisotropy-based robust focus
measure for non-mydriatic retinal imaging. Journal of
VISAPP2014-InternationalConferenceonComputerVisionTheoryandApplications
460

biomedical optics, 17(7), p.076021.
Moscaritolo, M. et al., 2009. An image based auto-
focusing algorithm for digital fundus photography.
IEEE transactions on medical imaging, 28(11),
pp.1703–7.
Papakostas, G. A., Mertzios, B.G. & Karras, D. a., 2009.
Performance of the Orthogonal Moments in
Reconstructing Biomedical Images. 2009 16th
International Conference on Systems, Signals and
Image Processing, pp.1–4.
Papakostas, G. & Koulouriotis, D., 2009. A General
Framework for Computation of Biomedical Image
Moments. Biomedical Engineering Trends in
Electronics, Communications and Software.
Pertuz, S., Puig, D. & Garcia, M. A., 2013. Analysis of
focus measure operators for shape-from-focus. Pattern
Recognition, 46(5), pp.1415–1432.
Wee, C.-Y. et al., 2010. Image quality assessment by
discrete orthogonal moments. Pattern Recognition,
43(12), pp.4055–4068.
Yang, G. & Nelson, B., 2003. Wavelet-based autofocusing
and unsupervised segmentation of microscopic
images. International Conference on Intelligent
Robots and Systems, Proceedings of the 2003
IEEE/RSJ, (October).
Yap, P. T. & Raveendran, P., 2004. Image focus measure
based on Chebyshev moments. IEEE Proc.-Vision,
Image and Signal Processing, 151(2).
FocusEvaluationApproachforRetinalImages
461
