
Multi-spectral Flash Imaging under Low-light Condition using
Optimization with Weight Map
Bong-Seok Choi, Dae-Chul Kim, Wang-Jun Kyung and Yeong-Ho Ha
School of Electronics Engineering, Kyungpook National University, 1370, Sankyuk-dong, Buk-gu, Dae-gu, Korea
Keywords: Multi-spectral Flash, Weight Map, Computational Photography.
Abstract: Long exposure shot and flash lights are generally used to acquire images under low-light environments.
However, flash lights often induce color distortion, red-eye effect, and they can disturb the subject. The
other hand, long-exposure shots are prone to motion-blur due to camera shake or subject-motion. Recently,
multi-spectral flash imaging has been introduced to overcome the limitations of traditional low-light
photography. Multi-spectral flash imaging is performed by combining the invisible and visible spectrum
information. However, common multi spectral flash approaches induce color distortion due to the lower
accuracy of the invisible spectrum image. In this paper, we propose a multi-spectral flash imaging algorithm
using optimization with weight map in order to improve color accuracy and brightness of image. The UV/IR
and visible spectrum images are firstly captured, respectively. Then, to compensate luminance value under
low light condition, tone reproduction is performed by using adaptive curve due to image features that is
obtained by Naka-Rushton formula. Next, to discriminate uniform regions from detail regions, weight map
is generated by using Canny operator. Finally, the optimization object function takes into account the output
likelihood with respect to the visible light image, the sparsity of image gradients as well as the spectral
constraints for the IR-red channels and UV-blue channels. The performance of the proposed method has
been subjectively evaluated using z-score, and we also show that output images have improved color
accuracy and lower noise with respect to other methods.
1 INTRODUCTION
Cameras generally produce images by acquiring
light in a controlled fashion: camera shutter speed,
aperture, and flash all play important roles in the
acquisition process. In particular, the most common
solutions for low-light photography are either the
use of flash lights or the use of long exposure times.
On one hand, flashes often introduce undesired
artifacts or effects, such as red-eyes, false shadows,
high intensity specular reflections and changes in the
color of ambient light. Furthermore, flash lights may
dazzle the subjects because of their impulsive nature
and high intensity. A number of methods have been
proposed to reduce the artifacts produced by the use
of flash lights, for example, highlight and reflection
removal by gradient coherency (Agrawal et al.,
2005). On the other hand, long-exposures are
particularly difficult because of possible subject or
camera motion, which will produce image blur.
While blur due to subject motion is a harder
problem, blur resulting from camera shake has been
approached by various methods, such as new
imaging systems that introduce panchromatic pixels
as the image prior (Wang, 2012) or the estimation of
motion blur, e.g. by solving a maximum a-posteriori
problem (Fergus et al., 2006; Jiaya, 2007).
Research on the acquisition of high-quality
images in low-light environments is very active
topic and a number of solutions have been proposed,
the general trend being the acquisition of extended
data (multi-spectral images or multiple exposures).
One of such approach is based on flash/no-flash
image couples and bilateral filtering: image noise in
the no-flash image is reduced via bilateral filtering
and detail is transferred from the flash image using
joint-bilateral filtering (Petschnigg et al., 2004;
Eisemann et al., 2004). However, this method still
requires the use of a flash gun, which may result in
subject discomfort. Another approach requires the
acquisition of one image in the visible spectrum and
one in the UV/IR spectrum. The acquisition is
possible owing to the extended sensitivity of modern
digital camera sensors and the use of an invisible
33
Choi B., Kim D., Kyung W. and Ha Y..
Multi-spectral Flash Imaging under Low-light Condition using Optimization with Weight Map.
DOI: 10.5220/0004657500330039
In Proceedings of the 9th International Conference on Computer Vision Theory and Applications (VISAPP-2014), pages 33-39
ISBN: 978-989-758-003-1
Copyright
c
2014 SCITEPRESS (Science and Technology Publications, Lda.)
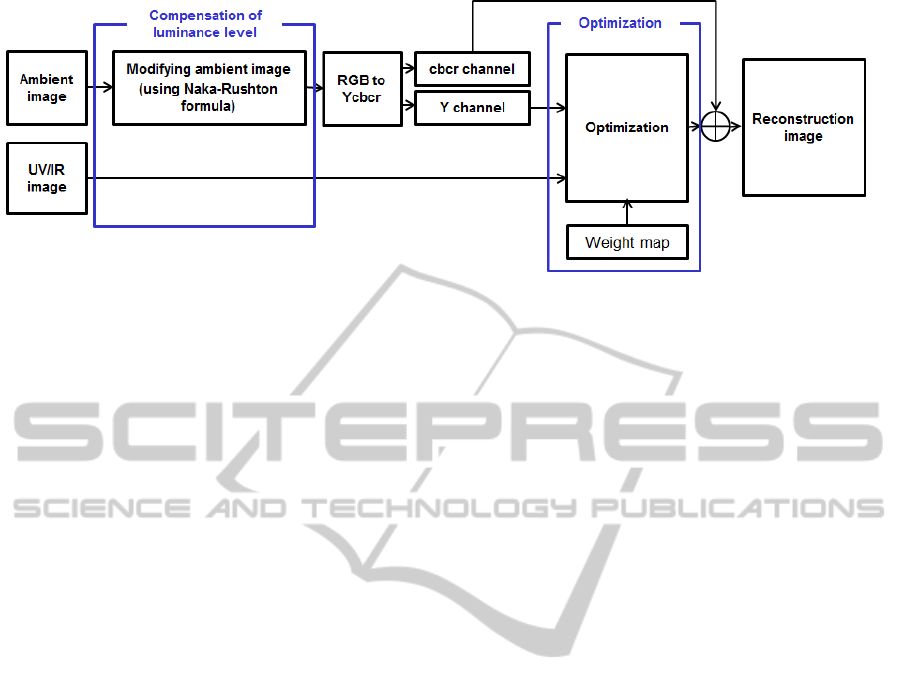
Figure 1: Flow chart of the proposed method.
light flash gun. The visible spectrum image then
becomes the source of color information, while the
UV/IR spectrum image is used to extract details.
Krishnan and Fergus proposed the use of UV, IR
and visible spectrum data together with iterative re-
weighted least squares (IRWLS) optimization(D.
Krishnan and R. Fergus, 2009). Later, Zhuo et al.
made use of weighted least squares (WLS)
optimization to simultaneously perform visible
spectrum image denoising and IR spectrum image
detail transfer (Zhuo et al., 2010). These approaches
still produce output images affected by color
distortion and artifacts since they assume that UV/IR
spectrum images are noiseless image, yet noise is
actually present in the UV/IR spectrum image. The
purpose of the optimization was to minimize
difference of details between reconstruction image
and UV/IR image. However, the gradient values of
noises are also treated as detail information in
optimization process. For this reason, optimization
achieved detail enhancement and denoising in
visible spectrum image. At the same time, color
distortion and artifacts are produced by the UV/IR
spectrum image`s noise in uniform region.
In this paper, we suggest the acquisition of a high
quality image in low-light condition using multi-
spectral flash imaging. To for compensate low
luminance values under low-light conditions,
adaptive tone reproduction is performed by using
Naka-Rushton formula, then, a weight map
representing the feature of the scene is calculated by
applying the Canny operator to Y channel of the
UV/IR image. The weight map is thus used to
discriminate uniform and detail regions during the
optimization process. Uniform regions are computed
with decreased detail term influence and applied
bilateral filter whereas detail region are computed
with increased detail term contribution. Therefore,
the proposed method can achieve noise reduction
and improved color accuracy with respect to
previous works.
2 MULTI-SPECTRAL FLASH
IMAGING BASED ON WEIGHT
MAP
In order to obtain a high-quality image in low-light
conditions by using the multi-spectral flash imaging,
there is need to compensate for the low-luminance
values, enhance the detail and reduce noise. Because
captured image without flash light are generally dark
and UV/IR image have a lot of details. The process
of multi-spectral imaging based on weight map is
illustrated in Fig. 1. Firstly, to compensate
luminance value, Naka-Rushton formula is applied
to dark and bright region of visible spectrum image.
Next, to enhance the detail information and reduce
the noise, Y channel of visible spectrum image is
optimized by using detail information of UV/IR
flash and visible spectrum images. To optimize a
pair of images, visible and UV/IR flash image are
converted to YCbCr color space and the
optimization method uses only Y channel. In
optimization process, we applied weight map as
discriminate between uniform region and edge
region for reducing UV/IR flash image`s noise of
uniform region and it is generated by using by multi-
scale Canny edge operator. Finally, reconstruction
image is combined by visible spectrum image`s Cb
and Cr channels and optimized Y channel
.
2.1 Acquisition of Visible and UV/IR
Spectrum Image
Multi-spectral flash imaging uses visible and UV/IR
spectrum image pair. A visible and UV/IR spectrum
image pair captures the scene at 5 difference
VISAPP2014-InternationalConferenceonComputerVisionTheoryandApplications
34
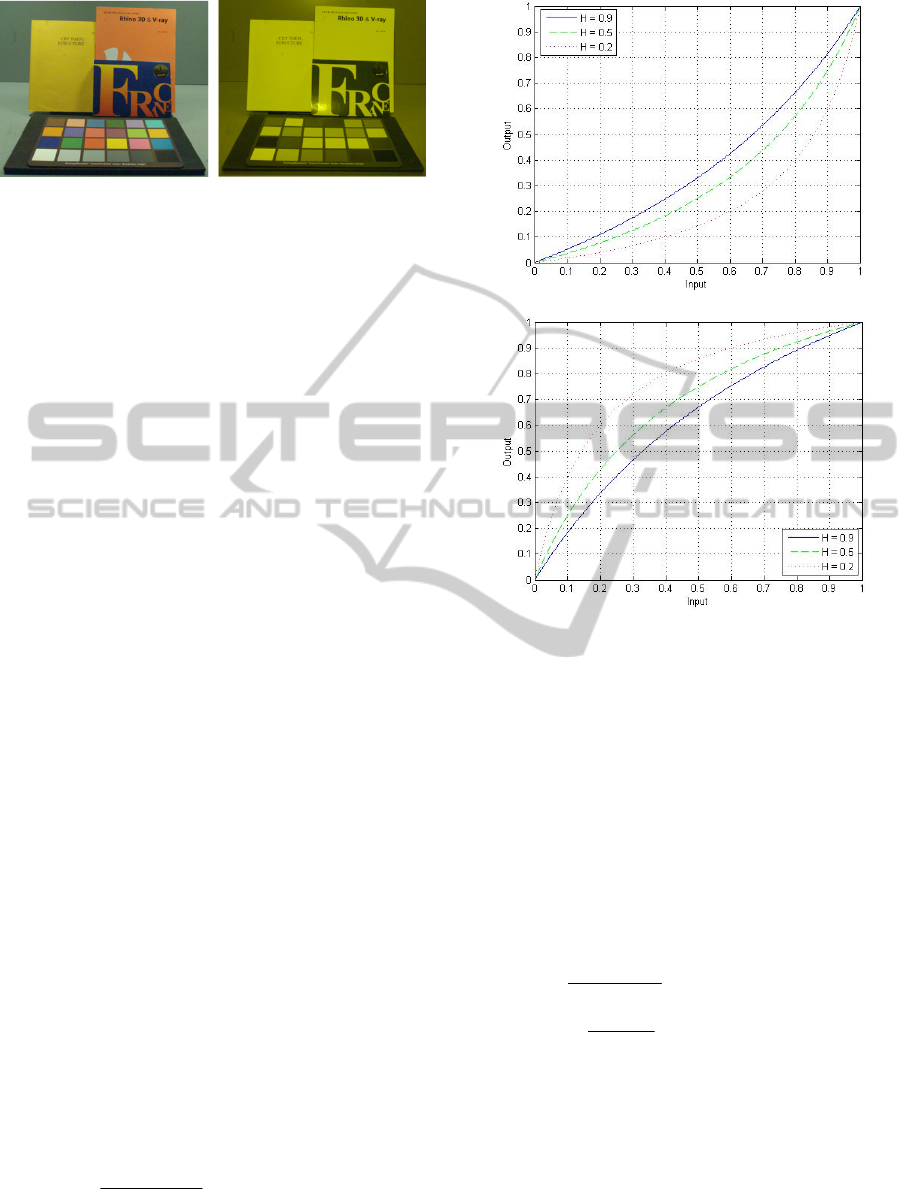
(a) (b)
Figure 2: Multi-spectral images; (a) visible spectrum
image. (b) UV/IR spectrum image.
spectrum bands that UV (370~400nm), B, G, R, and
IR (700~800nm). However, commercially available
digital cameras obtain images in the visible spectrum
only. To acquire both the UV/IR and visible
spectrum, we modified a common digital camera
system (Samsung NX-100) as follows. First, IR-cut
filter in front of CCD sensor was removed for
acquiring IR spectrum band. And, IR-cut
filter(~800nm) was attached on camera lens to avoid
excessive IR spectrum energy acquisition. Next, the
UV absorb coating of Xenon flash lamp was
removed to allow UV spectrum projection and
acquisition. Finally, a visible light cut filter was
attached in front of the flash light to reduce
discomfort. The visible and UV/IR flash image are
captured by the modified camera, as shown in Fig. 2.
UV/IR flash images are noise free and contain
plentiful detail information from the scene.
However, UV/IR flash images do not have color
information, as shown in Fig. 2(a). On the contrary
to UV/IR image, no-flash image contains color
information and noise in Fig. 2(b).
2.2 Compensation of Low Luminance
Value in Visible Spectrum Image
The visible spectrum image has low-luminance
levels due to low ambient lighting and short
exposure time. In order to improve the quality of the
image we need to compensate for the low luminance
values. While, gamma correction can be used to
compensate for such problem, it causes the
appearance of noise in dark regions and saturated
pixels in bright regions. Thus we compress the
luminance data in a different way, using the Naka-
Rushton formula (Naka and Rushton, 1966). The
Naka-Rushton formula can be represented as
follows..
,
max( ( , )
,
,
v
cv
v
Iij
I
Iij H
Iij H
ij
(1)
(a)
(b)
Figure 3: Naka-Rushton curve and inverse Naka-Rushoton
curve according to parameter H: (a) inverse Naka-Rushton
curve apply to dark region, (b) Naka-Rushton curve apply
to bright region.
where, I
v
(i,j) and max(I
v
(i,j)) are the pixel value of
visible spectrum image and maximum pixel value of
visible spectrum image, respectively. The parameter
H controls the function`s slope. max(I
v
(i,j))+H is
normalized to make output I
c
in the range of [0,1].
To compress dark current noise in dark region
and compensate pixel value in bright region, Naka-
Rushton curve or inverse Naka-Rushton curve is
applied according to threshold T as follows.
(2)
where, T is the threshold used to divide dark region
and bright region..
The Naka-Rushton and inverse Naka-Rushton
curve in Equation (2) are as shown in Fig. 3. The
adaptive curve due to image features is applied to
image by using Parameter H and threshold T.
Therefore, visible spectrum with compensated
luminance is acquired.
1,
110,
1,
,
,
,1
,
v
v
v
c
v
v
v
Iij
TH IijT
Iij H
Iij
Iij
TH TIij
Iij H
Multi-spectralFlashImagingunderLow-lightConditionusingOptimizationwithWeightMap
35
2.3 Optimization of Multi-Spectral
Flash Image using Weight Map
The previous multi-spectral flash imaging is an
efficient technique for acquiring images in low-light
environments without visible flash and long-
exposure time (D. Krishnan and R. Fergus, 2009).
However, this method introduces color distortion
and artifacts. While it is assumed that UV/IR flash
images are noiseless, this isn’t true as seen in Fig. 4.
The purpose of the optimization was to minimize
difference of details between reconstruction image
and UV/IR flash image. However, as seen in Fig. 4
noise is existed on UV/IR flash images. This
gradient value of noises was also computed as a
detail information in the optimization process. For
this reason, optimization achieved detail
enhancement and denoising in no-flash image
whereas color changes and artifact were produced by
the UV/IR spectrum image`s noise in uniform
regions.
In this paper, For enhancing detail information
and denoising, optimization process is performed by
using luminance enhanced visible spectrum image
and UV/IR flash image, as follows. First, visible
spectrum image is converted into YCbCr color space
for calculating the luminance and color channels,
separately. Then, luminance channel is applied to
optimization process for reproducing the detail of
image. In optimization process, weight map is
applied to a pair of images of visible and invisible
image for enhancing detail information and reducing
the artifacts in uniform region.
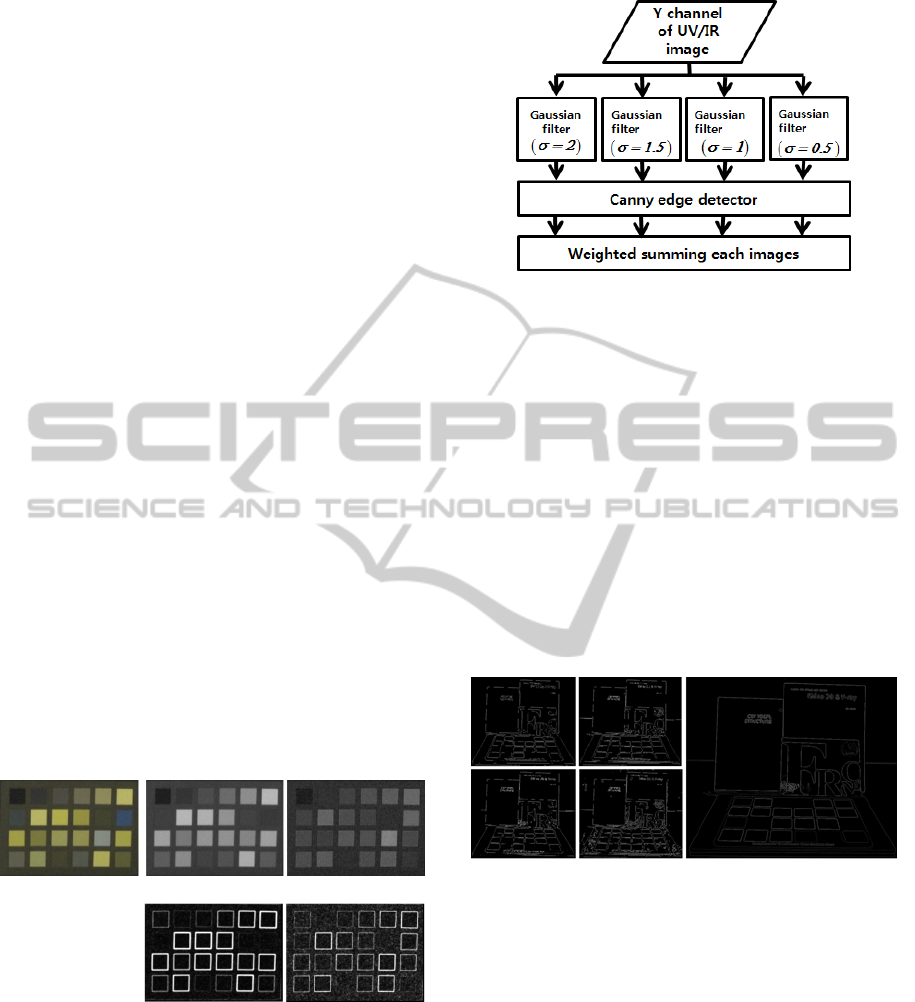
(a) (b) (c)
(d) (e)
Figure 4: Problem of UV/IR spectrum image use to detail
enhancement and denoising; (a) UV/IR flash image, (b) R
channel with UV/IR flash image, (c) B channel with
UV/IR image, (d) edge map of (b), (e) edge map of (c).
2.3.1 Weight Map Construction
The previous method was solving optimization by
pixel-by-pixels. To improve the previous method,
Figure 5: The Flowchart of constructing weight map.
we added feature information in optimization
process. In other words, we build weight map for
discriminate between uniform region and edge
region in the scene. For constructing weight map
containing detail of the scene and reducing false
detail(noise of uniform region), we apply gaussian
filtering for different four sigma value. The flow
chart of constructing weight map is shown in Fig. 5.
In this work, we use luminance channel of
UV/IR spectrum image`s. RGB color space is
translated to YCbCr color space as follows.
0.2126 0.7152 0.0722
0.1146 0.3854 0.5
0.5 0.4542 0.0458
b
r
YR
CG
CB
(3)
(a) (b)
Figure 6: Proposed combined weight map; (a) applying
different gaussian scale smoothing(σ=2, 1.5, 1.0, 0.5) in Y
channel with UV/IR flash image, (b) combined weight
map.
To detect robust feature, a combined weight map
was proposed. In this work, our goals are to improve
the detail representation performance and reduce
false details by combining four weight maps,
Gaussian applied different scale for smoothing, and
then we apply them to canny edge detection (Canny,
1986). Representing combined weight map M in eq.
(4).
1
,,
J
jj
j
M
xy w E xy
(4)
VISAPP2014-InternationalConferenceonComputerVisionTheoryandApplications
36

where,
,0
,
0,
, ,
j
j
iY
Exy
Exy
otherwise
xyI
(5)
where E
j
is jth weight map. Here, w
j
denotes the
weight with the sigma values of gaussian blur
filtering, and I
iY
(x,y) denotes the intensity value of
Y channel of the UV/IR flash image. The combined
weight map is shown in Fig. 6.
2.3.2 Multi-Spectral Flash Image
Reconstruction based on Weight Map
We apply weight map in order to complement pixel-
by-pixel optimization method with the previous
multi-spectral flash imaging. In other words, weight
map discriminates weighting in optimization process
with uniform region and detail region. The weight
map is used to decrease the weight of detail term in
uniform region and to increase the weight of detail
term in detail region. Accordingly, detail region is
enhanced because detail information of UV/IR flash
image is mainly applied to detail region of
reconstruction image and information of visible
spectrum image is mainly applied to uniform region
of reconstruction image.
Therefore, reconstruction image is obtained by
solving the object function of the optimization as
follows.
2
_
_
arg min
Y
YcY Y
YiIR
R
p
YiUV
Rp I p M Rp
MRp I p
MRp I p
(6)
where M denotes proposed weight map and I
cY
, I
i_IR
and I
i_UV
are Y channel of visible spectrum image, R
channel of UV/IR flash image, and B channel of
UV/IR flash image, respectively. And μ, κ and α are
parameters for optimization. The object function is
solved by using iterative re-weight least square
(IRWLS) (Krishnan and Fergus, 2009). Implemen-
tations of optimization for only Y channels with 5
iteration per channel. Weight of each term calculates
by eq. (4) and (5).
arg min arg min
Yi iYi
R
IMWRI
(7)
2
1ii
WR F
(8)
where W
i
denotes i th iterative weight for solving
optimization. namely, according to eq. (8),
calculating weight each iterations with weight map.
After optimization of Y channel, reconstruction of Y
channel is combined with CbCr channel of visible
spectrum image.
3 EXPERIMENTS AND RESULTS
3.1 Experimental Environments
and Results
To acquire multi-spectral flash image, we used a
modified Samsung NX-100 camera (as described in
Sec. 2.1). We acquired the UV/IR and visible
spectrum images under 90 lux of illumination. Fig. 7
and 8 represented the resulting images of the
proposed method and D. Krishnan and R. Fergus`s
method. The parameters used are H=0.97 and T =0.3.
As seen Fig. 7 and 8, the proposed method reduces
color artifacts and distortion more than the previous
method, in particular color distortion in uniform
regions. The performance of the proposed method
has been subjectively evaluated by using z-score
(Morovic, 2008). We tested color rendition, noise
presence, and personal preference for 7 images.
(a)
(b)
Figure 7: Resulting images; (a) Krishnan and Fergus`s
method (b) proposed method.
Table 1: z-score of color preference between D. Krishnan
and R. Fergus`s method and proposed method.
Previous method Proposed method
Book1
-1.644853 1.644853
Book2
-1.644853 1.644853
Book3
-0.38532 0.38532
Person1
-0.125661 0.125661
Person2
-0.841621 0.841621
Dolls
-0.38532 0.38532
Bowls
-6 6
Table 2: z-score of comparing noise between D. Krishnan
and R. Fergus`s method and proposed method.
Previous method Proposed method
Book1
-1.644853 1.644853
Book2
-1.036433 1.036433
Book3
-1.281551 -1.281551
Person1
0.125661 -0.125661
Person2
-0.125661 0.125661
Dolls
-0.67499 0.67499
Bowls
0 0
Multi-spectralFlashImagingunderLow-lightConditionusingOptimizationwithWeightMap
37
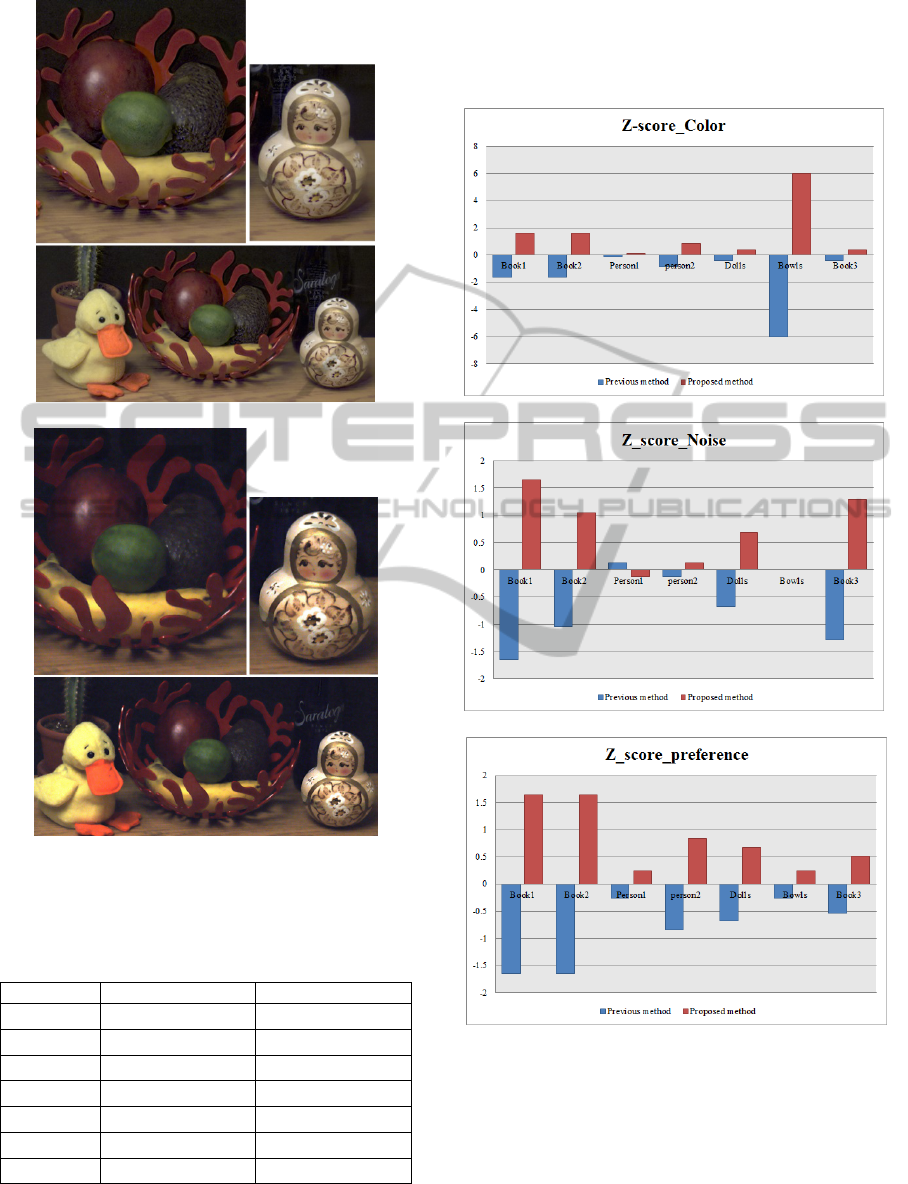
(a)
(b)
Figure 8: Resulting images; (a) Krishnan and Fergus`s
method (b) proposed method.
Table 3: z-score of personal preference between D.
Krishnan and R. Fergus`s method and proposed method.
Previous method Proposed method
Book1
-1.644853 1.644853
Book2
-1.644853 1.644853
Book3
-0.524401 0.524401
Person1
-0.253347 0.253347
Person2
-0.841621 0.841621
Dolls
-0.67499 0.67499
Bowls
-0.253347 0.253347
The investigation is based on 30 observers with
20 ordinary person and 10 image processing
professionals. Experimental results are represented
in Tables 1, 2 and 3 and Fig. 9. The z-score for the
proposed method are generally higher than D.
Krishnan and R. Fergus`s method.
(a)
(b)
(c)
Figure 9: comparison of z-score of color, noise and
personal preference between D. Krishnan and R. Fergus`s
method and proposed method; (a) evaluation of color
accuracy, (b) evaluation of noise reduction, (c) personal
preference of resulting image.
VISAPP2014-InternationalConferenceonComputerVisionTheoryandApplications
38

4 CONCLUSIONS
Multi-spectral flash images are a combination of
UV/IR and visible spectrum information. This paper
proposes a multi-spectral flash imaging algorithm
based on an optimization problem and a combined
weight map to enhance detail and reduce noise and
artifacts. The Naka-Rushton curve is used to
compensate for the low luminance values in visible
spectrum image. Also, to compress dark current
noise and avoid saturation, the Naka-Rushton curve
is applied adaptively to dark and bright regions. The
optimization process is enhanced by using a weight
map that decreases the weight of false details in
uniform regions. Experimental results showed
improvements in color accuracy and a lower
presence of artifacts when compared to previous
methods.
ACKNOWLEDGEMENTS
This work was supported by the National Research
Foundation of Korea (NRF) grant funded by the
Ministry of Education, Science and Technology
(MEST) (No. NRF-2013R1A2A2A010 16105)
REFERENCES
Agrawal A., Raskar R., Nayar S. K., and Li Y. (2005).
Removing Photography Arifacts using Gradient
Projection and Flash-Exposure Sampling. ACM
Transaction on Graphics, 24(3): 828-835.
Canny J. (1986). A Computational Approach to Edge
Detection. IEEE Transaction on Pattern Analysis and
Machine Intelligence, 8(6): 679-714.
Eisemann E., and Durand F. (2004). Flash Photography
Enhancement via Intrinsic Relighting. ACM
Transaction on Graphics, 23(3): 673-678.
Fergus R., Singh B., Hertzmann A., Roweis S. T. and
Freeman W. T. (2006). Removing Camera Shake from
a Single Photograph. ACM Transaction on Graphics,
25(3): 787-794.
Jiaya J. (2007). Single Image Motion Deblurring using
Transparency. Confference on IEEE Computer Vision
and Pattern Recongnition.
Krishnan D. and Fergus R. (2009). Dark Flash
photography. ACM Transaction on Graphics, 28(3): 1-
11.
Morovic J. (2008). Color Gamut Mapping. Published in
Association with the Society for IS&T.
Naka K. I. and Rushton W. A. H. (1966). S-potentials
from luminosity units in the retina of fish. Journal of
physiol. 185(3): 587-599
Petschnigg G., Szeliski R., Agrawala M., Cohen M.,
Hoppe H., and Toyama K. (2004). Digital
photography with Flash and No-Flash Image Pairs.
ACM Transaction on Graphics, 23(3): 664-672.
Wang S., Hou T., Border J., Qin H., and Miller R. (2012)
High Quality Image Deblurring Panchromatic Pixels.
ACM Transaction on Graphics, 31(5): 120:1-120:11.
Yangfang W. and Yupin L. (2012). Balanced color
contrast enhancement for digital images. Optical
Engineering, 51(10): 107001-1 – 107001-11
Zhuo S., Zhang X., Miao X., and Sim T. (2010).
Enhancing Low Light Images using infrared Flash
Images. IEEE 17th International Conference on Image
Processing.
Multi-spectralFlashImagingunderLow-lightConditionusingOptimizationwithWeightMap
39
