
SOUND PARAMETER ESTIMATION IN A SECURITY SYSTEM
Ivan Garvanov, Hristo Kabakchiev
University of Library Studies & Information Technologies, Sofia, Bulgaria
Faculty of Mathematics & Informatics,Sofia University, 15 Tsar Osvoboditel Blvd., Sofia, Bulgaria
igarvanov@yahoo.com, ckabakchiev@yahoo.com
Vera Behar
Institute of Information & Communication Technologie, BAS, 25-A Acad. G.Bonchev Str., Sofia, Bulgaria
behar@bas.bg
Keywords: Adaptive signal processing, microphone arrays, sound parameter estimation
Abstract: In this paper, the signal processing approach is applied to the sound parameter estimation using adaptive
microphone arrays. The simulation scenario describes a situation where three sensors generate three
different sound signals (warning, alarm and emergency) and a car is the source of natural noise. The results
obtained demonstrate that the parameter estimation can be used for recognition of the type of abnormal
situations arisen in the area of observation in order to be taken the corresponding solutions for control of the
security system.
1 INTRODUCTION
The sensors used for protection are activated in the
event of an adverse situation in the protected space.
In case of fire, smoke, vibration, and breakage of
glass or opening the car the sirens of sensors give a
loud beep for a few minutes. The assessment of the
direction and parameters of the incoming sound
signals can be used to guide the camera that records
the situation in the most dangerous direction. The
algorithm described in (Benesty, 2008; Godara,
1997; Trees, 2002; Vouras, 1996; Moelker, 1996;
Behar,2010) is intended to locate the direction of
sound signals coming from sensors or other sources
of sound using microphone arrays. Microphone
arrays represent a set of microphones arranged in a
geometric configuration. In fact, they can be realized
or linear microphone arrays, where the microphones
are positioned in a straight line or circular
microphone arrays, where the microphones are
placed in a circle or rectangular microphone arrays,
where the microphones are arranged in the shape of
a rectangle plate.
After the analysis of parameters of such sound
signals that arrived from the detected directions the
video cameras are directed in such directions, from
where have been arrived the signals having the most
important priority (emergency, alarm and warning).
In modern security and surveillance systems, the
operational control of protective and warning means
is based on the analysis of alarms received from
different sensors installed in the observation area. In
this paper we consider a situation where the
operational control of a video camera is based on
sound parameter estimation.
The simulation scenario includes three sensors,
which generate three types of signals (warning,
alarm and emergency), and one source of natural
noise (car). The parameters of three sound
generators produced by three well-known companies
SoniTron, E2s and Sensor Systems are used in
simulation. The results obtained demonstrate that the
sound parameter estimates are very close to real
sensors parameters. The paper evaluates both the
duration of the sound pulse and the signal frequency
spectrum by using the FFT.
In this paper, a possible signal processing
algorithm is proposed for sound parameter
estimation. We consider the case, when the sound
source is located in the array’s far-field, and the
sounds generated by sound sources propagate
through the air. After analysis of parameters of all
signals received from the detected directions, a
140
Garvanov I., Kabakchiev H. and Behar V.
SOUND PARAMETER ESTIMATION IN A SECURITY SYSTEM.
DOI: 10.5220/0004786401400144
In Proceedings of the Second International Conference on Telecommunications and Remote Sensing (ICTRS 2013), pages 140-144
ISBN: 978-989-8565-57-0
Copyright
c
2013 by SCITEPRESS – Science and Technology Publications, Lda. All rights reserved
0 0.5 1 1.5 2
-0.01
0
0.01
Signal
Signal-1
time [s]
0 1000 2000 3000
-100
-50
0
Signal spectrum
dB
frequency [Hz]
0 0.5 1 1.5 2
-0.01
0
0.01
Signal-2
time [s]
0 1000 2000 3000
-100
-50
0
dB
frequency [Hz]
0 0.5 1 1.5 2
-0.01
0
0.01
Signal-3
time [s]
0 1000 2000 3000
-100
-50
0
dB
frequency [Hz]
0 0.5 1 1.5 2
-0.02
0
0.02
Signal
Signal-1
time [s]
0 1000 2000 3000
-100
-50
0
Signal spectrum
dB
frequency [Hz]
0 0.5 1 1.5 2
-0.01
0
0.01
Signal-2
time [s]
0 1000 2000 3000
-100
-50
0
dB
frequency [Hz]
0 0.5 1 1.5 2
-0.01
0
0.01
Signal-3
time [s]
0 1000 2000 3000
-100
-50
0
dB
frequency [Hz]
0 0.5 1 1.5 2
-0.02
0
0.02
Signal
Signal-1
time [s]
0 1000 2000 3000
-100
-50
0
Signal spectrum
dB
frequency [Hz]
0 0.5 1 1.5 2
-0.02
0
0.02
Signal-2
time [s]
0 1000 2000 3000
-100
-50
0
dB
frequency [Hz]
0 0.5 1 1.5 2
-0.02
0
0.02
Signal-3
time [s]
0 1000 2000 3000
-100
-50
0
dB
frequency [Hz]
video camera is directed in such a direction, from
where has been arrived the signal having the most
important priority (emergency, alarm and warning).
2 SENSORS AND SIGNALS
In this work are tested the signal generated by
sensors of several companies SONITRON, E2S and
SYSTEM SENSOR (Behar, 2010). Two main signal
parameters of such sensors are the sound power and
the sound frequency (Table 1).
Table 1: Sensors parameters
Company
Sound
power
[dB]
Sound
frequency
[Hz]
SONITRON 96 2500
E2S 100 1000
SYSTEM SENSOR 103 2400
Depending on the non-normal situation the
sensors emit different sound signals (continuous,
intermittent) with the parameters given in Table2.
Table 2: Signal parameters
Sensor signals
Continuous
(warning)
Intermittent-I
(alarm)
Intermittent-II
(emergency)
f
int
= 0 Hz
T
sig
= 10 s
f
int
= 5 Hz
T
sig
= 30 s
f
int
= 1 Hz
T
sig
= 60 s
The security sensors, using the mounted sirens,
that generate special beeps, warn on abnormal
situations that arise in the protected space,
“warning”, “alarm” and “danger”. The sound signal
“Warning” is a continuous harmonic sound signal
with duration of 10s. The signal “Alarm” is an
intermittent signal with the frequency of interruption
of 5 Hz and duration of 30s (type-I). The different
devices generate various sound signals of type
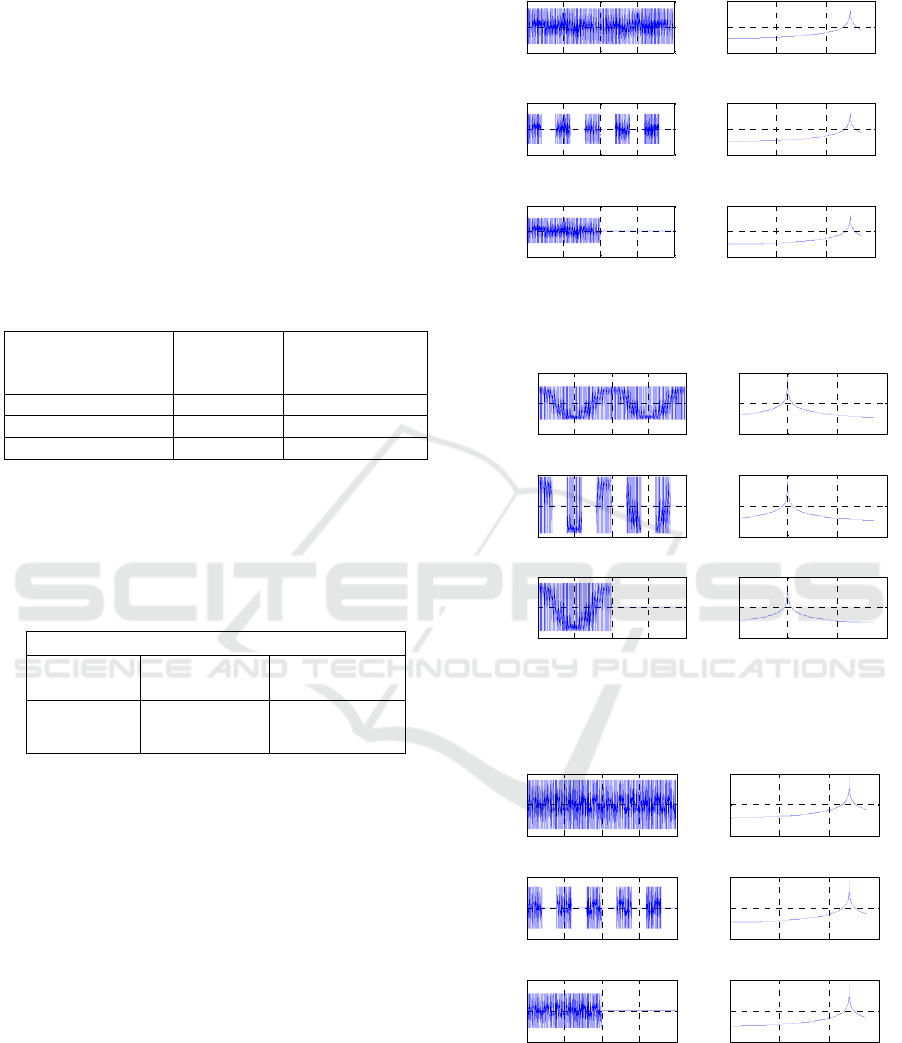
“alarms”. In figures 1-3 (on the left), are shown the
sound signals of type “warning”, “alarm” and
“danger”. On the same figures (on the right) are
presented their frequency spectra. The plotted sound
signals are generated by the sensors of the well-
known companies SONITRON, E2S and SYSTEM
SENSOR.
Figure 1: SoniTron signals and spectrums
Figure 2: E2S signals and spectrums
Figure 3: System signals and spectrums
Sound Parameter Estimation in a Security System
141

3 SIGNAL PROCESSING
Many sensors for fire detection or building
surveillance are equipped with sound alarm devices.
In case of alarm event (smoke, flame, intrusion,
glass breaking, and unauthorized car opening) the
alarm device emits powerful sound signal with
various duration. For the sake of simplicity, let’s
assume that a set of sensors and one microphone
array are installed for the object protection in the
observation area and a video camera can be located
above a microphone array (Fig.4).
Other sound
source Sensor B
Sensor C
Sensor A R
B
R
C
R
A
α
B
α
A
α
C
Microphone array (video camera)
Figure 4: The security system topology
In a security system, the sound direction
localization could be used for pointing the additional
video surveillance devices (video cameras), which
record the additional information and send it to
control center of a security system. The priority
direction for pointing of a video camera is estimated
on the base of a parameter analysis of the signals
received from the detected sound sources. The
general block-scheme of signal processing in a
security system is shown in Fig.5.
x
1
.
.
.
x
M
DOA
Estimation
Parameter
Estimation
Priority
Estimation
Analysis
Video
Camera
Control
Figure 5: Signal processing in a security system
We assume that the adaptive beam pattern
thresholding (CFAR) is performed and, finally, the
direction of-arrival (DOA) estimates are found as
directions where the local maximum exceeds an
adaptive threshold.
The block-scheme for sound parameters
estimation is shown on Fig. 6. The duration of the
sound pulse is obtained after comparing the
envelope of the signal with a threshold that is 80%
of the average envelope. The estimation of the
carrier frequency of the sound signal is received
again compared with a threshold value of -10 dB
(Fig. 6).
Figure 6: The block-scheme of sound parameters
estimation
4 SIMULATION RESULTS
The computer simulation is performed in order to
demonstrate the capability of the presented
algorithm to estimate sound parameters. The
scenario of simulation includes three sensors (A, B
and C) located respectively at a distance of 50m,
60m and 70m from the microphone array (Fig. 4).
The bandwidth of the used microphones is [100 -
5000] Hz. During the experiment, we simulated the
sound of a car, which is a broadband noise signal,
filling the entire bandwidth of the microphones.
Power of the sound signal generated by a car is
110dB. In the scenario of simulation, the azimuth of
a car is zero relative to the microphone array and the
car is located at 90 m from the microphone array
(Fig.4).
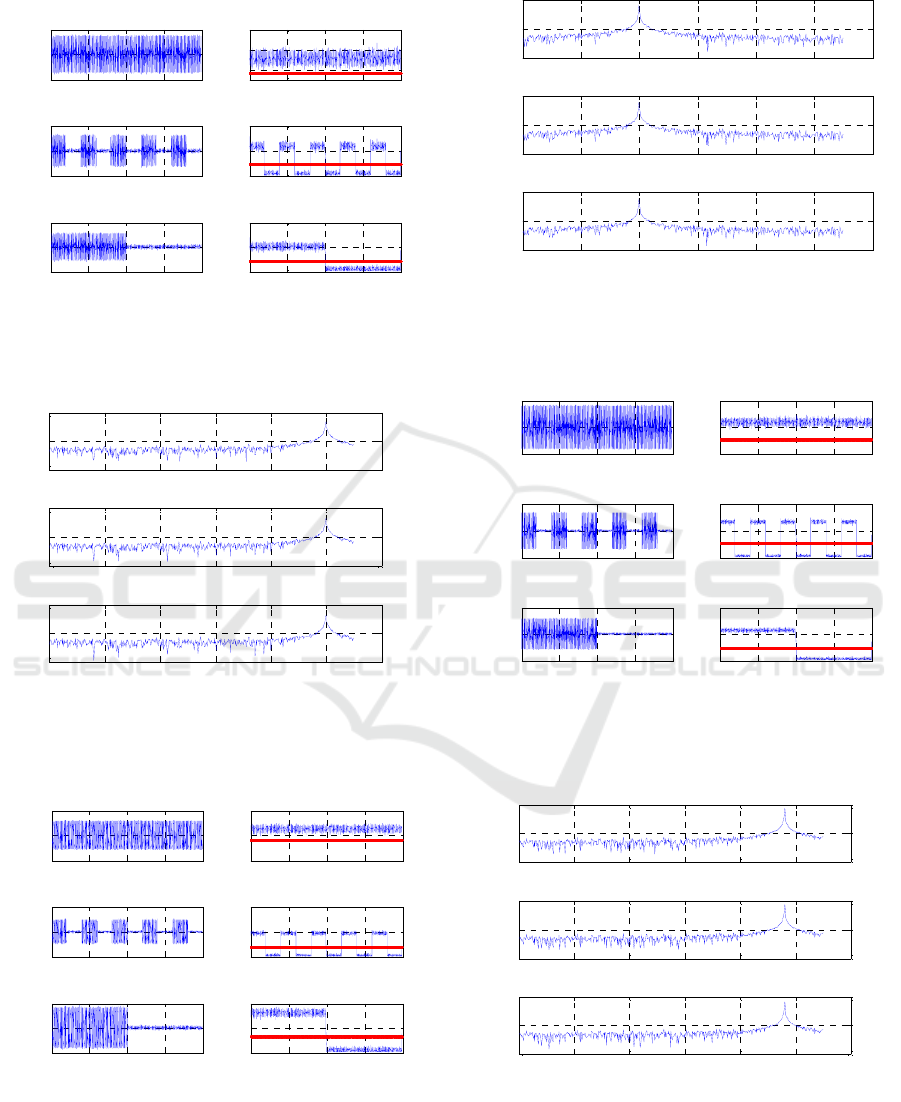
In Fig. 7, 9 and 11 are shown the sound signals
of type “warning”, “alarm” and “danger” together
with the corresponding thresholds of detection.
These signals are generated by sensors manufactured
by the well-known companies SONITRON, E2S and
SYSTEM SENSOR.
In Fig 8, 10 and 12 are presented the
corresponding frequency spectra of these signals.
DOA
Pulse
Duration
Estimation
Envelope
FFT
Frequency
Estimation
80% mean
(Env)
-10 dB
Second International Conference on Telecommunications and Remote Sensing
142
0 0.5 1 1.5 2
-0.01
0
0.01
Signal and noise
time [s]
Signal-1
0 0.5 1 1.5 2
6
8
10
x 10
-3
Envelope and threshold
time [s]
0 0.5 1 1.5 2
-0.01
0
0.01
Signal and noise
time [s]
Signal-2
0 0.5 1 1.5 2
0
0.005
0.01
Envelope and threshold
time [s]
0 0.5 1 1.5 2
-0.01
0
0.01
Signal and noise
time [s]
Signal-3
0 0.5 1 1.5 2
0
0.005
0.01
Envelope and threshold
time [s]
Figure 7: SoniTron signals and threshold
0 500 1000 1500 2000 2500 3000
-100
-50
0
Signal and noise spectrum
dB
frequency [Hz]
0 500 1000 1500 2000 2500 3000
-100
-50
0
dB
frequency [Hz]
0 500 1000 1500 2000 2500 3000
-100
-50
0
dB
frequency [Hz]
Figure 8: SoniTron signals spectrum
0 0.5 1 1.5 2
-0.02
0
0.02
Signal and noise
time [s]
Signal-1
0 0.5 1 1.5 2
0.005
0.01
0.015
Envelope and threshold
time [s]
0 0.5 1 1.5 2
-0.02
0
0.02
Signal and noise
time [s]
Signal-2
0 0.5 1 1.5 2
0
0.01
0.02
Envelope and threshold
time [s]
0 0.5 1 1.5 2
-0.01
0
0.01
Signal and noise
time [s]
Signal-3
0 0.5 1 1.5 2
0
0.005
0.01
Envelope and threshold
time [s]
Figure 9: E2S signals and threshold
0 500 1000 1500 2000 2500 3000
-100
-50
0
Signal and noise spectrum
dB
frequency [Hz]
0 500 1000 1500 2000 2500 3000
-100
-50
0
dB
frequency [Hz]
0 500 1000 1500 2000 2500 3000
-100
-50
0
dB
frequency [Hz]
Figure 10: E2S signals spectrum
0 0.5 1 1.5 2
-0.02
0
0.02
Signal and noise
time [s]
Signal-1
0 0.5 1 1.5 2
0.01
0.015
0.02
Envelope and threshold
time [s]
0 0.5 1 1.5 2
-0.02
0
0.02
Signal and noise
time [s]
Signal-2
0 0.5 1 1.5 2
0
0.01
0.02
Envelope and threshold
time [s]
0 0.5 1 1.5 2
-0.02
0
0.02
Signal and noise
time [s]
Signal-3
0 0.5 1 1.5 2
0
0.01
0.02
Envelope and threshold
time [s]
Figure 11: System Sensor signals and threshold
0 500 1000 1500 2000 2500 3000
-100
-50
0
Signal and noise spectrum
dB
frequency [Hz]
0 500 1000 1500 2000 2500 3000
-100
-50
0
dB
frequency [Hz]
0 500 1000 1500 2000 2500 3000
-100
-50
0
dB
frequency [Hz]
Figure 12: System Sensor signals spectrum
Sound Parameter Estimation in a Security System
143
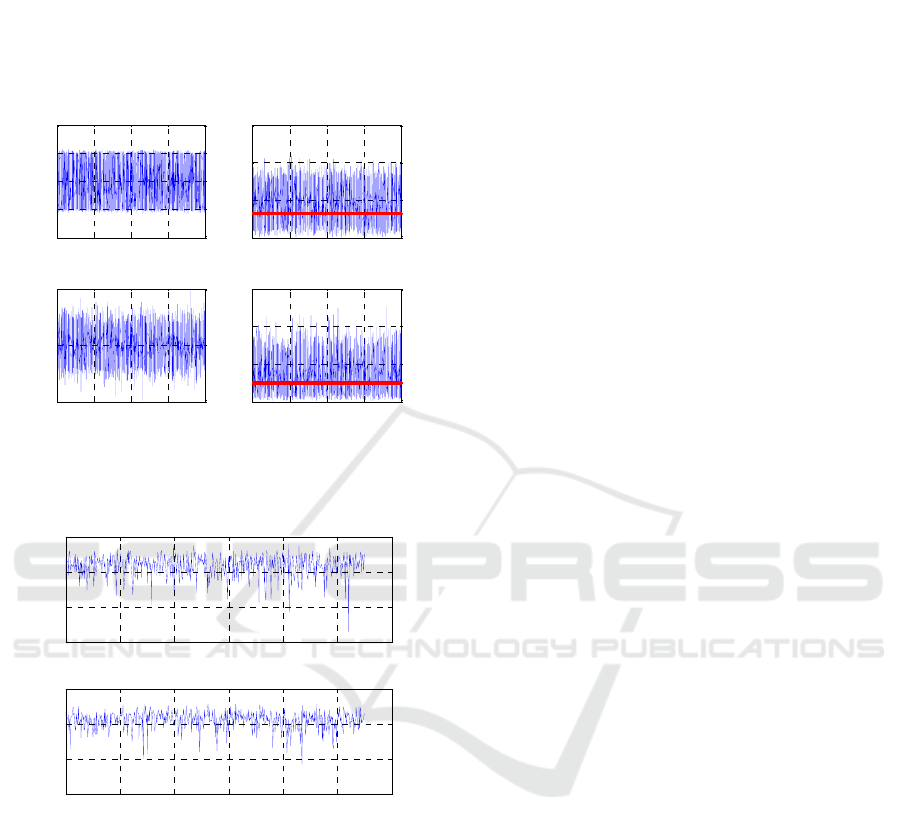
In Fig.13 are shown the broadband interference
signal generated by a car and the internal noise of a
microphone noise of the microphone array. In Fig.14
are presented the corresponding frequency spectra of
these signals.
0 0.5 1 1.5 2
-0.04
-0.02
0
0.02
0.04
Interference and noise
time [s]
0 0.5 1 1.5
2
0
0.02
0.04
0.06
Envelope and threshold
time [s]
0 0.5 1 1.5 2
-5
0
5
x 10
-3
Noise
time [s]
0 0.5 1 1.5
2
0
2
4
6
x 10
-3
Envelope and threshold
time [s]
Figure 13: Interference and noise
0 500 1000 1500 2000 2500 300
0
-80
-60
-40
-20
Interference and noise spectrum
dB
frequency [Hz]
0 500 1000 1500 2000 2500 300
0
-100
-80
-60
-40
Noise spectrum
dB
frequency [Hz]
Figure 14: Interference and noise spectrum
The results obtained demonstrate that the signals
from different sensors can be estimated and there
parameters are equal to real sensors parameters. The
presence of interference and noise does not affect
significantly the estimation of signal parameters.
5 CONCLUSIONS
It is shown that the obtained estimates of the sound
signal parameters are close to the actual parameters
of the signals. The algorithm presented enables to
recognize the type of abnormal situations arisen in
the area of observation in order to be taken the
corresponding solutions for control of the security
system. Thanks to the adaptive microphone array
processing, the presence of interference signals does
not influence significantly the determination of the
signal parameter estimates.
ACKNOWLEDGEMENTS
The research work reported in the paper is partly
supported by the project AComIn "Advanced
Computing for Innovation", grant 316087, funded by
the FP7 Capacity Programme (Research Potential of
Convergence Regions).
REFERENCES
Benesty, J., Chen, J., Huang, Y., 2008. Microphone array
signal processing, Springer.
Godara, L., 1997. Application of antenna arrays to mobile
communications, part II: beam-forming and direction-
of-arrival considerations. In Proc. of the IEEE, vol.85,
No 8, pp.1195-1245.
Ioannides, P., Balanis, C., 2005. Uniform circular and
rectangular arrays for adaptive beamforming
applications. IEEE Trans. on Antenna. Wireless
Propagation. Letters, vol.4., pp. 351-354.
Trees, H., Van, L., 2002. Optimum Array Processing. Part
IV. Detection, Estimation, and Modulation Theory.
New York, JohnWiley and Sons, Inc..
Tummonery, L., Proudler, I., Farina, A., McWhirter, J.,
1994. QRD-based MVDR algorithm for adaptive
multi-pulse antenna array signal processing. In Proc.
Radar, Sonar, Navigation, vol.141, No 2, pp. 93-102.
Vouras, P., Freburger, B., 2008. Application of adaptive
beamforming techniques to HF radar. In Proc. IEEE
conf. RADAR’08, May, pp. 6.
Behar V., Kabakchiev, Chr, Kyovtorov, V., 2010. STAP
Approach for DOA Estimation using Microphone
Arrays, Signal Processing Workshop, SPW-2010, 14-
15 June 2010, Vilnius, Lithuania, SPIE Proceedings,
vol. 7745, 77451J
Second International Conference on Telecommunications and Remote Sensing
144
