
A Case Study on Entropy Generation
during Business Process Execution
A Monte Carlo Simulation of the Custom Bikes Case
Peter De Bruyn, Philip Huysmans and Herwig Mannaert
Department of Management Information Systems, University of Antwerp, Prinsstraat 13, Antwerp, Belgium
{peter.debruyn, philip.huysmans, herwig.mannaert}@ua.ac.be
Keywords:
Business Process Design, Entropy, Monte Carlo Simulation, Normalized Systems, Cost Accounting.
Abstract:
Contemporary organizations require high-quality information to design and manage their business processes.
Important challenges in this context comprise (1) the decision regarding which information should be stored
and in what way, and (2) the need to allow adequate reporting for different organizational perspectives. To
tackle these issues, we proposed in previous work applying the concept of entropy as defined in statistical
thermodynamics to the domain of business process management. In this paper, we further elaborate on this
idea by performing a Monte Carlo simulation of the Custom Bikes case to show how guidelines are necessary
to control this entropy. In doing so, we extend previous theoretical contributions by releasing some simplifying
assumptions made earlier, while simultaneously proving its practical relevance in a case. Finally, this paper
discusses the important challenge for the need of adequate reporting from different organizational perspectives.
1 INTRODUCTION
Contemporary organizations require high-quality in-
formation to design and manage their business pro-
cesses. Recently, approaches for gathering and stor-
ing large amounts of data have improvedsignificantly.
For example, Radio Frequency Identification (RFID)
allows to systematically collect data at predefined lo-
cations. This data can be stored in “data warehouses”,
which can manage large amounts of data. However,
arbitrary data gathering and storage is not sufficient.
For example, the current interest in “Big Data” indi-
cates that many organizations have issues to extract
relevant information from the data available. Impor-
tant challenges in this context comprise (1) the de-
cision regarding which information should be stored
and in what way, and (2) the need to allow ade-
quate reporting for different organizational perspec-
tives (e.g., management versus operational versus ac-
counting purposes).
While many different approaches and tools are
suggested to handle these issues in practice (e.g., busi-
ness intelligence tools), a theoretical understanding of
its complexity is often lacking. Such a lack obstructs
the systematic research and development of methods
to address this issue in a scientific way, as proposed
by, for example, the Design Science methodology
(Hevner et al., 2004). Therefore, we previously in-
troduced entropy as a possible candidate for studying
the structure of data generated in business processes
(De Bruyn et al., 2012; Oorts et al., 2012). Within the
BMSD community, other engineering concepts such
as the concept of homeostasis have been suggested as
well (Regev et al., 2012). This fits within the Enter-
prise Engineering paradigm, which states that orga-
nizations should be purposefully designed, and that
engineering knowledge can be used to better under-
stand organizational phenomena or design organiza-
tional artifacts. Baring this in mind, we earlier intro-
duced a set of general prescriptive design guidelines
which can be derived from the application of entropy
to the design of business processes, resulting in a fine-
grained modular structure (De Bruyn et al., 2013).
In this paper, we further elaborate on this idea
by demonstrating these guidelines in a realistic case
study. This implies abandoning some of the simpli-
fications made in previous work (e.g., considering a
single process flow). Moreover,this approach enables
more realistic insights regarding which information
should be stored (and how), as well as the impact of
integrating multiple design perspectives. We employ
a case study of which fine-grained business processes
have been published previously (Van Nuffel, 2011).
First, we generate a realistic data set for the processes.
Next, we illustrate how violations against our design
principles (to ensure an adequate modularization of
187
De Bruyn P., Huysmans P. and Mannaert H.
A Case Study on Entropy Generation during Business Process ExecutionA Monte Carlo Simulation of the Custom Bikes Case.
DOI: 10.5220/0004775301870197
In Proceedings of the Third International Symposium on Business Modeling and Software Design (BMSD 2013), pages 187-197
ISBN: 978-989-8565-56-3
Copyright
c
2013 by SCITEPRESS – Science and Technology Publications, Lda. All rights reserved

the registered data) result in an increase of entropy
during execution-time (thereby demonstrating theo-
retic relevance), resulting in a loss of certain organi-
zational insights (demonstrating practical relevance).
In the remainder of this paper, we first explain our
proposed application of the entropy concept to busi-
ness processes (Section 2). Next, we introduce the
case study (Section 3) and the data generation and set-
up (Section 4). Section 5 covers a discussion of our
findings and the implications for research and prac-
tice. Finally, we offer our conclusions in Section 6.
2 ENTROPY GENERATION
DURING BUSINESS PROCESS
EXECUTION
Entropy as expressed in the second law of thermody-
namics is considered to be a fundamental principle
in traditional engineering sciences. While many ver-
sions exist, all approaches have basically the intent
of expressing the (increasing) amount of complexity,
uncertainty (i.e., lack of information) and tendency of
particles to interact (i.e., couple) within a system. In
this paper, we use the statistical thermodynamics per-
spective towards entropy. Here, entropy was defined
as proportional to the number of possible microstates
(i.e., the whole of microscopic properties of the parti-
cles of a system) consistent with a single macrostate
(i.e., the whole of externally observable and measur-
able properties of a system) (Boltzmann, 1995). The
amount of microstate configurations which result in
the same macrostate is called the multiplicity of that
macrostate. A common way of dealing with entropy,
is to increase the structure or the knowledge of the
internals of the system. Structure can be used to con-
trol entropy by allowing less interaction between the
constituting components before the information is ob-
served. This way, as fewer microstate configurations
remain consistent with a single macrostate, less un-
certainty remains. The mechanisms related to en-
tropy reasoning have found their reflection in many
domains, including business and management topics
(Jacquemin and Berry, 1979). Even for the business
process management domain, some contributions can
be found (Jung et al., 2011).
As our application of entropy to business pro-
cesses has been discussed in detail in previous pub-
lications (De Bruyn et al., 2012; Oorts et al., 2012;
De Bruyn et al., 2013), we only recall our reason-
ing here briefly. First, the run-time instantiation space
of a business process needs to be defined (De Bruyn
et al., 2013). The modular structure of a business
process has been defined to consist of process mod-
ules and task modules (Van Nuffel, 2011). Therefore,
the design of a business process (such as the
Order
Handling
process in Figure 1) and its constituting
tasks need to be defined (e.g., we used BP
1
for a busi-
ness process and t
1
for a task). Moreover, the run-time
instantiation space requires the identification of each
instantiation of the business (e.g., instantiation BP
1,1
process and its tasks). Therefore, a possible business
process instantiation space might be:
BP
1,1
= {t
1,1
, t
2,1
, t
3,1
, t
5,1
}
BP
1,2
= {t
1,2
, t
2,2
, t
4,1
, t
5,2
}
BP
1,3
= {t
1,3
, t
2,3
, t
3,2
, t
5,3
}
Second, the interpretation of microstates and
macrostates has been elaborated upon (De Bruyn
et al., 2012). A microstate of a process is the union of
values of properties for each individual process par-
ticle (i.e., a task instantiation). A macrostate refers
to the observable information of the process as a
whole (e.g., throughput time or quality measures).
Third, a set of aggregation dimensions has been pro-
posed, which indicate how the multiplicity of a busi-
ness process macrostate increases when information
of the task instantiations is aggregated. Fourth, four
principles have been discussed to structure the task
information: (1) Separation of States (SoS): states
should be introduced as measuring points through-
out a process; (2) Separation of Concerns (SoC): a
unique state should be introduced for separating infor-
mation regarding each individual relevant information
unit or concern; (3) Data instance Traceability (DiT):
each business process and task instance should be
linked to its information input and the information ob-
ject (specifics) it is operating on; (4) Action instance
Traceability (AiT): each task instantiation should be
linked to the specific business process instantiation
it is embedded in. Principles 1 and 2 relate to the
Normalized Systems (NS) principles (Mannaert et al.,
2011) at design-time. In contrast, principles 3 and 4
can only be applied in the run-time instantiation space
(Mannaert et al., 2012). While a conceptual example
was already discussed (De Bruyn et al., 2013), a call
was made for the application of the entropy concept to
a more realistic case, which will be part of the present
paper.
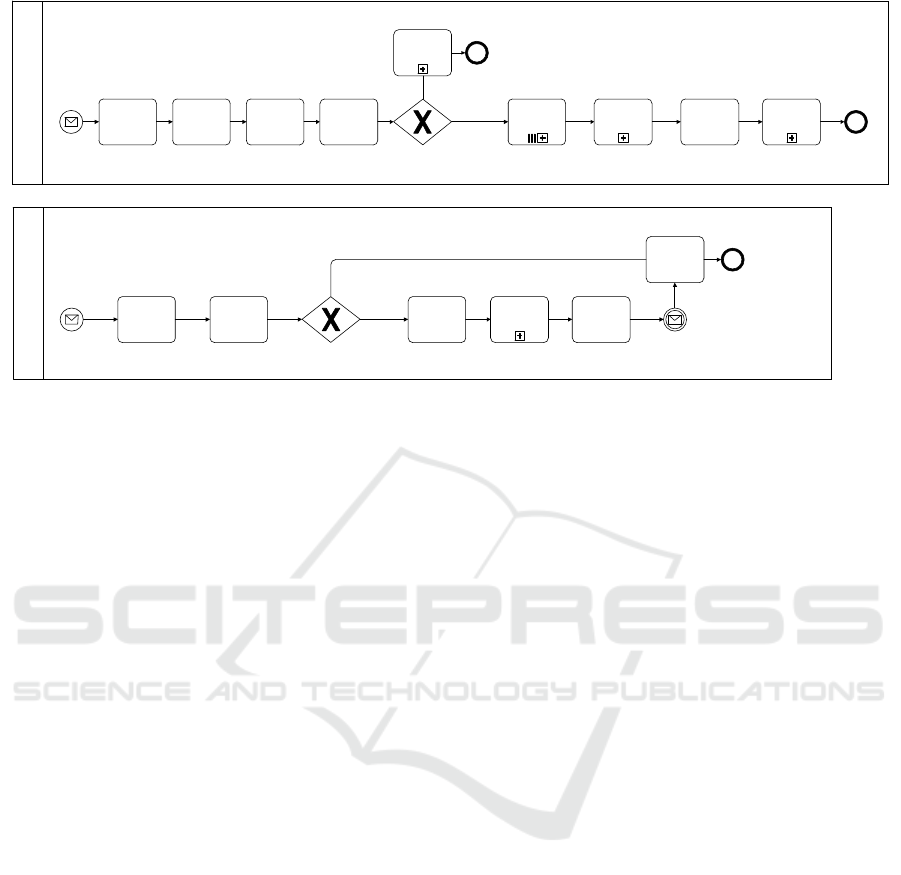
3 CASE DESCRIPTION
The “Custom Bikes case” used in this paper has orig-
inally been introduced by Van Nuffel (2011) and de-
scribes the business processes of a small company
producing customized bicycles. In order to adapt the
Third International Symposium on Business Modeling and Software Design
188
KƌĚĞƌ,ĂŶĚůŝŶŐWƌŽĐĞƐƐ
WĂƌƚWƌŽĐĞƐƐ
͘͘͘
ZĞŐŝƐƚĞƌ
KƌĚĞƌ
͘͘͘
ǀĂůƵĂƚĞ
KƌĚĞƌ
^ĞŶĚZĞũĞĐƚ
EŽƚŝĨŝĐĂƚŝŽŶ
ƌĞũĞĐƚĞĚ
ƐƐĞŵďůLJ
ƉƌŽĐĞƐ
͘͘͘
/ŶǀŽŝĐĞ
WƌŽĐĞƐƐ
ZĞƚƌŝĞǀĞ
YƵĂŶƚŝƚLJŽŶ
,ĂŶĚ
ĞƚĞƌŵŝŶĞ
ǀĂŝůĂďŝůŝƚLJ
ZĞƐĞƌǀĞƉĂƌƚǀĂŝůĂďůĞ
YƵŽƚŝŶŐ WƌŽĐƵƌĞWĂƌƚ
WĂƌƚWƌŽĐĞƐƐĐĐĞƉƚĞĚ
ƌĂĨƚWĂƌƚ
ZĞƋƵŝƌĞͲ
ŵĞŶƚƐ
EŽƚ
ǀĂŝůĂďůĞ
KƌĚĞƌ
ƌĞĐĞŝǀĞĚ
ZĞũĞĐƚĞĚ
&ŝŶŝƐŚĞĚ
WĂƌƚ
ZĞƋƵĞƐƚĞĚ
ZĞƐĞƌǀĞĚ
WĂƌƚZĞĐĞŝǀĞĚ
Figure 1: BPMN representations of the business process types
Order Handling
and
Part
.
complexity of the case to the available page limit, we
focus on the
Order Handling Process
. Further, a
set of assumptions were made to limit the complexity
added in the run-time analysis (see Table 1). The pro-
cess, depicted in Figure 1, describes the receipt of an
order, which triggers some administrative processes
or tasks (i.e., the first three tasks). Next, the order is
evaluated and, if it is accepted, the parts for the order
are reserved. Since a part is a differentconcern (i.e., it
is located on a different aggregation level(Van Nuffel,
2011, p. 199)), it is represented in a different busi-
ness process, i.e., the
Part Process
. For every part
which is requested, the stock availability is checked.
If a part is available, it is reserved immediately. Oth-
erwise, quotes are requested from different suppliers,
and the part is ordered from of the suppliers. When
the part is received, it is reserved as well. As soon
as all the parts are reserved, the bicycle is assembled,
and an invoice is sent.
Our case selection was primarily motivated by
the fact that these business processes already exhibit
a highly fine-grained modular structure, designed to
prevent the occurrence of combinatorial effects. Such
effects are defined as the need to adapt multiple pro-
cesses when a single change is required. For ex-
ample, if the
Part Process
would be included in
the
Order Handling Process
, other processes re-
quiring parts (such as a
Repair Service Process
)
would need to include these process steps as well.
Consequently, a change to the
Part Process
(e.g.,
adding a task) would need to be applied in two differ-
ent processes. The elimination of combinatorial ef-
fects has been shown to be a prerequisite to achieve
systems theoretic stability (Mannaert et al., 2011).
Further, it has been shown that the fine-grained mod-
ular structures needed to obtain stability in the design,
also tend to reduce entropy at run-time (Mannaert and
Verelst, 2009). Therefore, while the run-time perspec-
tive of entropy might require the application of ad-
ditional principles, we hypothesize that the modular
business process design as proposed by Van Nuffel
already exhibits a low amount of entropy and consti-
tutes a good starting point for our case study on en-
tropy occurrence during business process execution.
4 SIMULATION SET-UP
In order to demonstrate entropy-related benefits when
adopting normalized business processes (i.e., exhibit-
ing stability and low entropy), a set of already nor-
malized business processes should be started from.
However, to our knowledge, no organizations seem to
employ fully normalized business processes. There-
fore, we chose to perform a simulation of the de-
scribed artificial case study as they were already nor-
malized in earlier work based on the concept of sta-
bility (Van Nuffel, 2011). In terms of data and pro-
cess simulation method, a Monte Carlo experiment
was conducted. Such method generally consists of
a certain type of computational algorithm, employ-
ing a (high volume) repeated random sampling with
the aim to obtain numerical data to mimic, for in-
stance, the probabilities of certain real-life processes.
The use of Monte Carlo experiments in the context of
business processes can be noted in literature as well
(Tumay, 1996). Typically, the Monte Carlo method
is adopted to solve mathematical or operational prob-
lems for which no straightforward analytical solutions
are within reach. While the Monte Carlo method is
A Case Study on Entropy Generation during Business Process Execution - A Monte Carlo Simulation of the Custom Bikes
Case
189

Table 1: Case assumptions.
1. A part represents the most atomic unit for assembling a bike (i.e., no “sub-assemblies” exist).
2. Each bike consists out of three part types (i.e., wheels, chain wheel and frame).
3. The case organization has a fixed supplier who delivers once in a month a limited set of the most frequently used parts.
However, as the organization is specialized in delivering highly-customized bikes, it frequently occurs that this monthly-based
inventory appears to be insufficient or that the part is so rarely used that it is not included in the monthly inventory fill-up.
When a part type is not available in stock, a quoting process takes place, in which a number of possible suppliers is asked to
make a quotation for delivering the considered part. The best supplier (based on a rather complex and human-based decision)
is chosen, after which a procurement order is placed.
4. For every part which is decided to be procured externally, at least one supplier will be available.
5. In case multiple parts are ordered from the same supplier, the same delivery duration for all parts is assumed.
6. A theoretically infinite amount of concurrent production capacity is assumed. Hence, no bottlenecks due to lacking manu-
facturing resources (i.e., place, personnel, etcetera) can occur.
7. No measuring errors are taken into account. Hence, all recorded data and possible extreme values are deemed to be correct.
8. Only accepted order instantiations are considered (i.e., only positively evaluated orders are considered in our data analysis),
this means that task 3 (i.e., “Send Reject Notification”) is typically not executed.
perfectly suited to generate samples of complex prob-
ability distributions, we chose to generate our data
primarily for variables assumed to be normally dis-
tributed, as this distribution seems both sufficient to
illustrate our entropy reasoning adequately and rather
realistic when analyzing aspects like throughput time
or costs related to (tasks of) a business process.
We will now successively discuss which parame-
ters were used as an input for the generation of the
data in the experiment (i.e., the “preprocessing”), the
different simulation scenarios which were set-up to be
able to demonstrate and analyze our entropy approach
(i.e., the “simulation”) and some overall observa-
tions regarding the eventually generated data (i.e., the
“postprocessing”). The actual discussion and analysis
of our findings will be described in Section 5.
4.1 Preprocessing
As stated earlier, we primarily assumed normally
distributed variables to generate data reflecting the
throughput time and costs associated with each
task instantiation in an instantiated business process.
Hence, for each of the task types we determined a
population mean for its throughput time variable, as
well as a standard deviation and an absolute minimum
(to prevent throughput times from becoming negative
in extreme cases). Consequently, for the task types
“Register Order”, “Evaluate Order”, “Retrieve Quan-
tity on Hand”, “Determine Availability”, “Draft Part
Requirements”, “Quoting”, “Procure Part”, “Reserve
Part”, “Assembly Process” and “Invoice Process”, the
mean, standard deviation and absolute minimum are
depicted in Table 2. For all these tasks, except “As-
sembly Process”, we assumed that the costs are pro-
portional to the duration of the activity (as these tasks
are solely relying on human activities). In such case,
the cost (expressed in euro) was equal to 30 times
the duration (expressed in number of individual man
days). For the tasks “Receive Part” and “Assembly
Process”, we modeled our simulation in such way that
costs were based on a distinct normal distribution as
they were assumed to be equal to the purchasing costs
(for “Receive Part”) or related to other resources than
pure manpower such as machinery (for “Assembly
Process”).
Further, in case a part should be ordered from a
supplier, the decision regarding which supplier would
be chosen was considered to be based on a rather com-
plex and purely human decision (cf. Table 1), and the
choice was hence modeled to be evenly distributed
among all suppliers (i.e., each having a 20% chance
for each procurement instance of a part type). We
can see that each supplier has its own mean deliv-
ery time and standard deviation. One can further no-
tice that, while the mean delivery time of supplier
5 is not spectacularly higher than that of the other
suppliers, its standard deviation is. In practical busi-
ness terms, this means that this supplier is the most
unreliable one based on its delivery policy. Clearly,
organizations aiming to offer their products or ser-
vices quickly,need to havereliable and fast-delivering
suppliers. Hence, for our considered bike producing
company,this is deemed to be a problematic situation.
The underlying question which we ask ourselves dur-
ing the analysis of the case study is: to which degree
can this problematic situation be observed and traced
in different possible business process designs?
In summary, the parameters as depicted in Table 2
served as input variables to generate a number of sim-
ulations, discussed in the next subsection.
4.2 Simulation Scenarios
In order to simulate the processes as depicted in Fig-
ure 1, a number of n = 100 process instantiations was
generated. Consequently, for each of the tasks t
1
, t
2
,
t
4
(being the result of tasks t
5
, t
6
, t
7
, t
8
, t
9
, t
10
and t
11
),
Third International Symposium on Business Modeling and Software Design
190

Table 2: Parameters used as input for the Monte Carlo simulation.
task duration (man days) cost (e)
mean st. deviation minimum mean st. deviation min
Register Order (t
1
) 0.0625 0.0125 0.00625 ∼ time
Evaluate Order (t
2
)
0.1250 0.0420 0.0125 ∼ time
Send Reject Notification (t
3
)
not relevant not relevant
Part Process (t
4
)
depends on tasks 5 till 11 depends on tasks 5 till 11
Retrieve Quantity on Hand (t
5
)
0.0500 0.0100 0.0050 ∼ time
Determine Availability (t
6
)
0.0500 0.0100 0.0050 ∼ time
Draft Part Requirement (t
7
)
0.2500 0.0950 0.025 ∼ time
Quoting (t
8
)
2.5000 0.4000 0.2500 ∼ time
Procure Part (t
9
)
0.2500 0.0800 0.1000 ∼ time
Receive Part (t
10
)
depends on supplier chosen 250 40 15
Reserve Part (t
11
)
0.0500 0.0100 0.0005 ∼ time
Assembly Process (t
12
)
0.5000 0.2000 0.0050 250 50 50
Invoice Process (t
13
)
0.1250 0.0420 0.00125 ∼ time
Delivery time supplier 1 3 0.3 0.3
Delivery time supplier 2
2.8 0.3 0.28
Delivery time supplier 3
2.6 0.4 0.26
Delivery time supplier 4
3.2 0.4 0.32
Delivery time supplier 5
3.6 4 0.36
t
12
and t
13
, a task instance duration and associated
cost had to be generated for each process instantia-
tion. This was done by associating a random number
x ∈ [0, 1] with each of these task instantiations. Next,
for each of these instances, the value z
t
was calculated
for which there is a probability of x in the normal dis-
tribution of the considered task t that a lower value is
generated, so that for instance: P(cost(t
1
) ≤ z
t
) = x.
Hence, by using this procedure, for each of the task
instantiations, a cost and throughput value is assigned
based on a random sampling from their normal distri-
bution. Also for supplier selection, a random number
x ∈ [0, 1] was generated. Based on this value, sup-
plier 1 was assigned if x ∈ [0;0, 25], supplier 2 was
assigned if x ∈ ]0, 25;0, 50], etcetera.
Based on these cost and throughputvalues per task
instance, a set of performance variables could eas-
ily be calculated, such as total cost price of a prod-
uct instance, total throughput time for a product in-
stance, mean cost price of a certain product type,
mean throughput time of a certain product type, mean
throughput time of a certain task type, etcetera. Three
different case study scenarios were considered based
on this initial simulation. Each time, the same set of
randomly generated “basis” data was used. However,
some different aggregations were performed in each
of the case scenarios (cf. infra), implying a different
degree of detail or granularity regarding their result-
ing variables/indicators and hence, as we will show,
entropy. Each of these aggregations was based on
one of the aggregation dimensions we proposed in
De Bruyn et al. (2013), in which we illustrated the
business relevance of each of them. Afterwards, for
each of the considered case study scenarios, the nec-
essary performance variables could be easily calcu-
lated by summing the respective task (instances). We
will now highlight each of these case study scenarios:
Scenario 1. This scenario represents the most fine-
grained variant of our case study and the regis-
tered information exactly mimics the granularity
as represented in Figure 1, applying the guidelines
as proposed in the work of Van Nuffel (2011).
Hence, no summation on top of these fine grained
tasks or their instances is made. Also, informa-
tion regarding the data used for each task instan-
tiation as well as the business process instance to
which it belongs, is persisted. Consequently, no
entropy should be able to occur as each of the
NS entropy principles is adhered to. This scenario
corresponds to an example of aggregation dimen-
sion 1 in De Bruyn et al. (2013).
Scenario 2. In this scenario two activities within the
Part Process
are combined (“Procure Part” and
“Part Received”) into a new task labeled t
19
. This
means that, for each process instance, no sepa-
rate state is kept between the execution of these
steps and, hence, no independent information on
the execution of these both tasks is available for
the observer. This scenario corresponds to an ex-
ample of aggregation dimension 2 in De Bruyn
et al. (2013). However, as this might cause in-
formation loss regarding two (arguably) relevant
parts in the process, this scenario is expected to
create a certain degree of entropy due to SoS and
SoC violations.
Scenario 3. In this scenario, the data regarding the
Part Process
execution does not include in-
stance specific information such as: for which
A Case Study on Entropy Generation during Business Process Execution - A Monte Carlo Simulation of the Custom Bikes
Case
191

Order Handling Process
instance was a par-
ticular
Part Process
instance carried out? Was
the
Part Process
instance aimed at providing
the wheels, frame or chain wheel? In case the
Part was externally procured, which supplier was
chosen to do so? In other words, information re-
garding the execution of each of the specific tasks
in the business process flow is mainly available
“at bulk” without any reference to the specifics
of each individual instance. This scenario corre-
sponds to an example of aggregation dimension 4
in De Bruyn et al. (2013). However, as this might
cause information loss regarding (arguably) rele-
vant information in the process, this scenario is
expected to create a certain degree of entropy due
to AiT and DiT violations.
4.3 Postprocessing
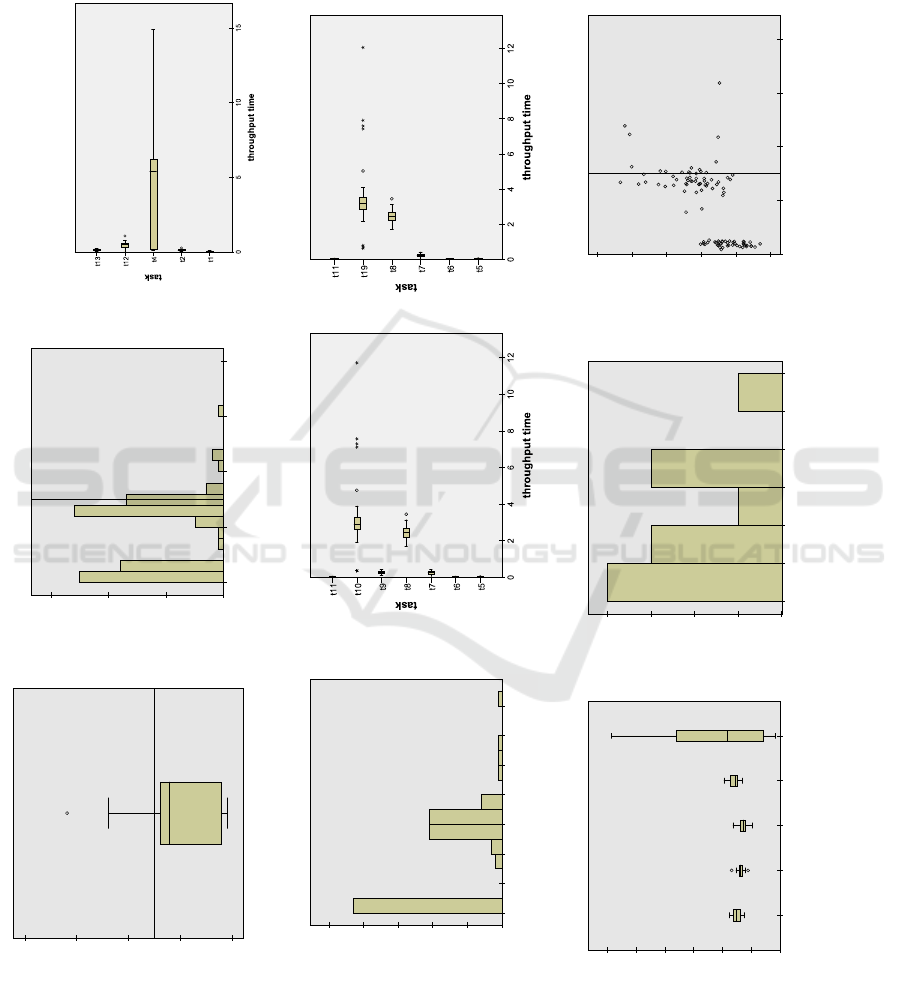
Some descriptive statistics of the generated data can
be found in Figure 2. Obviously,these data and gener-
ated sample distributions highly approximate the pop-
ulation distributions as set out in Section 4.1. How-
ever, while this might initially occur to the reader as
a circular reasoning, the whole point of our reasoning
is exactly the fact that the observer in a realistic case
is not aware of the actual population distributions and
should perform his analysis solely based on the infor-
mation registered during the execution of the business
process instantiations. This allows to mimic the situ-
ation in which, for instance, extreme cases (e.g., high
throughput or delivery time) or other problems (e.g.,
an unreliable supplier) are generated by the simula-
tion model and a business analyst is aiming to trace
(i.e., diagnose) the origin (i.e., microstate) of this ob-
served fact (i.e., the macrostate).
5 FINDINGS AND DISCUSSION
Let us assume that the manager of our simulated
bike selling company observes (macroscopically) that
too many deliveries of requested bike orders exceed
7.5 man days in order to be delivered. This can be
seen in Figure 2a en 2b, where a line is drawn at
this point. Indeed, the boxplot (a) is asymmetrical
and its upper whisker is rather long, indicating that
some outliers or extreme values are present. Also the
histogram (b) shows that at least 10 out of the 100
simulated bike order instantiations exceed this border
value. The manager considers this situation harmful,
as customers typically tend to file complaints starting
from this moment. Therefore, he wants to find out
what the cause of these extreme throughput values for
the
Order Handling Process
is. In Section 4.1, we
explained how we configured the parameters of our
simulation model in such way that the standard devi-
ation of the delivery time of supplier 5 is extremely
large, compared to the other four suppliers. In each
of the different case study scenarios, the process and
the possibility to fulfill the managers’ assignment to
locate this problem differ. We will consider each of
them consecutively.
5.1 Scenario 1: The Normalized Case
In scenario 1, all information depicted in Figure 2
(i.e., panels a till i) is (macroscopically) available for
the observer for solving his problem. Indeed, infor-
mation regarding all fine-grained tasks, as implied by
the application of the guidelines of Van Nuffel (2011),
and their instantiations is registered and available for
further inspection by the observer. First, panels a and
b indicate an asymmetric delivery time and a large
number of outliers or deliveries exceeding the desired
7.5 man days. For instance,
Order Handling
in-
stance 38 was indicated to have a delivery time of al-
most 15 man days.
In a next stage, the observer would logically opt
for splitting out the different tasks in the
Order
Handling Process
in order to dig down to the origin
of the observed problem. Here, panel c indicates that
task 4 —the “Part Process” (i.e., being the aggrega-
tion of the completion of the
Part Process
instances
needed to proceed with the “Assembly Process”
task)— not only represents the largest mean amount
of time for the whole
Order Handling Process
but
also, and probably more importantly, exhibits a very
large deviation. Indeed, the histogram of panel d
shows that a large amount of instances of task 4 has a
throughput time less than one man day (i.e., the cases
where all three parts are in stock). However, also a
relatively fair amount of instances require more than
6 man days to complete, implying a large chance that
the total delivery time will also exceed the target de-
livery time.
The next logical step would be to split up the
steps constituting the
Part Process
as is depicted in
panel e. One can see that primarily the tasks “Draft
Part Requirements” and “Receive Part” take some
time to be executed, but that the “Procure Part” task
has large deviations. Having identified the most fine-
grained task responsible for the extremely delayed
Order Handling Process
instances, a process de-
sign exhibiting (data) instance traceability would al-
low an even more detailed analysis showing the
throughput time for this task, categorized by the sup-
plier chosen when the a part is externally procured
Third International Symposium on Business Modeling and Software Design
192
38
total throughput time
20
15
10
5
0
order handling process
(a)
total throughput time
20151050
Frequency
30
20
10
0
(b) (c)
Part Process throughput time
14121086420
Frequency
50
40
30
20
10
0
(d) (e) (f)
supplier
54321
throughput time - receive part
12
10
8
6
4
2
0
(g)
supplier 5 - throughput time receive order
121086420
Frequency
4
3
2
1
0
(h)
total costs
1100
1000
900
800
700
600
total throughput time
20151050
(i)
Figure 2: Some descriptive statistics of the Custom Bikes case simulation.
A Case Study on Entropy Generation during Business Process Execution - A Monte Carlo Simulation of the Custom Bikes
Case
193

(i.e., panels g and h). It is only at this stage of the rea-
soning, that one is able to identify the root cause of the
problem introduced in our simulation model (i.e., the
unreliability of supplier 5 in terms of delivery time).
Consequently, both the observability and trace-
ability of the introduced problem are rather straight-
forward in this scenario. Indeed, in case supplier 5
would be removed from the part suppliers portfolio,
the extremely irregular delivery time would almost
completely disappear, solving the originally identified
problem. Hence, the multiplicity in this scenario is
1 (and entropy 0) as the macrostate (i.e., the identi-
fied problem of a set of extreme throughput times of
the
Order Handling
Process) can be unambiguously
related to one microstate (i.e., the configuration in
which one task and its instance data (such as supplier
chosen) can be attributed as causing the problematic
macrostate, the other tasks being normal). This can
be seen at two distinct levels: (1) at the type level
of processes and tasks (i.e., identifying the process
and task type responsible for the deviations in the ob-
served total throughput time) and (2) at the instance
level of processes and tasks (e.g., to trace the fact that
for
Order Handling
instance 38, 11.7 man days of
the total throughput time were spent while waiting
for the delivery of Part 3 for which supplier 5 was
chosen). Finally, from panel i, we can derive that fo-
cusing on the cost perspective would not have been
sufficient to correctly diagnose this delivery related
problem as many extreme deliveries have only low or
moderate registered costs (e.g., the costs for
Order
Handling
instance 38 only amounts to 747 e).
5.2 Scenario 2: Violation Regarding
SoS/SoC
Scenario 2 represents the scenario in which a viola-
tion towards the principles SoS and SoC is introduced
as information regarding two independent informa-
tion units are combined, i.e., the “Procurement Part”
and “Part Received” tasks. Consequently, the infor-
mation (macroscopically) available for the observer
is restricted to panels a, b, c, d, and f in Figure 2. The
problem analysis in this scenario will proceed analo-
gously to the procedure outlined for scenario 1, until
the point that the different constituting tasks of the
Part Process
are to be examined for their respec-
tive throughput times. However, at this stage, the ob-
server will not be able to differentiate between poten-
tial problems regarding the “Procure Part” task (e.g.,
do the people at the procurement department face dif-
ficulties for drafting and placing the orders, or do they
have a bottleneck making each procurement wait for
a certain amount of time before it can be placed?) or
“Part Received” task (e.g., are there any kind of prob-
lems related to the delivery itself?). That way, one
cannot be sure whether the problem is situated under
ones own responsibility (i.e., the procurement depart-
ment) or an external party (i.e., the supplier) and en-
tropy clearly increases. Indeed, while the observer
in this example is still able to be aware of a problem
regarding the overall throughput time of the
Order
Handling Process
(the macrostate), multiple (i.e.,
minimum 2) independent causes (i.e., tasks) can be
deemed to be at the origin of this phenomenon (i.e.,
both procurement or delivery). As a consequence, for
each
Part Process
instantiation, multiplicity equals
2, entropy rises and the traceability of the problem
decreases. Consequently, in a good business process
design, these information units should be separated
into distinct tasks to allow for the above mentioned
analyses. Interestingly, the “Actor Task Responsibil-
ity” guideline proposed by Van Nuffel (2011) would
already recommend this separation as the procuring
and the delivery of parts are carried out by different
actors, in this case even from different organizational
entities.
5.3 Scenario 3: Violation Regarding
DiT/AiT
Scenario 3 represents represents the scenario in which
a violation regarding the DiT and AiT principles is
introduced. Indeed, DiT requires that the relevant
data for executing a task is registered and related to
the relevant state, whereas AiT implies that the ex-
ecution of a task instance should be unambiguously
traceable to the business process it is embedded in.
This requirement is not met for the
Part Process
in this scenario. Consequently, in this scenario, the
information (macroscopically) available for the ob-
server is restricted to panels a, b, c, d, and e in Fig-
ure 2. The problem analysis in this scenario will
therefore proceed analogously to the procedure out-
lined for scenario 1, until the point that the “Receive
Part” task becomes identified as being responsible for
the extreme values regarding overall throughput times
of the
Order Handling Process
. However, at this
stage, the observer will not be able to differentiate
between possible problems related to the specifics of
the different suppliers. That way, the only conclu-
sion which can be drawn from this data is that some
problems regarding the delivery of parts are present.
Indeed, while the observer in this example is again
able to be aware of a problem regarding the overall
throughput time of the
Order Handling Process
(the macrostate), multiple (i.e., minimum 5) indepen-
dent causes (i.e., suppliers) can be deemed to be at the
Third International Symposium on Business Modeling and Software Design
194

origin of this phenomenon (i.e., is the problem sup-
plier specific and if so, which supplier?). As a conse-
quence, for each
Part Process
instantiation, multi-
plicity equals 5, entropy rises and the traceability of
the problem decreases. In a good business process
design, these information aspects (i.e., data) should
be traceable to their corresponding task instance ex-
ecutions to allow for the above mentioned analyses.
In fact, the “Aggregation Level” guideline proposed
by Van Nuffel (2011), would at least suggest to sepa-
rate the delivery of parts in a distinct business process
of which the instances are logically linked to their
“parent” business process instance. Additionally, we
would recommend to register for each task instantia-
tion the business process instance it belongs to as well
as the argument data it employed for triggering its ex-
ecution.
Finally, imagining the scenario in which “Part
Process” is only considered as one atomic tasks,
clearly constitutes an example of a violation of both
the SoS/SoC and DiT/AiT design principles, thereby
combining the difficulties of traceability discussed for
scenarios 2 and 3 and further increasing the degree
of entropy. Further, while in all three case scenarios,
the observability of a problematic situation was still
present, we showed in De Bruyn et al. (2013) that an
increase in entropy might also lead to a lower degree
of traceability. In our case example, this might be
showup in case we did not include one unreliable sup-
plier, but instead one supplier having a higher mean
delivery time compared to all other suppliers in the
supplier portfolio: this would lead to unnecessarily
high (mean) delivery times without the manager or
process owner being necessarily aware of it because
no “extreme” cases or outliers would be apparent and
no supplier-specific analysis could be done.
5.4 Reflections
At the end of Section 5.1, we already briefly men-
tioned that a focus on different perspectives when
collecting data from business processes is necessary.
Different stakeholders in an organization require dif-
ferent kinds of information which should all be con-
sidered when collecting data. For example, busi-
ness process throughput optimization, cost account-
ing (e.g., requiring part costs and activity drivers) and
manufacturing perspectives all require different data.
In our case example it was for instance shown that
problematic high throughput times of a process do
not necessarily imply high execution costs and vice
versa, as can be seen from Figure 2i. The combina-
tion of these different perspectives is not straightfor-
ward, and is not focused on in many research projects.
In dedicated research domains (such as operations re-
search or management accounting), a degree of spe-
cialist expertise is needed which does not necessar-
ily allow insight in other fields. While we do not
claim to have extensive expertise in these domains,
the focus on multiple different perspectives demon-
strates the emergence of issues which are specific to
the integration of different domains. Such integration
issues represent wicked problems. Even in research
domains which focus on integration, it is claimed that
only local optimizations are known, or that integration
is studied based on one dominant perspective (Ethiraj
and Levinthal, 2004).
Such integration problems can be explained
clearly based on our theoretical framework. Consider
the application of the first two principles presented in
Section 2. These principles require the identification
of the different concerns of a certain perspective, and
separating them by explicitly keeping states. How-
ever, the concerns which are identified will vary for
different perspectives. The design of a business pro-
cess which needs to be analyzed in a business pro-
cess optimization perspective will focus on concerns
which influence the throughput of the process. How-
ever, when these different tasks all have the same ac-
tivity driver for an Activity-Based Costing system,
their separation is not required based on the applica-
tion of the Separation of Concerns principles from a
cost accounting perspective. For example, similar to
the aggregations performed in case scenario 2, the se-
quence of tasks regarding the smaller administrative
tasks (e.g., tasks “Register Order” and “Evaluate Or-
der”) could be combined from a cost accounting per-
spective, because (a) they do not need to be booked
in separate accounts, since only the cost of a prod-
uct as a whole is relevant; (b) they are all performed
by the same type of resource (i.e., a human resource),
which indicates a similar activity driver; and (c) the
costs of these tasks equals “labor time” times “la-
bor cost per time unit”. From a process optimization
perspective, different arguments for separating these
tasks could be raised. For example, different employ-
ees can perform these tasks, which can cause differ-
ent throughput times. Moreover, from an organiza-
tional diagnostic perspective, these tasks should be
separated as well: this would allow an often-occurring
erroneous process outcome to be traced back to a sin-
gle task, or a single employee. For instance, in our
Custom Bikes case, managers would typically like to
be informed when the “Register Order” and “Evalu-
ate Order” tasks have significantly different through-
put and/or success rates. In contrast, concerns which
need to be separated from a cost accounting perspec-
tive (e.g., tasks with different activity drivers) may
A Case Study on Entropy Generation during Business Process Execution - A Monte Carlo Simulation of the Custom Bikes
Case
195

not be relevant to the business process optimization
perspective (e.g., when they do not add to through-
put time). Additionally, similar to the aggregations
performed in case scenario 3, a manufacturing or as-
sembly viewpoint might consider the data regarding
which supplier delivered a specific part as irrelevant
(assuming that each of the 5 considered suppliers in
our case deliver identical parts). However, we showed
in our discussion that such (data) instance traceabil-
ity can be relevant for other perspectives (such as
business process optimization in terms of throughput
time) as it was actually at the core of our simulated
problem: one of the considered suppliers turned out
to be rather unreliable in terms of its delivery time.
Therefore, the only way to gather data which pro-
vides sufficient insights for different perspectives si-
multaneously, is by separating the union of all con-
cerns of these perspectives. Based on these “atomic”
information units, different aggregations can be de-
rived to provide the required information of each per-
spective. Such detailed data could be useful even for
perspectives where certain concerns do not need to be
separated at this moment. Consider an organization
which needs to switch from a European way of re-
porting to an American one. Different accounts may
be necessary in that case. However, the atomic infor-
mation units can be re-aggregated in a different way
to comply with the new regulations. Moreover, in Eu-
rope many organizations perform two sets of book-
keeping: a national and a European one. Instead of
requiring (partly duplicate) data input in separate sys-
tems, such systems should be built to be able to handle
the aggregation of the same atomic information units.
Of course, the selection of such type of data requires
a highly structured approach aiming at gathering con-
sistent and fine-grained data. However, regarding this
granularity in for instance the cost accounting field,
it has been acknowledged that the “activities” iden-
tified in Activity-Based Costing (ABC) systems, are
to be understood as being “composed of the aggrega-
tion of units of work or tasks” (Drury, 2007, p. 342).
Therefore, the “activities” proposed can probably not
be considered as the “atomic” information units, cer-
tainly if one’s aim is to reuse these information units
for deriving insight from the different perspectives
mentioned above. Further, it has been reported that
the collection of fine-grained data for an Activity-
Based Costing system can become highly complex
(Kaplan and Anderson, 2004). However, consider
the structured way of designing software architec-
tures using Normalized Systems theory (Mannaert
and Verelst, 2009). Reusable building blocks for cer-
tain software functionality, called elements, describe
the modular structure of all concerns from different
relevant perspectives (such as remote access, security,
etcetera) which need to be handled for performing, for
example, a software action. This forces designers to
develop software based on such fine-grained modular
elements. The incorporation of a reporting concern
within these software elements (typically supporting
a set of business processes) could for example provide
possibilities to obtain the required fine-grained data in
organizations, as suggested in this paper. The design
of such elements on an organizational level itself has
been explored as well (De Bruyn, 2011; De Bruyn and
Mannaert, 2012). To obtain such elements, reusable
building blocks should be designed which perform a
generic organizational action and which handle rele-
vant cross-cutting concerns, such as logging relevant
data. In our example, the part reservation process
could be such a reusable element, which keeps data
concerning a.o. its throughput time, and the cost of
the reserved part.
6 CONCLUSIONS
In this paper, we aimed to provide evidence for en-
tropy generation during the execution of business pro-
cesses if NS theory principles are not adhered to, by
performing a Monte Carlo simulation of the Custom
Bikes case. Hence, this paper has several contribu-
tions. First, this paper validates in a more practi-
cal and empirical way conceptualizations proposed in
earlier work. Second, we extended this conceptualiza-
tion of entropy reasoning for business process model-
ing by releasing several simplifying assumptions (i.e.,
considering multiple (interacting) business processes
and allowing different mean (duration or cost) param-
eters for each task type). Third, we elaborated on
the need to split tasks and business processes up to
the level of so-called “atomic tasks”, which should be
able to be considered as atomic from several perspec-
tives simultaneously (e.g., cost accounting and oper-
ational business process optimization perspectives).
In future research, it might be interesting to propose
a set of more specific (business-oriented) guidelines
to delineate business processes and their constituting
tasks, as Van Nuffel (2011) did for the stability rea-
soning in NS, and contrast both approaches Clearly,
the aim of this paper was not at all to employ com-
plex or advanced statistical methods to perform data
mining on the information traces delivered by busi-
ness process execution. Instead, we consciously em-
ployed only the most basic statistical reasoning tech-
niques to show that the identification and registration
of the basic (“atomic”) data regarding business pro-
cess execution needs a sufficient amount of attention
Third International Symposium on Business Modeling and Software Design
196

from multiple perspectives, before entropy reduction
and relevant data analysis can occur.
ACKNOWLEDGEMENTS
P.D.B. is supported by a Research Grant of the
Agency for Innovation by Science and Technology in
Flanders (IWT).
REFERENCES
Boltzmann, L. (1995). Lectures on gas theory. Dover Pub-
lications.
De Bruyn, P. (2011). Towards designing enterprises for
evolvability based on fundamental engineering con-
cepts. In On the Move to Meaningful Internet Systems:
OTM 2011 Workshops, volume 7046 of Lecture Notes
in Computer Science, pages 11–20. Springer, Berlin,
Heidelberg.
De Bruyn, P., Huysmans, P., Mannaert, H., and Verelst, J.
(2013). Understanding entropy generation during the
execution of business process instantiations: An il-
lustration from cost accounting. In Advances in En-
terprise Engineering VII, Lecture Notes in Computer
Science. Springer Berlin Heidelberg. in press.
De Bruyn, P., Huysmans, P., Oorts, G., and Mannaert, H.
(2012). On the applicability of the notion of entropy
for business process analysis. In Shishkov, B., editor,
Proceedings of the second international symposium
on Business Modeling and Software Design, pages
128–137.
De Bruyn, P. and Mannaert, H. (2012). On the generaliza-
tion of normalized systems concepts to the analysis
and design of modules in systems and enterprise engi-
neering. International journal on advances in systems
and measurements, 5(3&4):216–232.
Drury, C. (2007). Management and Cost Accounting.
South-Western.
Ethiraj, S. K. and Levinthal, D. (2004). Bounded ratio-
nality and the search for organizational architecture:
An evolutionary perspective on the design of organi-
zations and their evolvability. Administrative Science
Quarterly, 49(3):404 – 437.
Hevner, A. R., March, S. T., Park, J., and Ram, S. (2004).
Design science in information systems research. MIS
Quarterly, 28(1):75–105.
Jacquemin, A. P. and Berry, C. H. (1979). Entropy measure
of diversification and corporate growth. The Journal
of Industrial Economics, 27(4):359–369.
Jung, J.-Y., Chin, C.-H., and Cardoso, J. (2011). An
entropy-based uncertainty measure of process models.
Information Processing Letters, 111(3):135–141.
Kaplan, R. S. and Anderson, S. R. (2004). Time-driven
activity-based costing. Harvard business review,
82(11):131–8.
Mannaert, H., De Bruyn, P., and Verelst, J. (2012). Ex-
ploring entropy in software systems: towards a precise
definition and design rules. In Proceedings of the Sev-
enth International Conference on Systems (ICONS)
2012, pages 93–99.
Mannaert, H. and Verelst, J. (2009). Normalized Systems—
Re-creating Information Technology Based on Laws
for Software Evolvability. Koppa.
Mannaert, H., Verelst, J., and Ven, K. (2011). The
transformation of requirements into software primi-
tives: Studying evolvability based on systems theo-
retic stability. Science of Computer Programming,
76(12):1210–1222.
Oorts, G., Huysmans, P., and De Bruyn, P. (2012). On ad-
vancing the field of organizational diagnosis based on
insights from entropy - motivating the need for con-
structional models. In Shishkov, B., editor, Proceed-
ings of the second international symposium on Busi-
ness Modeling and Software Design, pages 138–143.
Regev, G., Hayard, O., and Wegmann, A. (2012). Home-
ostasis - the forgotten enabler of business models. In
Shishkov, B., editor, Proceedings of the second inter-
national symposium on Business Modeling and Soft-
ware Design, pages 13–24.
Tumay, K. (1996). Business process simulation. In Charnes,
J., Morrice, D., Brunner, D., and Swain, J., editors,
Proceedings of the 1996 Winter Simulation Confer-
ence, pages 93–98. ACM Press.
Van Nuffel, D. (2011). Towards Designing Modular and
Evolvable Business Processes. PhD thesis, University
of Antwerp.
A Case Study on Entropy Generation during Business Process Execution - A Monte Carlo Simulation of the Custom Bikes
Case
197
