
Value Map
A Diagnostic Framework to Improve Value Creation and Capture in Service
Systems
Arash Golnam
School of Computer and Communication Sciences, Ecole Polytechnique Fédérale de Lausanne , Lausanne, Switzerland
arash.golnam@epfl.ch
Vijay Viswanathan
Webdoc, Rue de Genève 17 Lausanne, 1003, Switzerland, Switzerland
vviswanathan@gmail.com
Christa I. Moser
Business School Lausanne, Route de la Maladière 21, 1022 Chavannes, Switzerland
christa.moser@bsl-lausanne.ch
Paavo Ritala
School of Business, Lappeenranta University of Technology, Lappeenranta, Finland
paavo.ritala@lut.fi
Alain Wegmann
School of Computer and Communication Sciences, Ecole Polytechnique Fédérale de Lausanne , Lausanne, Switzerland
alain.wegmann@epfl.ch
Keywords: Modeling, Problem Structuring Method (PSM), SEAM, Service Systems, Value Creation and Capture,
Value Map.
Abstract: In this paper, we introduce a problem structuring method (PSM) called “Value Map”. Value Map is an
extension to the Supplier Adopter Relationship Diagram in the Systemic Enterprise Architecture Method
(SEAM). Value Map assists in understanding, analysis and design of value creation and capture in service
systems. To develop the Value Map, we reviewed the literature that examine value creation and capture
particularly in the marketing and microeconomics domains. The literature review helped us to discover and
explore the relationships among the important concepts relevant to the processes of value creation and
capture. Having identified these concepts and their relationships, we graphically represented them in the
form of a conceptual model. The conceptual model provided insights into the structure and the dynamics of
value creation and capture and served as a reference point for developing the notational elements and the
modeling constructs in the Value Map. We illustrate the applicability of the Value Map by modeling value
creation and capture in the service system of a social networking company called Webdoc.
1 INTRODUCTION
In the theories of economic exchange, value was
traditionally viewed only from the perspective of
monetary transactions between the customers and
the organization. Value was perceived to be rooted
in goods that were produced by the organization.
Once distributed to customers, the value produced
was destroyed, or consumed. In the marketing
literature, this perspective is broadly referred to as
the Goods-Dominant (G-D) logic, which was
prevalent pre-1900s. From the standpoint of the G-D
logic, customers played a negligible role in the value
creation process. In other words, the organization
created what was perceived as valuable to the
customer (Prahalad and Ramaswamy, 2004) without
the involvement of the customer.
106
Golnam A., Viswanathan V., I. Moser C., Ritala P. and Wegmann A.
Value MapA Diagnostic Framework to Improve Value Creation and Capture in Service Systems.
DOI: 10.5220/0004774501060120
In Proceedings of the Third International Symposium on Business Modeling and Software Design (BMSD 2013), pages 106-120
ISBN: 978-989-8565-56-3
Copyright
c
2013 by SCITEPRESS – Science and Technology Publications, Lda. All rights reserved

According to Vargo et al. (2010, 136), the
underlying objective of the G-D logic is to
“maximize operational efficiency and reduce firm
costs in order to increase financial profits”.
Moreover, G-D logic primarily focuses on operand
resources (i.e., those resources that are tangible;
physical goods) that are manifested in products.
In a paradigm shift, the economic exchange
model has been augmented and extended to include
customers as a fundamental tenet of the value
creation process. This shift has led to the emergence
of the Service-Dominant (S-D) logic. The G-D and
the S-D logic differ in a number of important ways,
(see Table 1).
Table 1: G-D Logic vs. S-D Logic.
G-D Logic S-D Logic
Focus
Operand resources;
creating goods to be
sold
Operant resources;
intangible resources (i.e.,
knowledge and skills)
Goods
The product of value
to be exchanged
Seen as intermediaries in
service delivery
Service
Intangible output of
a good
Service is the foundation
of all exchange
Value
Created within
organizations
Co-created by
organizations and
customers
The focus in the S-D logic is on intangibles,
competencies, dynamic exchange processes and
relationships that are broadly referred to as operant
resources. Operant resources have an influence on
other resources to create benefit through the service
(Vargo et al., 2010).
The concept of a good in the G-D logic is the
product of value to be exchanged. While, in the S-D
logic, a good is merely seen as an intermediary in
the delivery of service, broadly viewed as delivery
mechanisms for services (Vargo and Lusch, 2008).
Furthermore, in the S-D logic, the concept of
service is extended beyond a “particular” kind of
intangible good (i.e., knowledge and skills) or an
intangible output of a good. Instead, service is
deemed as the foundation of all exchange (i.e.,
service exchanged for service) (Vargo and Lusch,
2004a).
Finally, the S-D perspective conceptualizes a
firm’s offerings not as an output, but as an input for
the customer’s value-creation process. Thereby,
instead of viewing value as being created within
companies, value is increasingly viewed as being co-
created between companies, customers, and other
actors within a service system.
Service systems are the arrangement of
resources, including people, information, and
technology (Vargo et al., 2009). In service systems,
value is perceived as being created in collaboration
with the customer (Sphorer and Maglio, 2008).
Grönroos, (1979, 2006, 2008), Ballantyne and Varey
(2006), and Gummesson (2007) argue that in the S-
D logic, the supplier is not the sole creator of value,
but that value emerges when the customer is
involved in the process. Thus, from the S-D
standpoint, customers are the eventual locus and the
determining party of the value that is created
(Sandström and Kristensson, 2008). Lusch and
Vargo (2006) suggest that the customer’s
collaborative role in value creation is what is known
as co-creation of value.
Moreover, the S-D logic emphasizes on the
subjective and experiential nature of value and thus
asserts that value is “uniquely and
phenomenologically determined by the beneficiary”
(Vargo and Lusch, 2008). Based on this perspective,
a distinction is made between value-in-use and
value-in-exchange. Value-in-use refers to the
specific qualities of the service. These qualities are
perceived by users in relation to their needs (i.e.,
speed or quality of performance, aesthetics, or
performance features). Value-in-exchange can be
defined as the “monetary amount realized at a
certain point in time in exchange” (Lepak et al.,
2007).
After value has been created, it is important for
the organization to capture this value. Lepak et al.
(2007) explain that some value may be lost or in
some cases, shared with other stakeholders. Value
capture, also termed value retention or value
appropriation, deals with the amount of exchange
value the customer has kept and retained by the
organization in the form of profit (Bowman and
Ambrosini, 2000). From a non-monetary
perspective, value capture can be described as the
degree to which service quality goals have been met
or exceeded (Parasuraman et al., 1985).
Once value has been (co)-created, the viability of
the service system depends on its ability to capture
the created value. In other words, the service
provider sustains its existence with the value it
retains (Ritala et al., 2009). Thus, it can be asserted
that sustainable value (co)-creation and capture is an
imperative for viability of service systems.
In the service science literature, a number of
modeling frameworks provide conceptual tools to
support the design of service offerings (see for
instance Gordijn and Akkermans, 2003; Weigand et
al., 2009; Pijpers and Gordijn, 2007; Yu, 1997;
Weigand, 2009). Such modeling frameworks,
however, mainly address the design and analysis of
value from the customers’ perspective and do not
Value Map - A Diagnostic Framework to Improve Value Creation and Capture in Service Systems
107

sufficiently address service providers’ value capture
in the service value equation. In general, the same
gap can be broadly identified in the service
literature, where value (co)-creation has often been
emphasized over value capture.
Moreover, there are nonlinearities and feedback
structures inherent in the interplay between value
creation and capture in service systems. For
instance, a slight increase in price, results in the loss
of a huge proportion of the market, or, a new service
feature can boost the customer base of a service
provider. While presenting both conceptual and
practical challenges for service providers and service
science researchers, this systemic interconnectedness
has been glossed over in the service science
research.
To tackle the above mentioned research gaps, in
this study, we introduce the Value Map; a
framework for modeling value in service systems
that takes into account both value creation (for and
with customers) and value capture (by service
providers). The Value Map can be broadly referred
to as a Problem Structuring Method (PSM) (Mingers
and Rosenhead, 2004; Rosenhead, 1996; Rosenhead
and Mingers, 2001) that aims to provide conceptual
and practical assistance in analyzing, reconfiguring
and designing value in service systems. The
modeling constructs and notational elements in the
Value Map are derived from a literature review we
conducted to gain a new perspective into the
structure and the dynamics of value creation and
capture.
This paper is organized in the following way. In
Section 2, we elaborate on the structure and the
results of the literature review we conducted to
discover the important concepts relevant to value
creation and capture. In order to gain a better
understanding, the concepts and their relationships
were formalized in 10 algebraic functions and were
graphically represented in form of a conceptual
model. In Section 3, we introduce the value map and
its modeling constructs and notational elements. In
Section 4, we present the results of the application of
the Value Map to model and improve value creation
and capture in a social networking platform called
Webdoc. Section 5 includes the related work. In this
section we briefly report on the results of an
empirical study we conducted to assess the
usefulness of the Value Map and to compare it to an
established method for presenting business models.
Finally, in Section 6 we present our conclusions,
limitations of research and our future work.
2 THE CONCEPTUAL MODEL
In this section, we present the structure and the
results of the literature review we conducted on the
theoretical frameworks that examine value creation
and capture. A literature review can be conducted
for a variety of purposes see (Hart, 1999, 27). In this
paper, the literature review will help us discover the
important concepts relevant to value creation and
capture and explore the relationships among these
concepts in order to gain a new perspective into the
structure and the dynamics of value creation and
capture. Thus, the literature review helps us
understand the “what” (i.e., the concepts), the
“how”, (i.e., their relationships) and the “why” (i.e.,
the rationale behind the selection of the concepts and
the perceived relationships among them). According
to Whetten (1989), the “what”, “why” and the
“how” are the three tenets of a theoretical
contribution.
The correct selection of the published materials
is a vital element of a literature review. We followed
Baker (2000) and developed a number of criteria for
selection of the work to be included in the literature
review. The articles we included in the literature
review addressed value creation and capture
simultaneously, and were indexed by Institute for
Scientific Information (ISI). These two criteria led
us to a total of around 30 articles. We then derived
the key concepts discussed in each article. The
concepts were then analyzed and divided into three
categories: customer value, customer value creation
process, and service provider value capture. Next,
for each category, we developed a number of
functions that embody algebraic expressions
explaining the relationships between the concepts
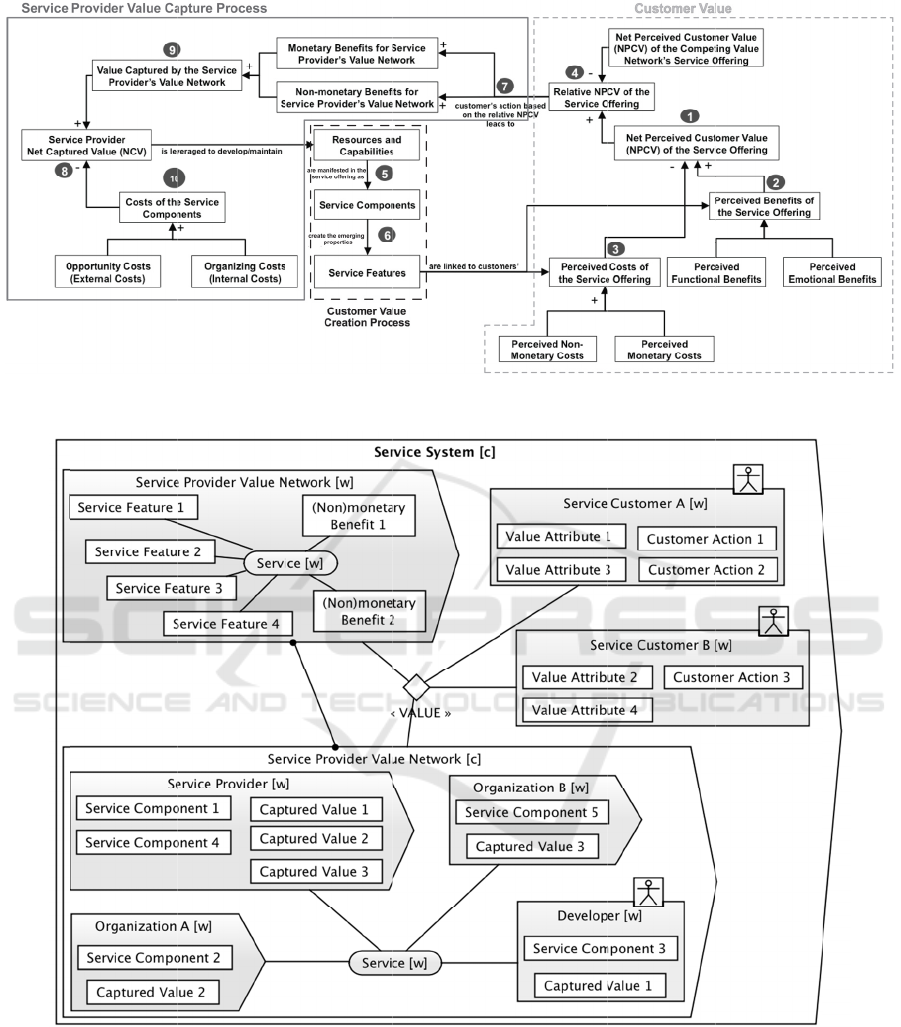
(see Table 2). Having identified the concepts and
their relationships, we graphically represented them
in form of a conceptual model made up of boxes
(i.e., the concepts) and arrows (i.e., their
relationships), (see Figure 1). According to Whetten
(1989, 491), “such visual representations often
clarify the author's thinking and increase the reader's
comprehension”. As illustrated in Figure 1, we have
marked the three categories of concepts in the
conceptual model.
3 THE VALUE MAP
Figure 2 represents the actors and their properties in
a service system. We refer to this representation as
the Service System Model. As illustrated, the
Service System is composed of a Service Provider
Third International Symposium on Business Modeling and Software Design
108

Table 2: The Algebraic Functions capturing relationships between Customer Value, Customer Value Creation Process, and
Service Provider Value Capture concepts.
Customer Value Conceptualizations
1
Net perceived customer value (NPCV) = (perceived service benefits) – (perceived service costs)
NPCV equals the benefits minus the costs of receiving the service.
(Kotler, 2000; Day, 1990; Huber, 2001)
2
Perceived benefits of the service offering = (perceived functional benefits) + (perceived emotional
benefits)
The sum of the functional and emotional benefits constitutes the perceived benefits of the service
offering.
(Kotler, 2000; Grönroos, 2000)
3
Perceived costs of the service offering = (Perceived non-monetary costs) + (Perceived monetary costs)
The costs incurred to the customer who receives the service are divided into two categories: monetary
cost and non-monetary costs that can include time, energy, and psychic costs.
(Kotler, 2000; Bowman and Ambrosini, 2000)
4
Relative NPCV of the service offering = (NPCV of the service provider’s value network offering) –
(NPCV of the competing value network’s service offering)
Relative net perceived customer value is the net perceived value created by a service provider’s
offering in relation to the competing offerings.
(Bowman and Ambrosini, 2000)
Customer Value Creation Process
Conceptualizations
5
Service components ⊂ Resources and capabilities (of the service provider and its value network)
Service components are a subset of the resources and capabilities of the service provider and its value
network that are manifested in the service.
(Kothandaraman and Wilson, 2001; Moller and Svahn, 2006; Bowman and Ambrosini, 2000)
6
Service components (of service provider and its value network) ⇒ Service features ⇒ Service value
attributes (of service customer)
Service components create some emergent properties for the service, which are noticed by the
customer. We refer to these emergent properties of the service as service features. Service features
impact the perceived customer value through various value attributes.
(Pynnonen et al., 2011)
Service Provider Value Capture Conceptualizations
7
NPCV of the service offering ∝ Service providers benefits
The customer’s relative perception of value determines the actions the customers undertake, which
result in generating more or less benefits for the service provider.
(Bowman and Ambrosini, 2000)
8
Net captured value (NCV) of the service provider = (Value captured by the service provider)
– (Cost of the service components)
The NCV is the value captured by the service provider minus the costs of the service components.
(Bowman and Ambrosini, 2000)
9
(Non-)monetary benefits for the service provider ∝ Value captured by the service provider
The (non)monetary benefits created by the customer for the service provider are proportional to the
value captured by the service provider.
(Nelson and Winter, 1982; Allee, 2008; Ulaga, 2003)
10
Costs of the service components = (Organizing costs i.e. internal costs of the service provider) +
(Opportunity costs i.e. external costs of the suppliers in service provider value network)
The costs of the service components equal the sum of the organizing costs of the service provider, and
the external opportunity costs of the suppliers in the value network.
(Masten et al., 1991; Blomqvist et al., 2002)
Value Map - A Diagnostic Framework to Improve Value Creation and Capture in Service Systems
109
Value
Ne
Service
P
as a bla
c
b
y grey
a
whole
(
represen
represen
Figure 1:
G
N
etwor
k
and S
e
P
rovider Val
u
ck
-
b
ox or a
w
a
nd white col
o
(
blac
k
-
b
ox)
n
tations of th
e
n
ted as a blac
k
G
raphical repre
e
rvice Custo
m
u
e Networ
k
c
a
w
hite-
b
ox de
n
o
rs. In Figure
and comp
o
e
systems a
n
k
-
b
ox we mod
s
entation of va
l
Figure
2
m
er A and B.
a
n be represe
n
oted respecti
2, [w], [c] de
o
site (white-
b
n
d entities.
W
el the Service
,
l
ue creation an
d
2
: Service syste
m
The
e
nted
i
vely
e
note
b
ox)
W
hen
e
, the
Se
r
for
em
e
Se
r
int
o
we
p
e
o
d
capture conc
e
m
model.
r
vice Feature
s
the Service
e
rgent prope
r
r
vice Provide
r
o
the config
u
will be abl
e
o
ple who co
m
e
pts and their r
e
s
, and the (
N
Provider
V
r
ties. The w
h
r
Value Net
w
r
ation of the
e
to view th
e
m
pose the va
l
e
lationships.
N
on)monetar
y
V
alue Netwo
r
w
hite-
b
ox vie
w
w
or
k
p
rovid
e
value netw
o
e
organizatio
n
l
ue network
y
Benefits
rk
as its
w
of the
e
s insight
rk. Thus,
n
s or the
and thei
r
Third International Symposium on Business Modeling and Software Design
110

Figure 3: The value map.
contribution to the service in terms of the Service
Components they provide. We can also see the Value
Captured by each of the entities in the value
network. As illustrated in Figure 2, the Service
Provider collaborates with Organizations A and B
and the Developer to create the Service. This
collaboration is captured in terms of the Service
Components each of these entities provides. Finally,
in the Service System Model we represent the
Service Customers by modeling the Attributes that
impact their perception of the service value and the
Actions the customers take on the basis.
A generic Value Map is illustrated in Figure 3.
As marked in Figure 3, the Value Map embodies
customer value, customer value creation and service
provider value capture processes (i.e., the three
categories of concepts presented in Section 2) in a
service system. This is achieved by making the
relationships between the actors (i.e., service
provider, organizations in the value network, service
customer, etc.) and the properties (service
components, service features, value attributes,
customer actions, etc.) presented in the Service
System Model explict. In Table 3, we explain the
relationships and their notation in the Value Map.
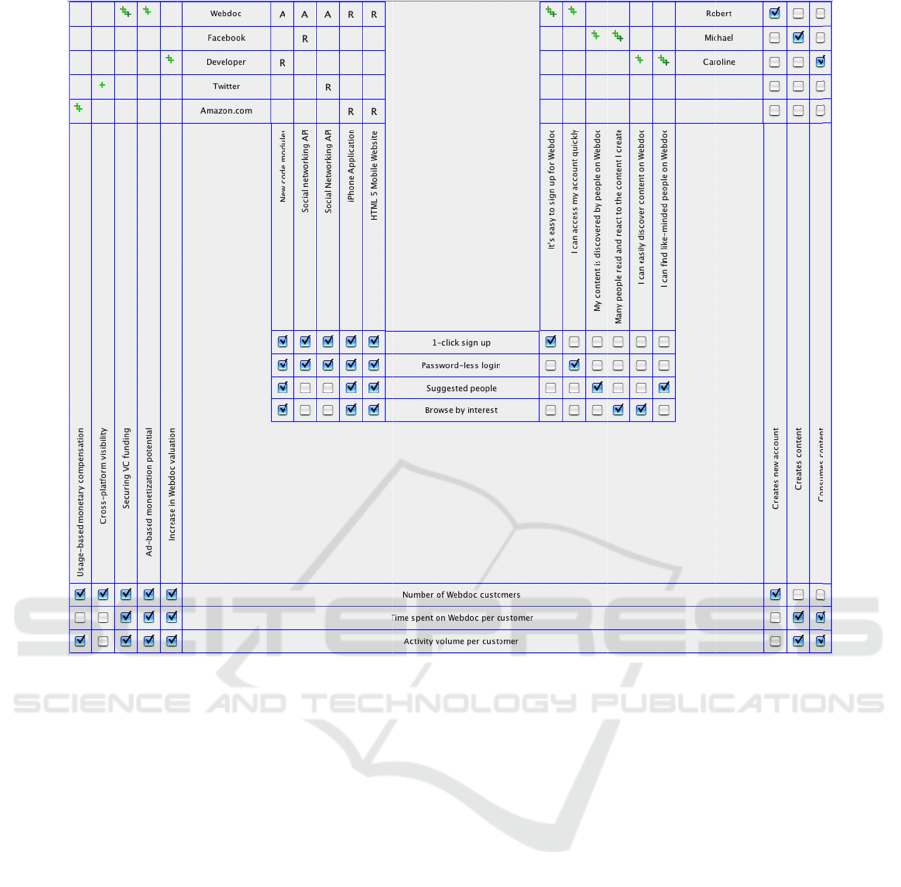
To map the Service Provider and the other
entities in the Service Provider Value Network to the
Service Components we use the RACI (Responsible,
Accountable, Consulted, Informed) Matrix. As
illustrated in Figure 3, the Service Provider is
responsible for Service Component 1 and consults
Organization A. This consultation may reduce the
risk of incompatibility between the Service
Components 1 and 2 or ensure the existence of a
contingency plan in case an unanticipated scenario
arises in the value creation process.
Table 3: Relationships and mappings in the Value Map.
Relationship Mapping Notation
- Entities in the value network
- Service Components
RACI Matrix
- Service Components
- Service Features
;
- Service Features
-Value Attributes
;
-Value Attributes
- Net Perceived Customer Value
+++ Strong
Positive
--- Strong Negative
- Customer
- Customer Actions
;
- Customer Actions
- (Non)monetary Benefits
;
- (Non)monetary Benefits
- Captured Value
;
- Captured Value
- Service Provider’s Net Captured Value
;
The Service Provider also contributes to the
service through Service Component 4. Here, the
Service Provider makes sure that Organization B is
Value Map - A Diagnostic Framework to Improve Value Creation and Capture in Service Systems
111

kept informed about the progress. The Service
Component 4 provided by Organization B may be
affected by Service Component 5 which is provided
by the Service Provider. Note that these two service
componets create the Service Feature 3. This sheds
light on why Organization B needs to be kept up-to-
date. In principle, the Service Provider is
accountable for correct and thorough provisioning of
the service components for which other entities are
responsible.
As discussed in the previous section, Service
Components create the Service Features that impact
the net perceived customer value (NPCV) through
the Value Attributes. Based on his or her perception
of the value of the service offering, the customer
takes Actions. These Actions generate the
(Non)monetary Benefits for the Service Provider
Value Network. These benefits are directly linked to
the Value Captured by each of the entities in the
value network. In Figure 3, the Service Provider and
Organization A provide Service Components 1 and 2
respectively. These two components will create the
Service Feature 1 that negatively impacts the NPCV
for Service Customer A and B through Value
Attributes 1 and 4. As shown, the impact is stronger
for the Service Customer B. Similarly, the Service
Provider and Organization B provide Service
Components 4 and 5 respectively, thereby creating
Service Feature 3. This service feature has a strong
positive impact on the Service Customer A’s
perception of the service value as captured in Value
Attribute 3. Service Customer A takes Customer
Actions 1 and 2 that contribute to the (Non)monetary
Benefits 1 and 2 thereby
realizing and contributing
to Captured Value 1 - 3 for the entities in the Service
Provider Value Network. As shown, Captured Value
1 has a strong and medium positive impact on the
net captured value of the Service Provider and
Developer respectively. Other sections of the Value
Map can be interpreted the same way.
4 MODELING VALUE
CREATION AND CAPTURE IN
WEBDOC
In this section, we report on the application of the
Value Map as a diagnostic tool to improve value
creation and capture in the service system of
Webdoc. First we present some information about
Webdoc and the motivations underlying the project
in which the Value Map was applied. Next, we
discuss how customer value attributes were surfaced
by means of the data capture and user intelligence
tools. Then, we model the creation and capture of
value in Webdoc using the Value Map. Finally, we
present some strategy implications based on the
findings from our modeling process.
4.1 Webdoc
Webdoc is an Internet startup founded in Lausanne
in 2009. It currently has offices in Lausanne
(headquarters: management, engineering, design,
and product), London (business development), Lima
(community engagement and support), and San
Francisco (business development). Webdoc provides
a social network platform on which users can
express themselves in a richer, more interactive way
than traditional social networks. Specifically, it
provides a channel in which existing web content, be
it video, audio, images, or text, can be combined
with content created using the proprietary rich
editor, in a way that requires no technical skills and
is easy to share and distribute. These creations are
referred to as “webdocs” and can be embedded on
any third-party site, including other websites and
social networks. Additionally, all webdocs created
can be showcased in their relevant category of
interest on the Webdoc destination site. The creators
have the option to make their webdocs completely
private (only users granted explicit permission can
view) or public but unlisted (meaning the webdoc
will not be featured on the Webdoc site). The service
is free to all users with no advertising, currently
available in 5 languages (English, French, Spanish,
Portuguese, and Russian), and accessible through a
variety of platforms including desktop web
browsers, mobile device browsers, and native
mobile applications.
As the company and user base has grown
tremendously in the past 12 months, there has been
an increasing need for establishing a better
understanding of and improving perceived customer
value. The analysis, conception, and subsequent
improvement of the value perceived by the
customers feed into vital functions of the service and
company, including product development, overall
strategy, valorization of the company for current and
future investment rounds, and optimization of the
service. These needs are what triggered the work
that has led to the culmination of this project. In the
next sections we explain how the value attributes
were surfaced and how Value Map improved value
creation and capture in Webdoc’s service system.
Third International Symposium on Business Modeling and Software Design
112

4.2 Surfacing Customer Value
Attributes
One of the main challenges in modeling value
creation and capture in service systems is surfacing
the customer value attributes. This is considered as
an important initial step to gain insights into the
customers’ perceived benefits and costs of adopting
the services offered by a service provider. In the
context of the project conducted at Webdoc, this step
was further sub-divided into two distinct but
strongly interconnected fields: data capture and user
intelligence.
4.2.1 Data Capture
Broadly speaking, information on customers’
perceptions of value and their relative importance
can be gathered through direct interaction with
customers or customer surveys. Revealed preference
methodologies (Carson et al., 1996) are also used to
understand customers’ needs and preferences based
on their behavior. However, for Internet-based
services, the channels through which the service
provider can understand its users are very different
than those of a traditional service. The
overwhelming difference is the radically new
interaction paradigm through which service
providers and service adopters communicate. For
traditional service providers, a wealth of customer
data, such as customer demography, is gathered
without any explicit effort, simply by the customer’s
physical presence. On the other hand, for an Internet
firm like Webdoc, sophisticated measures need to be
put in place to understand even the most
fundamental characteristics of its users, such as
location, language, gender, and age. Without the
application of data capture tools it would almost be
impossible to answer basic questions such as “Who
are the service customers?” “How frequently do they
use the service?” “How do service customers access
the service?” “How much do they use the service
for?” To answer such questions, a number of service
providers offer web analytics packages. These are
third party, off-the-shelf solutions that can be
customized to varying degrees, and are provided for
a cost ranging from free to tens of thousands of
dollars a month. There also exists the possibility for
every Internet company to custom-build its own web
analytics and data capture solution. In the context of
this project, the latter was the first solution
considered, but was quickly discarded due to its
infeasibility.
4.2.2 User Intelligence
Data capture contributes to the decision processes in
Internet-based services by providing macro-level
information. User intelligence tools, however,
provide a much more nuanced perspective at the
micro level, which sacrifices on breadth of data for
depth. The fundamental motivation of the
application of user intelligence was the need for
product development insight. While numeric metrics
such as overall visitors, logged in users, views of a
particular page, and so on are certainly invaluable,
they are more useful in measuring the effectiveness
(or ineffectiveness) of a feature post-change than
they are in suggesting what changes might be
needed in the first place. Thus, user intelligence
provides data that is more prescriptive. This data is
complementary to the descriptive data derived from
the data capture tools.
User intelligence applications offer various
analytical and intelligence tools such as heat maps
and user recordings. Heat maps are screenshots of
the website showing the spatial distribution of clicks
over the screen space that offer important product
insight, as they show what links and content garner
the highest level of attention from the audience. User
recordings are an attempt to recreate individual user
sessions by aggregating mouse movement, keyboard
activity, scrolling and navigation, and clicks into a
video.
Some advanced user intelligence applications
provide the possibility of creating a test environment
in which a random sample of participants execute
tasks that are predefined based on the demographic
and technical requirements. Upon completion of the
tasks, a questionnaire is automatically generated,
which is filled out by the participant. The key aspect
is that while performing the tasks, the entire user
screen is recorded, along with an audio stream for
the live commentary of the participants. The
application of data capture and user intelligence
tools provided invaluable assistance in surfacing the
customer value attributes.
4.3 Modeling Value Creation and
Capture in Webdoc
In this section, we apply the Value Map to represent
value creation and capture in Webdoc’s service
system. To this end, first we shed some light on how
Webdoc can capture value as a service provider.
Next, we analyse the value for Webdoc’s customers.
Finally, we show how the Value Map resulted in
improving value creation and capture in Webdoc.
Value Map - A Diagnostic Framework to Improve Value Creation and Capture in Service Systems
113
4.3.1
V
Internet
-
network
i
b
usiness
This m
e
custome
r
their exi
the non
These n
o
include:
user, an
d
non-mo
n
Webdoc
-
I
ncr
e
of an in
i
an exa
m
service
p
2012 fo
r
of com
m
the ti
m
announc
shared t
h
- Secu
r
Most st
a
such as
b
enefits
factors
f
V
alue Captu
r
-
b
ased com
p
i
ng platforms
model (Ost
e
ans these c
r
s for servic
e
stence these
s
-monetary b
e
o
n-monetary
b
number of
u
d
time spent
o
n
etary benefit
s
by:
e
asing
t
he va
l
i
tial public o
ff
m
ple, Instagr
a
p
rovider, was
r
$300 millio
n
m
on stoc
k
. T
h
m
e. Before
ed that more
h
rough its mo
b
r
ing funding
a
r
t
-ups rely o
VCs (Bhi
d
listed abov
e
f
or VCs to
m
r
e by Webd
p
anies, in
p
such as We
b
erwalder an
d
ompanies d
o
e
they offer.
s
ervice provi
d
e
nefits from
b
enefits in th
e
u
sers, volum
o
n the platfo
r
s
can result i
n
l
uation of the
ff
ering (IPO)
o
a
m, the onli
n
acquired by
F
n
in cash and
h
e deal was
w
the acquis
i
than 5 billio
n
b
ile apps (In
d
by venture
c
n funds fro
m
d
e, 2000). T
h
e
are among
m
ake a decisi
o
Figure 4
o
c
p
articula
r
, s
o
b
doc follow a
d
Pigneur, 2
0
o
not charge
Thus, to su
s
d
ers rely solel
y
their custo
m
e
case of We
b
e
of activity
r
m per user.
S
n
value captur
e
company in
c
o
r acquisitio
n
n
e photo sh
a
F
acebook in
A
23 million s
h
w
orth $1 billi
o
i
tion, Insta
g
n
photos had
b
d
vik, 2012).
c
apitalists (
V
m
external so
u
h
e non-mon
e
the determi
n
o
n to invest
o
: Webdoc’s se
r
o
cial
free
0
10).
the
s
tain
y
on
m
ers.
b
doc
per
S
uch
e
for
case
n
. As
a
ring
A
pril
h
a
r
es
o
n at
g
ram
b
een
V
Cs).
u
rces
e
tary
n
ing
o
r to
co
n
W
e
-
p
o
s
rev
e
ad
v
b
as
str
e
nu
m
ti
m
for
wh
i
4.3
To
dif
f
est
a
ide
n
firs
b
e
c
cat
e
-
cre
a
is t
h
the
org
r
vice system, n
e
n
tinue invest
i
e
bdoc.
M
onetization
s
sibility for I
n
e
nues by
v
ertisements
o
ed monetiza
t
e
ams for int
e
m
ber of visit
o
e they spend
businesses o
r
i
ch they plac
e
.2 Value fo
r
improve the
f
erent custom
e
a
blished. Tw
o
n
tified: firs
t
-
t
t
-time visito
r
c
omes a retur
n
The return
v
e
gories: conte
Content cre
a
a
tes or curat
e
h
e process of
web and p
r
anized way.
e
w actors and
p
i
ng in a st
through a
d
n
terne
t
-
b
ased
authorizing
o
n their web
p
t
ion is one
e
rne
t
-
b
ased s
e
o
rs, their ac
t
on a websit
e
r
individuals
t
their adverti
s
r
Webdoc’s
NPCV, firs
t
e
r categories
o
o
main categ
o
t
ime and ret
u
uses Webd
o
n
visitor.
v
isitors are d
n
t creators an
a
tors.
This
c
s the content
sorting conte
n
r
esenting it
r
operties.
t
ar
t
-up com
p
d
vertisement.
services is
g
the pres
e
p
ages. Adve
r
of the mai
n
ervice provi
d
t
ivity volum
e
e
are the ma
i
t
o choose a
w
s
ements.
Customers
t
an underst
a
o
f Webdoc n
e
o
ries of cust
o
t
urn visitors.
o
c’s services
d
ivided into
t
n
d content co
n
c
ategory of
c
t
on Webdoc.
n
t created by
in a meani
n
p
any like
Another
g
enerating
e
nce of
r
tisemen
t
-
revenue
d
ers. The
e
and the
i
n criteria
w
ebsite on
a
nding of
e
eds to be
o
mers are
When a
again, he
t
wo main
n
sumers.
c
ustomers
Curation
others on
n
gful and
Third International Symposium on Business Modeling and Software Design
114
- Con
t
and rea
c
reaction
commen
t
It shoul
d
not mut
u
As d
i
b
y the
b
Webdoc
charge,
i
service
b
findings
step r
e
opportu
n
the ser
v
monetar
y
energy,
Time c
o
service
c
to use t
h
effort th
a
abstract
the cust
o
Figure 5
t
ent consume
r
c
t to the co
n
takes place
t
ing on the c
o
d
be stated th
a
u
ally exclusiv
e
i
scussed in S
e
b
enefits and
offers its se
r
i
t would hav
e
b
enefits to im
p
from the dat
a
e
vealed a
n
ities concer
n
v
ice. As out
l
y
costs inclu
d
and psychic
o
st is the a
g
c
ustome
r
nee
d
h
e service.
E
a
t needs to be
of all – the
o
me
r
in using
: The Value M
a
r
s. These cu
s
n
tents create
d
in form of
sh
o
ntents.
a
t these custo
m
e
.
e
ction 2, the
N
the costs o
f
r
vice to the
c
e
been intuiti
v
p
rove the NP
C
a
capture an
d
number
o
n
ing the non-
m
l
ined in Tab
l
d
e but are n
o
aspects of a
d
g
gregate of
t
d
s to invest i
n
E
nergy cost i
s
spent. Psych
i
cognitive str
e
the service.
a
p: capturing v
a
s
tomers cons
d
by others.
h
aring, likin
g
m
er categorie
s
N
PCV is imp
a
f
the service.
c
ustomers fr
e
v
e to focus o
n
C
V. Howeve
r
d
user intellig
e
o
f improve
m
m
onetary cos
t
l
e 2,
t
hese
n
t limited to t
d
opting a ser
v
t
he durations
n
order to be
s
the sum o
f
i
c cost is the
m
e
ss undergon
e
alue creation a
n
s
ume
The
g
, or
s
are
a
cted
.
As
e
e of
n
the
r
,
t
he
e
nce
m
ent
t
s of
n
on-
t
ime,
v
ice.
the
able
f
the
m
ost
e
by
ma
p
cos
no
n
-
co
n
cos
-
cus
4.3
Fig
act
o
sig
n
the
s
an
d
the
s
4.3
.
Ini
t
the
n
d capture in
W
Data gatheri
n
p
ping these
t
s onto their
n
-monetary c
o
Filling out
t
n
tent and pe
o
ts of the Web
Rememberin
g
tomers with
h
.3 Improvi
n
Capture
u
re 4 shows
W
o
rs and their
p
n
. In the Valu
e
s
e novelties
r
d
capture in
W
s
e changes in
.
3.1 Reducin
g
t
ially, an unre
sign up butto
n
W
ebdoc’s servic
n
g and user i
n
three catego
r
c
orrespondin
g
o
sts of the ser
v
t
he sign up
f
p
le increase
d
d
oc’s custom
e
g
password
s
h
igh psychic c
o
n
g Value C
r
in Webdoc
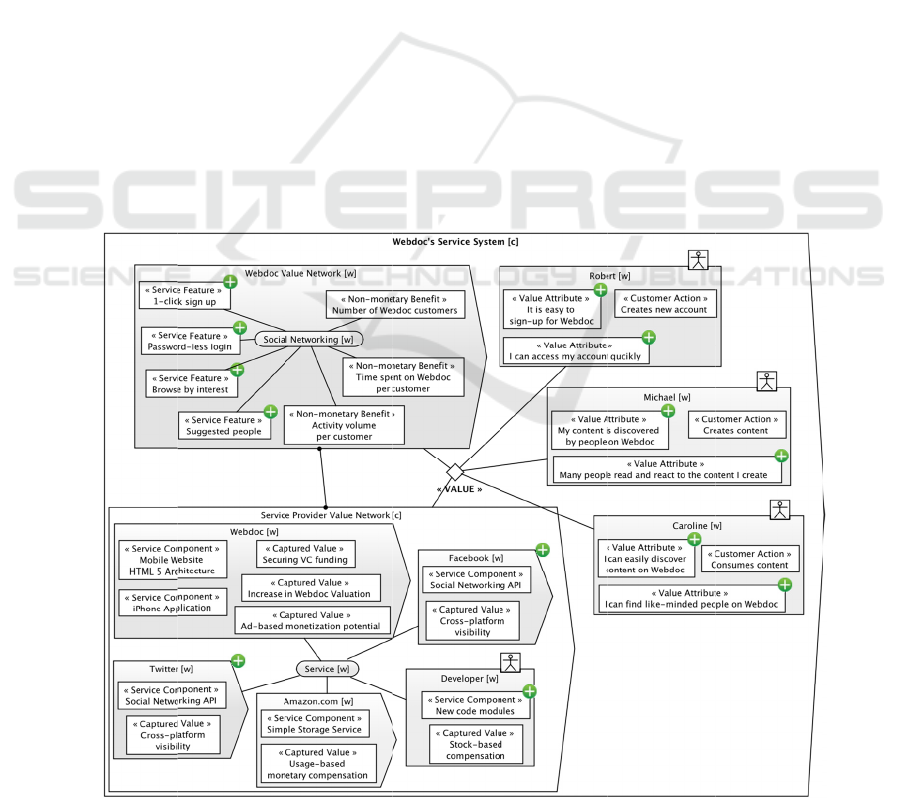
W
ebdoc’s se
r
p
roperties ar
e
e
Map in Fig
u
r
esult in im
p
W
ebdoc servi
c
the followin
g
g
Clicks to Si
g
g
istered visit
o
n
, click it, an
d
c
e system.
n
telligence ai
ries of non-
g
value attrib
v
ice):
form and di
s
d
the time a
n
e
rs.
s
incurred
c
osts.
r
eation and
r
vice system.
e
marked wit
h
u
re 5, we illu
s
p
roving valu
e
c
e system.
W
g
sections.
g
nup
o
r needed to
s
d
then fill out
d
ed us in
monetary
utes (i.e.,
s
covering
n
d energy
Webdoc
The new
h
the plus
s
trate how
e
creation
W
e explain
s
earch for
a form to
Value Map - A Diagnostic Framework to Improve Value Creation and Capture in Service Systems
115
complete the process. To save the visitor’s time, the
application programming interfaces (APIs) from
social networking websites, Facebook and Twitter
were integrated in the home page of Webdoc as
shown in Figure 6. This way, the first-time visitors
could sign up with one click without filling out the
sign up form. The return visitors could also use their
Facebook or Twitter credentials to connect to
Webdoc.
Figure 6: Reducing clicks to sign up.
As illustrated in the Value Map in Figure 5,
Twitter and Facebook provide Webdoc with the
APIs as the service components. These APIs along
with the New code modules provided by the
Developer result in the service features 1-click sign
up and Password-less login. These two new features
create the following two value attributes for Robert
who is a first-time visitor: It’s easy to sign up for
Webdoc and I can access my account quickly. These
features along with the rest of the benefits of
Webdoc convince Robert to create a new account
(i.e., customer action) thereby increasing number of
Webdoc customers increases. The rise in the number
of customers contributes to Increase in Webdoc
valuation, Ad-based monetization potential and
Securing VC funding. As stated in Section 4.3.1,
these are the main ways Webdoc can capture value.
We can also see that Ad-based monetization
potential is not as important as the other two value
attributes. The number of Webdoc customers also
gives Twitter and Facebook Cross-platform
visibility, which can contribute to their web
presence.
The two new service features improved the
NPCV by reducing the time and energy costs
associated with filling out the sign up form as well
as the psychic costs of the remembering passwords.
Introduction of these features increased the number
of new accounts created on Webdoc. Moreover,
nearly two months after their implementation, over
80% of the users were logging in to Webdoc using
their Twitter and Facebook accounts.
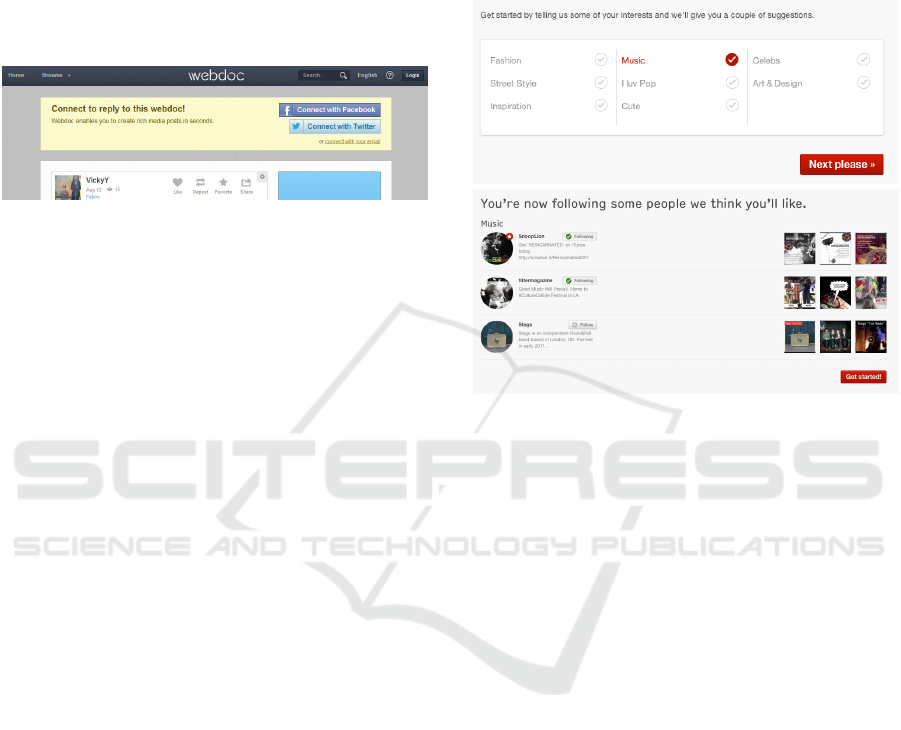
4.3.3.2 Welcome Workflow
To facilitate discovering content and content
creators, a welcome workflow was designed, see
Figure 7.
As shown in the Value Map, the welcome
workflow, captured in the New code modules service
component, resulted in the creation of two new
service features: Browse by interest and Suggested
people.
Figure 7: Welcome workflow.
Caroline is a content consumer. The two features
help her in finding like-minded people and
discovering content on Webdoc. Michael, a customer
who creates content on Webdoc, benefits from these
two features as his content is discovered by people
on Webdoc and many people read and react to the
content he creates. These value attributes form a
self-reinforcing positive feedback loop. Michael
creates content, which is discovered by Caroline.
Caroline consumes Michael’s content and reacts to it
by commenting or liking or reposting his content.
This motivates Michael to create or curate even
more content. This virtuous cycle increases time
spent on Webdoc per customer and activity volume
per customer. These two non-monetary benefits
contribute to Webdoc’s value capture the same way
as the number of Webdoc customers. When
Webdoc’s valuation increases some value is also
captured by the developer who receives stock-based
compensation. Finally, operating on the basis of a
pay-per use pricing mechanism, Amazon.com also
captures some value when the number of the
customers and the activity per customer increase.
The new features created by the welcome
workflow reduce the energy and time costs pertinent
to discovering people and content. The introduction
of these two features contributed to the 250%
increase in the log in rate of the Super Users, those
Third International Symposium on Business Modeling and Software Design
116

customers of Webdoc who visit the website at least
three times a week.
4.4 Strategy Implications for Webdoc
Over the past few months, Webdoc has improved the
value its customers perceive from the services it
offers, by reducing the non-monetary costs
associated with its services. These improvements
have resulted in an increase in the number of
customers, the activity and the time spent by each
customers. However, similar to any growth pattern
there are limits to this growth.
We suggest that Webdoc should also become a
platform to promote the work of the artists who are
not famous. A young Sci-Fi writer, an unknown
musician or a semi-professional painter can be the
potential new actors in Webdoc’s service system.
These people should not be merely seen as
customers. In fact, they should be taken into account
as parts of the Webdoc’s value network. Expanding
the value network results in the creation of a bigger
pie for all the organizations and people involved and
results in creating more value for customers.
5 RELATED WORK
The Value Map is an extension to the SAR (Supplier
Adopter Relationship) Diagram in (Golnam et. al,
2010; 2011; Wegmann et al., 2007). The Service
System Model is based on the System Diagram
(Rychkova et al., 2007). The SAR and the System
Diagram are parts of the Systemic Enterprise
Architecture Methodology (SEAM) (Wegmann,
2003).
SEAM was designed from the ground up with
general systems principles and serves to analyze and
to assist in the design of business and engineering
strategies. Developed at Ecole Polytechnique
Fédérale de Lausanne (EPFL), SEAM has been used
for teaching (Wegmann et al., 2007) and consulting
(Wegmann et al., 2005).
In developing the Value Map, we are also
inspired by the House of Quality (Clausing and
Hauser, 1988), a quality improvement method,
derived from Quality Function Deployment (QFD).
We integrate the Strategy Canvas (Kim and
Mauborgne, 2005) as a part of the Value Map.
Strategy Canvas is a diagnostic framework for
strategy development. It enables an organization to
visualize the competitive factors and the current
state of play of those factors within a market place
and to compare the organization’s offering with
those of the industry in general.
Business Model Canvas (Osterwalder and
Pigneur, 2010) is a strategic management tool, that
assists in the development of new, and improvement
of existing business models. It is widely recognized
as one of the most established methods for business
model design and innovation. The canvas represents
value creation and capture in business models by
nine building blocks: key partners, key activities,
key resources, value propositions, customer
relationships, channels, and customer segments.
Business Model Canvas is one of the most
established methods in the academia and industry for
business model design, development and
improvement.
To evaluate the usefulness of the Value Map we
conducted an empirical study in which we also
compared the Value Map with Business Model
Canvas. The study was conducted in form of three
workshops with 14 senior managers and executives
from a range of industries in Iran. In the first
workshop we presented the theoretical and
conceptual discussions underlying problem
structuring and business modeling. Next, we
familiarized the participants with Business Model
Canvas and presented an example illustrating its
application in business modeling. In the second
workshop, we introduced the Value Map. At the end
of the second workshop, the participants filled out a
survey questionnaire. The questions were divided
into three categories: the importance of value
creation and capture in business models, the
potential merits of modeling value creation and
capture with the Value Map and comparison of the
Value Map with the Business Model Canvas.
The results reflected that the participants
believed that Value Map helps business practitioners
understand and analyze customer value, customer
value creation, and the value capture processes.
Based on the results, this is achieved by creating a
common language that enables the representation
and the discussion of the as-is and to-be situation of
value creation and capture in an organization’s
business model. The results in general suggest that
Value Map is a useful visualization tool that
contributes to managerial decision-making processes
of business practitioners in the choice situations that
entail value creation and capture in an organization’s
business model. We learned that the Value Map
complements and augments the Business Model
Canvas by aiding the business practitioners in
representing the necessary building blocks of
business model of an organization and their inter-
relations and interconnectedness.
Value Map - A Diagnostic Framework to Improve Value Creation and Capture in Service Systems
117

A week after the second workshop, we held the
third workshop with the participants to debrief them
on the application, the potential merits and the
improvement opportunities with respect to the Value
Map. Based on the discussions, we drew the
conclusion that the Strategy Canvas can be used as
an input to the Value Map in designing the value
creation and capture processes in a business model.
These discussions also revealed a number of
improvement opportunities, such as quantification of
the qualitative concepts, improving the graphical
representation of the Value Map.
Some of the improvement opportunities
mentioned by the participants are already taken into
account in the instantiation of the Value Map in the
www.tradeyourmind.com online platform. For
instance, the inclusion of the quantitative models
that can generate numerical analyses of various
value creation and capture strategies is part of the
platform. The step-by-step model generation wizard
embedded in the www.tradeyourmind.com platform
also facilitates the development and the presentation
of the Value Map. We will try to address the
remaining points in our future work.
6 CONCLUSIONS
In this paper, we introduced the Value Map as a
problem structuring method (PSM) that aids in
conceptualization and representation of value
creation and capture in service systems. The Value
Map is grounded in the theoretical insights from
economics, management science and (services)
marketing literature, drawing principally upon work
from the past two decades on value creation and
capture, including theories, frameworks, constructs,
and other models. We illustrated the usability and
applicability of our framework by modeling value
creation and capture in Webdoc’s service system.
We also briefly presented the results of a survey
conducted to assess the usefulness of Value Map and
compare it with Business Model Canvas.
This research suffers from a number of
limitations. We used data synthesized in a single
case study to illustrate the applicability of the Value
Map. Despite the fact that the data for the case study
was gathered from a project we conducted in a
company, we believe we need to apply the Value
Map in several other contexts to be able to fully
assess the practical relevance of its representations.
Thus, in our future work we will focus on applying
the Value Map in a number prospective business
cases. This will definitely result in a better
evaluation of the applicability of the Value Map.
The second limitation of this research concerns
the empirical study we conducted to evaluate the
usefulness of the Value Map. The fact that all the
participants in the survey were from Iran and the
relatively small sample size limit the generalizability
of the findings of our research. To tackle this
limitation, the same study should be conducted
among executives and managers from different
countries.
Lastly, the articles based on which the
conceptualizations underlying the Value Map were
developed are not exhaustive. Despite the fact that
we synthesized over 30 well-cited articles on value
creation and capture that were to the best of our
knowledge seminal to the field, some relevant work
still may not have been included in the review of the
literature. Inclusion of such articles can bring in
new modeling constructs or fine-tune and improve
the existing constructs in the Value Map. Refining
our conceptualizations based on the existing work
that has not been included in the study will also be a
part of our future work.
REFERENCES
Allee, V., 2008. Value network analysis and value
conversion of tangible and intangible assets. Journal
of Intellectual Capital, 9 (1), 5-24.
Baker, M. J., 2000. Writing a literature review. The
Marketing Review, 1 (2), 219-247.
(n.d.).
Ballantyne, D., Varey, R. J., 2006. Creating value-in-use
through marketing interaction: the exchange logic of
relating, communicating and knowing. Marketing
Theory, 6 (3), 335-48.
Beer, S., 1995. The heart of enterprise. New York: John
Wiley & Sons.
Bhide, A., 2000. The origin and evolution of new
businesses: Oxford University Press on Demand.
Blomqvist, K., Kylaheiko, K., Virolainen, V. M., 2002.
Filling a gap in traditional transaction cost economics:
Towards transaction benefits-based analysis.
International Journal of Production Economics, 79
(1), 1-14.
Bowman, C., Ambrosini, V., 2000. Value Creation Versus
Value Capture: Towards a Coherent Definition of
Value in Strategy. British Journal of Management, 11
(1), 1-15.
Carson, R. T., Flores, N. E., Martin, K. M., Wright, J. L.,
1996. Contingent valuation and revealed preference
methodologies: comparing the estimates for quasi-
public goods. Land Economics, 80-99.
Clausing, D., Hauser, J. R., 1988. The house of quality.
Harvard Business Review, 66, 63-73.
Golnam, A., Regev, G., Ramboz, J., Laparde, P.,
Third International Symposium on Business Modeling and Software Design
118

Wegmann, A, 2010. Systemic Service Design:
Alaigning Value with Implementation. In: Snene, M.,
Ralyté, J. & Morin, J.-H., eds. 1st International
Conference on Exploring Services Sciences, Geneva,
Switzerland. Springer, 150-164.
Gordijn, J., Akkermans, J., 2003. Value-based
requirements engineering: Exploring innovative e-
commerce ideas. Requirements Engineering, 8 (2),
114-134.
Grönroos, C., 2006. Adopting a service logic for
marketing. Marketing Theory , 6 (3), 317-33.
Grönroos, C., 2008. Service logic revisited: who creates
value? And who co-creates? European Business
Review, 20 (4), 198-314.
Grönroos, C., 2000. Service Management and Marketing.
European Journal of Marketing, 15, 3-31.
Grönroos, C., 1979. Service marketing: a study of the
marketing function in service firms (In Swedish with
an English summary). Diss. Helsinki and Stockhold,
Hanken Swedish School of Economics, Marketing
Technique Centre and Akademilitteratur, Helsinki.
Grönroos, C., Ravald, A., 2011. Service as business logic:
implications for value creation and marketing. Journal
of Service Management, 22 (1), 5-22.
Gummesson, E., 2007. Exit services marketing - enter
service marketing. Journal of Customer Behaviour, 6
(2), 113-41.
Hart, C., 1999. Doing a literature review: Releasing the
social science research imagination: Sage
Publications Limited.
Indvik, L., 2012. Facebook Completes $730 Million
Instagram Acquisition Retrieved May, 2013, from
http://mashable.com/2012/09/06/facebook-instagram-
acquisition-complete/
Kim, W. C., Mauborgne, R. E., 2005. Blue Ocean
Strategy: How to Create Uncontested Market Space
and Make Competition Irrelevant, Harvard Business
Press.
Kothandaraman, P., Wilson, D. T., 2001. The Future of
Competition: Value-Creating Networks. Industrial
Marketing Management, 30 (4), 379-389.
Kotler, P., 2000. Marketing management, millennium ed.
Lepak, D. P., Smith, K. G., Taylor, M. S., 2007. Value
Creation and Value Capture: A Multilevel Perspective.
Academy of Management Review, 32 (1), 180-194.
Lusch, R. F., Vargo, S. L., 2006. The Service-Dominant
Logic of Marketing: Dialog, Debate, and Directions.
Armonk, New York, USA: M. E Sharpe.
Masten, S. E., Meehan, J. W., Snyder, E. A., 1991. The
costs of organization. Journal of Law, Economics, and
Organization, 7 (1), 1.
Mingers, J., Rosenhead, J., 2004. Problem structuring
methods in action. European Journal of Operational
Research, 152 (3), 530 - 554.
Moller, K., Svahn, S., 2006. Role of Knowledge in Value
Creation in Business Nets*. Journal of Management
Studies, 43 (5), 985-1007.
Nelson, R. R., Winter, S. G., 1982. An evolutionary theory
of economic change: Belknap press.
Osterwalder, A., Pigneur, Y., 2010. Business model
generation: A handbook for visionaries, game
changers, and challengers, New York: Wiley.
Parasuraman, A., Zeithaml, V. A., Berry, L., 1985. A
Conceptual Model of Service Quality and Its
Implications for Future Research. Journal of
Marketing, 49, 41-50.
Pijpers, V., Gordijn, J., 2007. e 3 forces: Understanding
Strategies of Networked e 3 value Constellations by
Analyzing Environmental Forces Advanced
Information Systems Engineering, 188-202.
Prahalad, C., Ramaswamy, V., 2004. Co-creation
Experiences: The Next Practice in Value Creation.
Journal of Interactive Marketing, 18 (3).
Pynnonen, M., Ritala, P., Hallikas, J., 2011. The new
meaning of customer value: a systemic perspective.
Journal of Business Strategy, 32 (1), 51-57.
Ritala, P., Hurmelinna-Laukkanen, P., 2009. What's in it
for me? Creating and appropriating value in
innovation-related coopetition. Technovation, 29 (12),
819-828.
Rosenhead, J., 1999. What's the problem? An introduction
to problem structuring methods. Interfaces, 26, 117-
131.
Rosenhead, J., Mingers, J., 2001. Rational analysis for a
problematic world revisited. Chichester: John Wiley
and Sons.
Rychkova, I., Regev, G., Le, L.-S., Wegmann, A., 2007.
From Business To IT with SEAM: the J2EE Pet Store
Example. Paper presented at the Enterprise Distributed
Object Computing Conference, 2007. EDOC 2007.
11th IEEE International.
Sandström, S. E., Kristensson, P., 2008. Value in use
through service experience. Managing Service Quality
, 18 (2), 112-126.
Sphorer, J., Maglio, P., 2008. The Emergence of Service
Science: Toward systematic service innovations to
accelerate co-creation of value. Production and
operations management.
Storbacka, K., Lehtinen, J., 2001. Customer Relationship
Management: Creating Competitive Advantage
Through Win-win Relationship Strategies.
Ulaga, W., 2003. Capturing value creation in business
relationships: a customer perspective. Industrial
Marketing Management, 32 (8), 677-693.
Vargo, S. L., Lusch, R. F., 2004a. Evolving to a New
Dominant Logic of Marketing. Journal of Marketing ,
68 (1), 1-17.
Vargo, S. L., Lusch, R. F., 2008. Service-Dominant Logic:
Continuing the Evolution.
Journal of the Academy of
Marketing Science, 36 (1), 1-10.
Vargo, S. L., Lusch, R. F., Akaka, M. A., 2010.
Advancing Service Science with Service-Dominant
Logic - Clarifications and Conceptual Development.
Handbook of Service Science, 133-156.
Vargo, S. L., Maglio, P. P., Akaka, M. A., 2009. On Value
and Value Co-creation: A Service Systems and
Service Logic Perspective. European Management
Journal, 26, 145-152.
Wegmann, A., 2003. On the systemic enterprise
architecture methodology (SEAM). Paper presented at
Value Map - A Diagnostic Framework to Improve Value Creation and Capture in Service Systems
119

the International Conference on Enterprise Infor-
mation Systems, Angers, France.
Wegmann, A., Regev, G., Loison, B., 2005. Business and
IT alignment with SEAM. In Proceedings of the 1st
International Workshop on Requirements Engineering
for Business Need, and IT Alignment, Paris, France.
Wegmann, A., Julia, P., Regev, G., Perroud, O.,
Rychkova, I., 2007. Early Requirements and Business-
IT Alignment with SEAM for Business. Paper
presented at the 15th IEEE International Requirements
Engineering Conference (RE'07), Delhi, India.
Weigand, H., 2009. Value EncountersñModeling and
Analyzing Co-creation of Value. Software Services for
e-Business and e-Society, 51-64.
Weigand, H., Johannesson, P., Andersson, B., Bergholtz,
M., 2009. Value-based service modeling and design:
Toward a unified view of services.
Whetten, D. A., 1989. What constitutes a theoretical
contribution? Academy of Management Review, 14 (4),
490-495.
Yu, E. S. K., 1997. Towards modelling and reasoning
support for early-phase requirements engineering.
Paper presented at the The Third IEEE International
Symposium on Requirements Engineering.
Third International Symposium on Business Modeling and Software Design
120
