
A Discrete Simulation Framework for Part Replenishment
Optimization
David Alfred Ostrowski
1
, Bradley Graham
2
and Oleg Gusikhin
1
1
Ford Resarch and Engineering, Ford Motor Company, Dearborn, U.S.A.
2
Ford Part Supplies and Logistics, Ford Motor Company, Dearborn, U.S.A.
Keywords: Supply Chain Optimization, Discrete Simulation.
Abstract: Supply Chains are difficult to plan as they involve complex relations and maintain dynamically changing
variables that influence them. In this paper, we present a discrete event simulation framework for purpose of
decision making in a replacement auto parts Supply Chain. Ford Motor’s Parts, Supply and Logistics
(PS&L) department supports a Supply Chain that represents a trade-off where parts are either maintained at
a central distribution facility or sent directly to local distribution center. This represents a compromise
between inventory transportation costs and accessibility in parts distribution. To support decisions within
this environment, we present a framework to characterize this scenario as a discrete simulation problem
allowing for the means to evaluate controls for the determination of optimal inventory (on-hand inventory
dollars), fill rate and labor costs. Our case study results demonstrate the necessary dynamics to support this
decision making process.
1 INTRODUCTION
To support a competitive advantage, Supply Chains
are continually faced with challenges of process
improvement to support adaptation to customer
demand. Effective Supply Chains are those designed
to deliver products and services in a reliable fashion
with low cost and high quality. Fluctuations in
demand and production change dynamically making
Supply Chains difficult to grasp (Shapiro and
Jeremy, 2001) (Sabri et al., 2000). One approach is
to develop Supply Chain models for analysing
operational, tactical and strategic decisions in order
to improve performance (Seppala and Holmstrom,
1997).
Supply Chain Management (SCM) can be
divided into two levels: strategic and operational
(Cooper et al., 1997) (Gunther and Meyr, 2009). The
primary objective of strategic optimization models is
to determine the most cost-effective location of
facilities (plants and distribution), flow of goods
throughout the Supply Chain and assignment of
customers to distribution centers. These types of
models do not seek to determine required inventory
levels and customer service levels. The main
purpose of optimization at the operational level is to
determine safety stock for each product at each
location, size and frequency of product batches that
are replenished or assemble, replenishment transport
and production lead times and the customer service
levels (Mentzer et al., 2001).
Uncertainty is one of the most challenging
problems in SCM making it difficult in the practical
analysis of performance (Mason-Jones and Towill,
1998) (Van der Vorst and Beulens, 2002). In the
absence of randomness, the problems of material
and product supply are eliminated. As a result, all
demands, production and transportation behaviour
would be completely resolved and therefore,
predictable. Our goal in this work is to support both
strategic and operational analysis to a Supply Chain
in light of uncertainty through the means of a
discrete simulation.
Ford Motor Parts, Supplies and Logistics
department (PS&L) maintains a Supply Chain
network that is responsible for the purchase and
distribution of Ford and Motorcraft branded service
parts for over 3000 Ford and Lincoln dealers. The
distribution network is referred to as Ford
Authorized Distribution (FAD) representing sales of
2.4B parts annually. To service dealers, Ford
Customer Service Division (FCSD) maintains 20
High Volume Distribution Centers (HVC) for high
volume parts.
467
Alfred Ostrowski D., Graham B. and Gusikhin O..
A Discrete Simulation Framework for Part Replenishment Optimization.
DOI: 10.5220/0004633004670473
In Proceedings of the 3rd International Conference on Simulation and Modeling Methodologies, Technologies and Applications (SIMULTECH-2013),
pages 467-473
ISBN: 978-989-8565-69-3
Copyright
c
2013 SCITEPRESS (Science and Technology Publications, Lda.)

Among parameters to be considered in this
Supply Chain includes the categories of demand,
allocation and controls. Each of the given scenarios
are guided by the forecast of demand with the ability
to measure true demand to determine their
performance. Many business decisions are
considered around the dynamics of this Supply
Chain, including the appropriate intervals and levels
of replenishment. When these parameters are
changed, it is difficult to understand and analyze
how they can affect customer service levels (fill),
labor, inventory levels and total inventory over time.
Viewing the Supply Chain across the entire
production process, each component is
interconnected, by materials in one direction, the
flow of orders in the other and flow of information
in both. Changes in any one of these components
usually create waves of influence that propagate
through the Supply Chain. Such waves are reflected
in inventory levels.
This paper describes the construction of a
discrete simulation framework that allows for the
exploration of scenarios across a range of forecasts.
A simulation-based program is created using a
historical demand, forecast, and inventory plan to
determine a time series output representing
inventory, fill rate and labor. The eventual goal of
this framework is to support a complete system-level
optimization. In the next section, we present a
survey of related work. Section three continues with
the discussion of our proposed methodology. Section
Four presents our test cases demonstrating the
framework and Section Five presents our
conclusions.
2 CURRENT RESEARCH
Simulation is a well-known technique for
investigating line-dependent behaviors in complex
and uncertain systems (Cooper et al., 1997). This
allows a distinct advantage over static models as
they do not incorporate dynamic aspects of the
Supply Chain that are important for it to perform.
Discrete Event Simulations (DES) are effective
techniques in Supply Chain planning by enabling
evaluation of dynamic aspects as well as influence
of variance on Supply Chains, which can be used to
support decision making (Angerhofer and
Angelides, 2000), (Kleijnen, 2005). A number of
variations of DES have been leveraged to real world
problems. One example is (Hellström and Johnsson,
2002) who applied DES to simulate the effects of
wireless identification technology as applied to unit
loads throughout a retail Supply Chain without
disrupting the actual system being modelled
(Hellström and Johnsson, 2002). (Almeder et al.,
2009) demonstrated the utility of integrating discrete
event simulation and mixed-integer linear
programming into a general framework to support
operational decisions for Supply Chain networks
(Almeder et al., 2009). Based on initial simulation
runs, cost parameters, production and transportation
times were estimated for an optimization model.
This problem was applied iteratively until the
difference between subsequent solutions were
determined. (Lee et al.,) proposed an architecture of
combined discrete-event and continuous modeling
for supply chain, which included an equation of
continuous proportion in the supply chain, thus
demonstrating the effectiveness of a combined
approach (Lee et al., 2002).
(Sabri and Beamon, 2000) supported a multi-
objective Supply Chain model to use in
simultaneous and operational planning. They were
able to incorporate production, delivery and demand
uncertainty, thus providing a multi-objective
performance vector for the entire network (Sabri and
Beamon, 2000). (Chopra and Sodhi, 2004) identified
categories of risk within the Supply Chain including
effects that include how actions that mitigate one
risk and exacerbating others. Examples include
where low inventory levels decrease the impact of
over-forecasting demand, thus simultaneously
increasing the impact of a Supply Chain disruption
(Chopra and Sodhi, 2004). Additional examples
include genetic algorithms (Altiparmak et al., 2006),
fuzzy sets (Chen and Lee, 2004), pre-emptive goal
programming (Wang et al., 2004) visual interactive
goal programming (Karpak et al., 2001) as well as
hybrid models (Aburto and Weber, 2007)
(Sarjoughian et al., 2005).
Supply Chain simulations have also explored the
affect of information flows within the supply chain
and it’s effect on the dynamics. Among this area,
(Chen et al., 2000) identified demand forecasting
and order lead times as contributing to what was
determined as the bullwhip effect. By extending
their models to multiple-stage Supply Chains with
centralized customer demand information they were
able to demonstrate that the bullwhip effect can be
reduced, but not completely eliminated, by
centralizing demand information (Chen et al.,
2000.). (Lee and Hau, 2000) also quantified the
benefits of information sharing between a simple
two-level supply chain with non-stationary end
demands. Their results suggested that the value of
demand information sharing can be quite high,
SIMULTECH 2013 - 3rd International Conference on Simulation and Modeling Methodologies, Technologies and
Applications
468
especially when demands are significantly correlated
over time (Lee et al., 2000).
3 METHODOLOGY
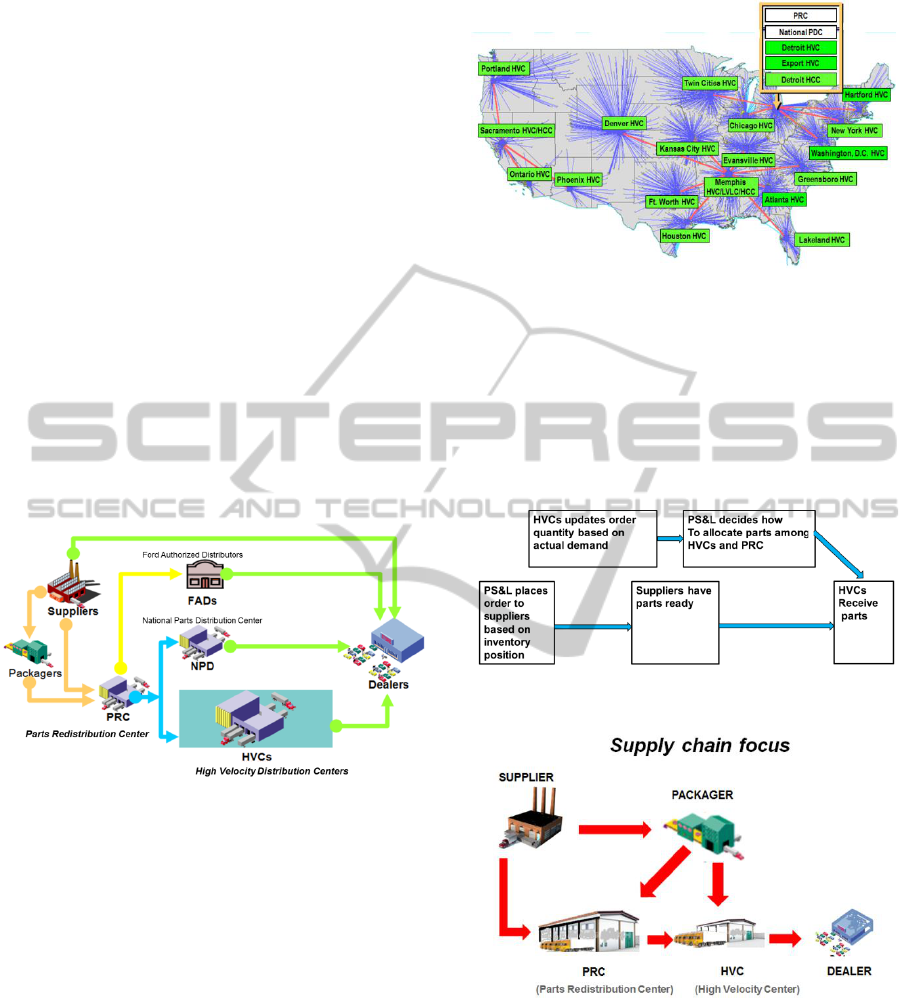
Figure 1 below details the paths in Ford PS&L’s
Supply Chain that are to be considered for our
framework. The starting points for all parts are at a
manufacturer. Each producer may either send a part
first to a packager or directly to the main
(centralized – PRC) facility. In case of emergencies,
a direct delivery may be performed, thus bypassing
the PRC or HVC locations and delivered directly to
a dealer. At the PRC, parts are either maintained in
inventory or sorted for the each of the HVCs. After
delivery to the respected centers, they are delivered
to dealers to satisfy the consumer demand.
Additional routes exist in this path including three
(low-volume) High Cube Centers (HCCs) for large
size parts as well as Ford Authorized Distributors
(retailers).
Figure 1: Overview of Supply Chain.
Figure 2. presents the main HVCs along with
associated paths for the continental US. Each dealer
has an associated sequence of HVC locations to
consider for each individual part. Also, in
conjunction with each part/dealer reference is a
described referral pattern that support the selection
process across the sequence allowing each dealer to
have a separate methodology of how to search for a
potential part through all 27 locations if necessary.
Figure 3. presents the order process along a time
line. The PS&L department maintains the inventory
positions in both the PRC and local HVCs. Order for
replenishment are executed at the PRC level and are
influenced by inventory positions as well as
forecasted demand. Suppliers have the parts ready
for the distribution network along a specified lead
time. During the lead time the HVC’s observe the
central demand and consequently updates the
Figure 2: HVC.
appropriate quantity. The PS&L department decides
how many parts to push to the HVCs and how many
parts to store at the PRC for future pull deployment.
Risk pooling is obtained by storing parts in the PRC
which is balanced with the extra cost of inventory,
storage and labor. The following figure 4. defines
the focus of our Supply chain framework
Figure 3: Order Process.
Figure 4: Supply Chain Focus.
3.1 Problem Definition
Optimization of our Supply Chain is assisted
through evaluation of past forecasts as well as
comparisons between alternative configurations. The
three primary parameters of interest in this case are
the fill rate (capability to meet demand), labor
(transportation costs) and inventory (storage costs).
A Discrete Simulation Framework for Part Replenishment Optimization
469
Two strategies exist in this problem identified as
either a “pull” or centralized inventory or a “push”
or decentralized inventory. A pull strategy may be
beneficial in scenarios in which a specific HVC
experiences a lower demand as compared to the
forecast during a suppliers production lead time. In
this case it may be beneficial to send less parts to the
HVC and store the remaining at the PRC (central
facility) The parts stored would then be able to
satisfy demand at any HVC in the future (due to the
effect of risk pooling). On the other hand if the
PS&L department decides to push parts to the HVC
regardless of the observed demand, the inventory
costs would be lower at the PRC while increasing
risk of possible redistribution costs. For the
description of our implemented framework, we first
consider the initial terms:
ltd = Lead Time Demand
fr = Fill Rate
l = Labor
OH = On-Hand Inventory
I = In-transition Inventory
T = Total Inventory
Where lead time demand is calculated as the
estimated (forecasted) demand (as a function of lead
time between the PRC to corresponding HVCs). Fill
Rate represents the ratio of backorder to demand and
is calculated as (1 – b/d). Labor is expressed as a
unit of cost of transportation from between all noted
locations. In-transition inventory is designed as the
future expected inventory of a location and T as the
total (onHand and InTransition).
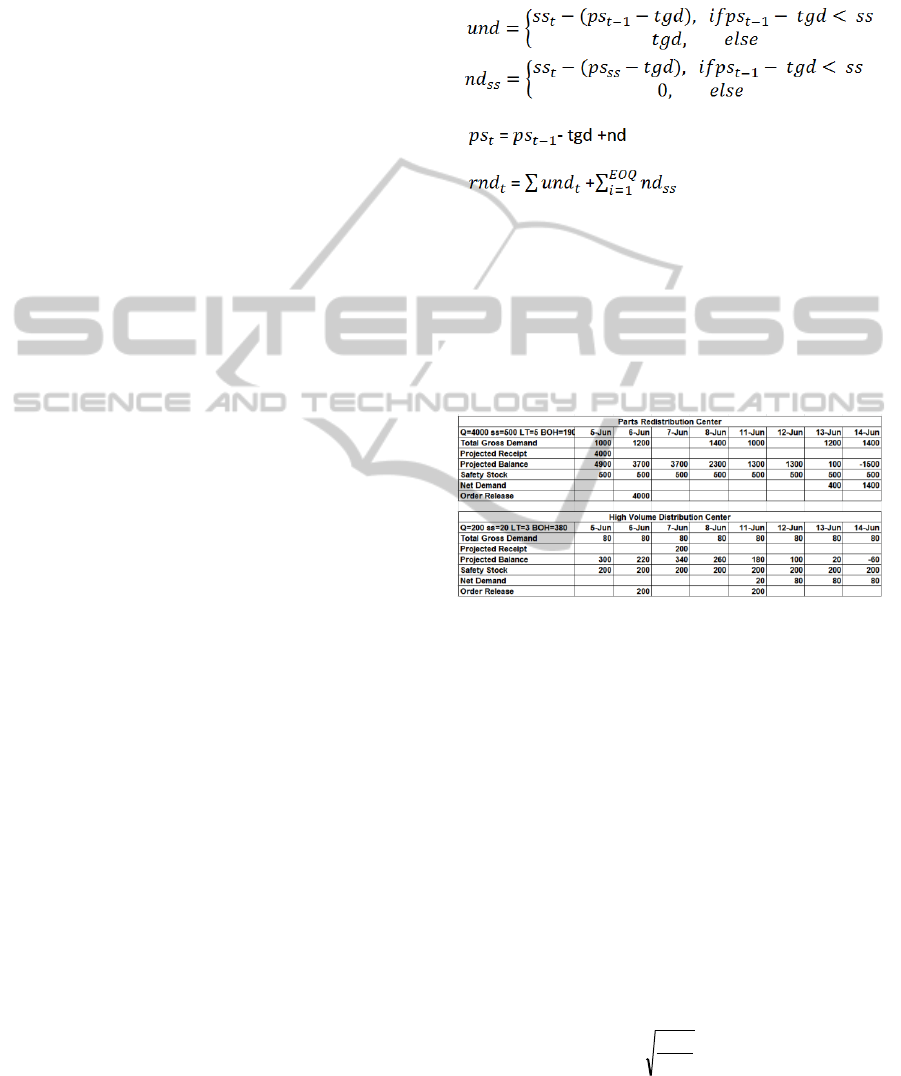
3.2 Part Ordering Policy
PS&L applies a variation of the Standard Economic
Ordering Model (EOQ) for inventory level
maintenance at each local HVC. At the end of each
period, the manager checks the inventory level
(inventory on hand plus inventory in transition) for
each part in each building (HVC). If the level is
lower than a predetermined amount (SS plus one
month forecast demand) the manager will place an
order with a predetermined amount for that part.
Within the HVC all orders are aggregated from
which they are counted against the current
inventory. Orders are also influenced by external
factors including production lot size and quantity
discount. Following is a breakdown of the formulas
that are to be applied in the context of each DRP day
of operation:
tgd = total gross demand (forecast)
tgr = total gross receipt
ps = projected stock
rnd = rounded net demand (constrained)
und = unrounded net demand (adapted)
t = time
ps =
+ tgd + rnd
Considering the following condensed spreadsheets
as an example, each day at an HVC location must
consider updated inventory positions and weight
them against the necessary forecasts. After the
dealer demand has been satisfied, updated inventory
will serve as a starting point as net demand
calculation will be utilized to influence the
allocation tiers as described in the following section.
Figure 5: PRC, HVC daily deployment.
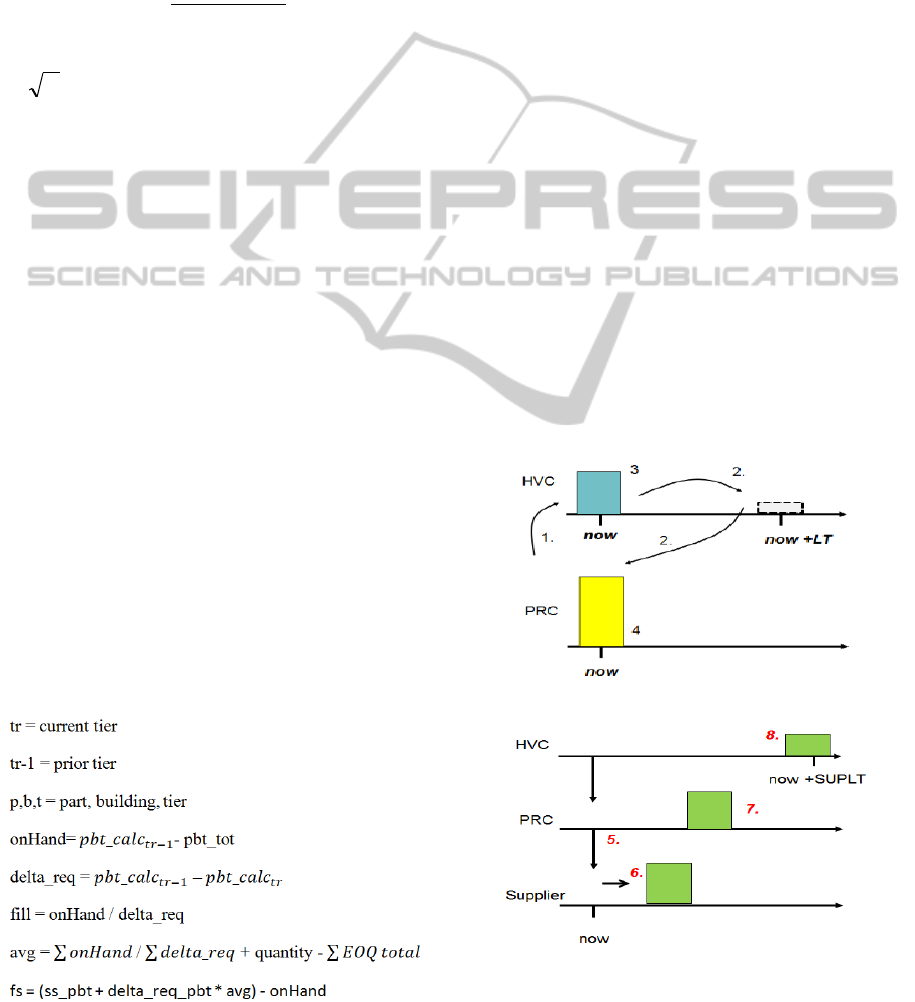
3.3 Supplier Order
Supplier order is considered at the end of every
inventory calculation at the PRC. An order to a
supplier will only occur after a set ‘freeze period’
determined as the interval by which orders may be
made to a supplier. A potential order to a supplier is
determined as the supplier shortage amount, total
gross demand of the PRC inventory, total supplier
EOQ demand subtracted by projected stock and total
gross demand
Net demand is calculated as:
min(0, D
i
+ Inv
i-1
–ss
i
+ R
i
)
The shipping quantity is an Economic order
quantity, calculated as:
EOQ
i
=
i
i
Ic
K
2
, where
K – order cost
i
- forecasted annual volume for part I
SIMULTECH 2013 - 3rd International Conference on Simulation and Modeling Methodologies, Technologies and
Applications
470
c
i
– cost of part i
I – annual interest rate (19-21%)
The safety stock is calculated based on the service
type II model.
standard deviation of demand is
equal to 1.25 multiplied by the MAD that is the
difference between the actual and the forecasted
demand. From EOQ, fill rate, and standard deviation
of the demand over the lead time L we find:
L(z) =
)1( EOQ
,
Then we find z, and calculate safety stock as: ss = z
L
3.4 Part Replenishment Policy
When parts have been received at the PRC, there are
four separate tiers of allocation that are applied. The
following sequence is followed: 1) residual
backorders, 2) regular demand 3) safety stock 4)
sum of net demand. Backorders are calculated as
previous projected stock subtracted by current total
gross demand. This is the highest level of priority as
it indicates a shortage in inventory. The LeadTime is
determined as the amount of projected demand that
is accumulated over the associated Lead Time days.
Safety Stock coverage calculated from historical
safety stock evaluations. The EOQ formula is
identified as the sum of the rounded net demand for
the next end of order quantity data. Each of these
levels are calculated on the HVC independent of the
events then an incremental building level is
designated by eliminating both the higher priority
tiers as well as current inventory (physical) position.
The value is then rounded and added among the
other tiers, to determine an upper limit for the tiers.
For extra inventory considered between the tiers of
allocation, the following calculations are applied to
allow for ameans of proportionate allocation.
Identified as the fairshare algorithm each HVC will
receive allocations based on the following
calculations:
4 SIMULATION
Our simulation considers each part independently
within our reduced configuration (supplier,
packager, PRC, MVC, dealer). This process is
detailed in eight steps as presented in the following
diagram. The system considering a single part along
with a standing inventory begins with step one in
which the HVC receives an order that has been
ordered in the past. In step two, considering the
future (forecasted) demand, an HVC will place an
order. In step three, the business day then begins in
which customers arrive and HVCs in turn satisfy a
given demand. In step four if the given demand is
short of the current inventory, an HVC will place it
on backorder. Following in step five, the PRC
aggregates orders for the HVCs then places them as
a single order to a supplier. At step six, Parts are
then ready at the suppliers at t + SUPLT (supplier
lead time). Next, in step seven the PRC’s will
allocate parts according to five separate tiers of
allocation. Finally (step eight) the day ends (where
each process begins as parts ordered arrive and then
are ready to be considered against next business day)
Figure 6: Simulation Timeline pt1.
Figure 7: Simulation Timeline pt2.
The overall simulation process description is
A Discrete Simulation Framework for Part Replenishment Optimization
471
presented in Figure 7. Four major points are
illustrated in the flow of inventory stating with the
beginning stock (1), continuing with the net demand
determining the planned amount to sell (2). Next the
supplier order is presented (3) from which the day is
wrapped up with the consideration of exactly what
amount sold (4).
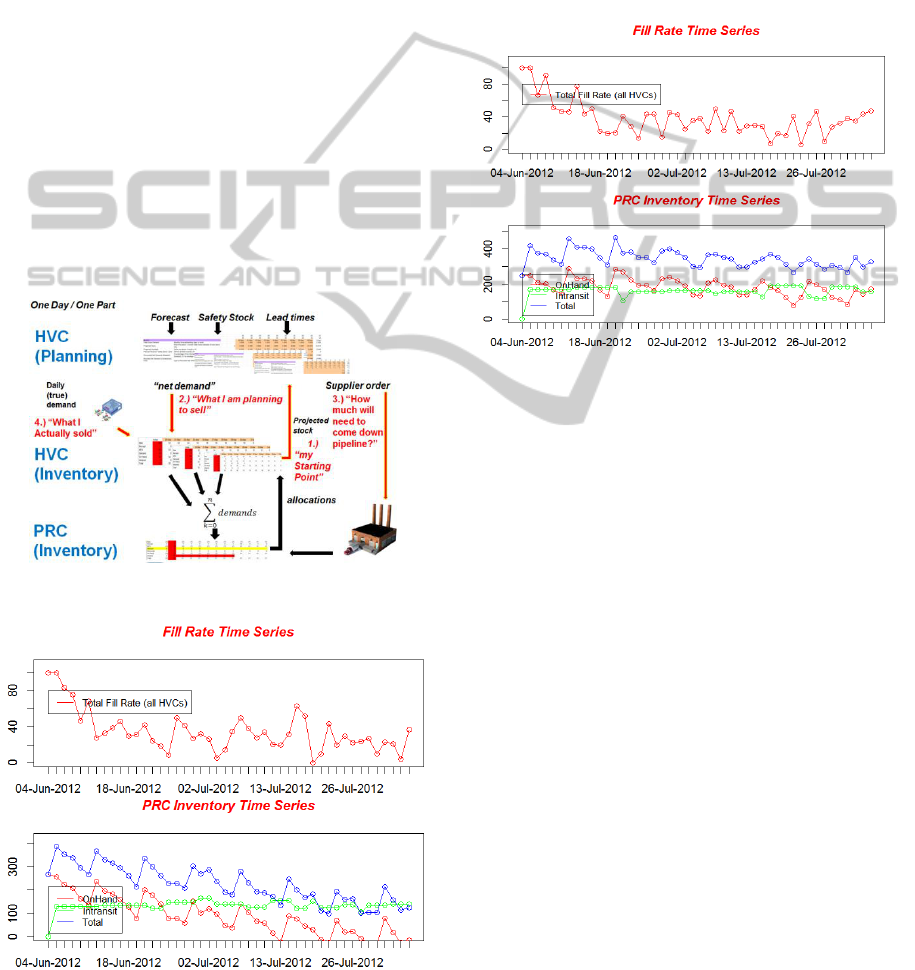
5 CASE STUDY
We examine the application of our model to support
the characterization of a Supply Chain. We examine
a single part AA5Z16138A towards these attributes.
Part AA5Z16138A maintains service to five separate
HVC centers in which each are characterized along a
historical demand for the business days between
June-4-2012 to Aug-4-2012 for each simulation run.
Considering an individual simulation, the in-transit
and total inventory levels and corresponding fill
rates are presented as a function of the established
lead times and EOQ (figure 8). Following, we
Figure 8: Simulation Overview.
Figure 9: PRC time series inventory, FL for EOQ = 3.
examine a characterization of the effect of lead time
on service levels. This is characterized along a 60
day month interval (figure 9). As noted in the
following diagram the same scenario was explored
across ranges of Economic Order Quantity (EOQ) in
which all other variables were fixed (figure 10). In
our part description – there was an issue with
regards to the demand forecast producing an
overcapacity – the demand was lowered to one part
per HVC in order to produce this effect.
Figure 10: PRC Inventory Time Series and Fill Rate
(EOQ= 6).
6 CONCLUSIONS
We have presented a framework so support a
discrete event simulation for part replenishment
optimization. Our framework considers the
interaction between a centralized facility and local
distribution centers for a parts distribution Supply
Chain. Our simulation accounts for forecast-driven
allocations to be evaluated within set configurations
including specified order intervals and lead time
demands. Supplier Orders are modelled after an
EOQ model and service replenishments are driven
by a proprietary algorithm to allow for a
proportional replenishment. Considering our
framework with an individual part, we can generate
the effects of Lead Time and EOQ over a specified
range and determine associated fill rates which may
be compared against corresponding labor and
inventory costs for a means of comparison. Future
work includes the scaling of parts evaluations as
well as incorporation of optimization methods into
this framework.
SIMULTECH 2013 - 3rd International Conference on Simulation and Modeling Methodologies, Technologies and
Applications
472

REFERENCES
Shapiro, Jeremy F. 2001. Modeling the supply chain. Vol.
971. Pacific Grove, CA: Duxbury
Sabri, Ehap H., and Benita M. Beamon. 2000. "A multi
objective approach to simultaneous strategic and
operational planning in supply chain design." Omega
28.5: 581-598.
Seppala, U, Holmstrom, J. 1997. “Rough modelling of
logistics networks”, Integrated Manufacturing
Systems, vol 6. No . 5, pp 13-20,1995
Cooper, Martha C., Douglas M. Lambert, and Janus D.
Pagh. 1997. "Supply chain management: more than a
new name for logistics." International Journal of
Logistics Management, The 8, no. 1: 1-14.
H. O. Gunther, H. Meyr. 2009. Supply Chain Planning ,
Springer-Verlag Berlin Heideberb
Mentzer, John T., William DeWitt, James S. Keebler,
Soonhong Min, Nancy W. Nix, Carlo D. Smith, and
Zach G. Zacharia. 2001."Defining supply chain
management." Journal of Business logistics 22, no. 2:
1-25.
Mason-Jones, Rachel, and Denis R. Towill. 1998.
"Shrinking the supply chain uncertainty circle." IOM
Control 24.7: 17-22.
Van der Vorst, Jack GAJ, and Adrie JM Beulens. 2002.
"Identifying sources of uncertainty to generate supply
chain redesign strategies." International Journal of
Physical Distribution & Logistics Management 32, no.
6: 409-430
Angerhofer, Bernhard J., and Marios C. Angelides. 2000.
"System dynamics modelling in supply chain
management: research review." In Simulation
Conference, 2000. Proceedings. Winter, vol. 1, pp.
342-351. IEEE
Kleijnen, Jack PC. 2005."Supply chain simulation tools
and techniques: a survey."International Journal of
Simulation and Process Modelling 1, no. 1: 82-89.
Hellström, D., and M. Johnsson. 2002. "Using discrete-
event simulation in supply chain planning." 14th
Annual Conference for Nordic Researchers in
Logistics.
Almeder, Christian, Margaretha Preusser, and Richard F.
Hartl. 2009. "Simulation and optimization of supply
chains: alternative or complementary
approaches?."Supply Chain Planning. Springer Berlin
Heidelberg, 1-25.
Lee, Young Hae, et al. 2002. "Supply chain simulation
with discrete–continuous combined
modeling." Computers & Industrial Engineering 43.1:
375-392.
Sabri, Ehap H., and Benita M. Beamon. 2000. "A multi-
objective approach to simultaneous strategic and
operational planning in supply chain
design."Omega 28.5: 581-598.
Chopra, Sunil, and ManMohan S. Sodhi. 2004. "Supply-
chain breakdown." MIT Sloan management review
(2004).
Altiparmak, Fulya, Mitsuo Gen, Lin Lin, and Turan
Paksoy. 2006. "A genetic algorithm approach for
multi-objective optimization of supply chain
networks."Computers & Industrial Engineering 51,
no. 1: 196-215.
Chen, Cheng-Liang, and Wen-Cheng Lee. 2004. "Multi-
objective optimization of multi-echelon supply chain
networks with uncertain product demands and
prices."Computers & Chemical Engineering 28, no. 6 :
1131-1144.
Wang, Ge, Samuel H. Huang, and John P. Dismukes.
2004. "Product-driven supply chain selection using
integrated multi-criteria decision-making
methodology."International journal of production
economics 91, no. 1 (2004): 1-15.
Karpak, Birsen, Erdoğan Kumcu, and Rammohan R.
Kasuganti. 2001. "Purchasing materials in the supply
chain: managing a multi-objective task." European
Journal of Purchasing & Supply Management 7, no. 3:
209-216.
Aburto, Luis, and Richard Weber. 2007. "Improved supply
chain management based on hybrid demand forecasts."
Applied Soft Computing 7, no. 1: 136-144.
Sarjoughian, Hessam S., Dongping Huang, Gary W.
Godding, Karl G. Kempf, Wenlin Wang, Daniel E.
Rivera, and Hans D. Mittelmann. 2005. "Hybrid
discrete event simulation with model predictive
control for semiconductor supply-chain
manufacturing." In Proceedings of the 37th conference
on Winter simulation, pp. 256-266. Winter Simulation
Conference
Chen, Frank, et al. 2000. "Quantifying the bullwhip effect
in a simple supply chain: The impact of forecasting,
lead times, and information." Management
science46.3 (2000): 436-443.
Lee, Hau L., Kut C. So, and Christopher S. Tang. "The
value of information sharing in a two-level supply
chain." Management science 46, no. 5 (2000): 626-643
A Discrete Simulation Framework for Part Replenishment Optimization
473
