
Automatic Annotation of Sensor Data Streams using Abductive
Reasoning
Marjan Alirezaie and Amy Loutfi
Center for Applied Autonomous Sensor Systems (AASS)
Dept. of Science and Technology,
¨
Orebro University, SE-701 82,
¨
Orebro, Sweden
Keywords:
Sensor, Semantic Perception, Abduction, Knowledge Acquisition.
Abstract:
Fast growing structured knowledge in machine processable formats such as RDF/OWL provides the opportu-
nity of having automatic annotation for stream data in order to extract meaningful information. In this work,
we propose a system architecture to model the process of stream data annotation in an automatized fashion
using public repositories of knowledge. We employ abductive reasoning which is capable of retrieving the
best explanations for observations given incomplete knowledge. In order to evaluate the effectiveness of the
framework, we use multivariate data coming from medical sensors observing a patient in ICU (Intensive Care
Unit) suffering from several diseases as the ground truth against which the eventual explanations (annotations)
of the reasoner are compared.
1 INTRODUCTION
With increasingly large sensor networks whose data is
available online, more and more effort is required to
interpret the data in order to extract meaningful infor-
mation. An inherent part of this interpretation is the
ability to annotate the signals and in particular to an-
notate interesting events with plausible explanations.
Further, for multivariate time-series data, the anno-
tation process should take into account eventual de-
pendencies which exist between signals. While, data
mining and analysis techniques are useful to reveal
the structures in the data and identify regions of inter-
est e.g. events, human supervision is still required to
provide a mapping to meaningful symbolic labels.
In this paper, we attempt to automate the labelling
process by mining the relevant knowledge from avail-
able online sources. This work puts special attention
to multivariate data where codependencies between
signals exist. Instead of manually defining rules with
which a priori explanations for events are deduced
(causes to effects reasoning), we utilize a posteriori
model (effects to causes reasoning) in terms of find-
ing the best explanation for the observations. Such
reasoning mechanisms are well suited where inter-
mixed cause and effect relations exist (such as diag-
nostic problems). Therefore, the framework is based
on abductive reasoning inferring its final results with
no predefined deductive rules.
To evaluate this work, we choose the medical do-
main due to the wealth of open-linked knowledge in
medicine. The sensor data supposed to be annotated
are 12-hours multivariate ICU (Intensive Care Unit)
data coming from medical sensors monitoring a pa-
tient. At the end, in order to measure the effectiveness
of the framework, the eventual annotations are com-
pared to the list of diseases that the patient is suffering
from.
The structure of the paper is as follows. In Sec-
tion 2 we outline a survey on related works in stream
data annotation and differentiate each of them with
our model. The paper then proceeds to concentrate
on details of the framework in Section 3. Afterwards,
Section 4 begins with a short introduction to the data
set followed by illustrative results showing how the
reasoning induces intelligible explanations from on-
tological concepts for the real sensor data. The paper
ends with the conclusion and the future works which
are mainly about the enhancements required for both
data and knowledge levels.
2 RELATED WORKS
The root of sensor data annotation is in data fusion
where the main task of fusion methods is keeping the
different types of data coming from various sensors
synchronised (Joshi and Sanderson, 1999). The focus
345
Alirezaie M. and Loutfi A..
Automatic Annotation of Sensor Data Streams using Abductive Reasoning.
DOI: 10.5220/0004623403450354
In Proceedings of the International Conference on Knowledge Engineering and Ontology Development (KEOD-2013), pages 345-354
ISBN: 978-989-8565-81-5
Copyright
c
2013 SCITEPRESS (Science and Technology Publications, Lda.)

of these methods is on raw data consolidation for the
sake of data interpretation, however, without any in-
tegration with higher level of data (symbolic knowl-
edge). For exploiting labelled data sets, works such
as (Belkacem et al., 2011) and (Alirezaie and Loutfi,
2012) use data driven approaches to classify events
that are detected on signals. The annotation process
of these works is defined as assigning a predefined la-
bel to those parts of the signal holding the behaviour
matched with this label. Although the later work, de-
spite the lack of structured knowledge related to its
sensor data retrieves more informative annotations for
signals, these two works are stringently dependent to
the labels manually provided for their data set. How-
ever, in our framework, in spite of the fact that the
event detection process is similarly based on parame-
ters set by the expert, the process is not strictly depen-
dent to these labels and the expert can change them as
he/she prefers.
Increasing in developing sensors and conse-
quently in interests on context awareness has pushed
the research towards symbolic knowledge integration
to numeric data (Abowd et al., 1999). For example,
in robotics with focus on the human robot interaction,
many works are principally working on mapping the
perception of robot into relevant concepts. The fo-
cus of works such as (Coradeschi et al., 2013) and
(Loutfi et al., 2005) is on the process of creating and
then maintaining the relations between a symbol and
raw data which are readings of sensors that observe
an object in the environment. The foundation of these
works is the background knowledge by which the re-
lations in anchoring or more general, in grounding
process, are formed. Often, an ad-hoc knowledge rep-
resentation mechanism is used with the background
knowledge modelled in the form of first order pro-
duction rules (Daoutis et al., 2009).
In addition, making use of ontologies research
works such as (Henson et al., 2011a) and (Perera
et al., 2012) benefit from the interleaved structures of
ontologies for provisioning a more efficient mapping
of observation into perception. The later one whose
domain of work is the same as ours, enriches the do-
main knowledge about sensors for healthcare by com-
paring it with the real data sources. These works,
however, use the initial base of knowledge which are
modelled in a non or semi automatic way whereas our
model considers the results of data analysis and uses
abductive reasoning with a posteriori knowledge ac-
quired automatically.
The necessity of a posteriori model implied by
the automatic knowledge acquisition approach has re-
cently emerged in the area of sensor data processing.
The work (Thirunarayan et al., 2009) applies abduc-
tive reasoning over sensor data which are interpreted
based on predefined knowledge. Other works such
as (Henson et al., 2012) and (Henson et al., 2011b),
model a system that makes it possible to infer expla-
nations from an incomplete set of observations which
are not necessarily sensor data. The reasoning frame-
work in these works is based on Parsimonious Cover-
ing Theory (PCT) (Reggia and Peng, 1986) which is
also used in this paper. Nonetheless, since the PCT in
these works is based on OWL, it is not able to provide
an explanation containing more than one cause for the
observations. Consequently, in this paper, we model
the proposed framework in Java-OWL to ensure the
communication with RDF-OWL implemented repos-
itories and to overcome the constraints of pure OWL
for PCT for abductive reasoning.
3 FRAMEWORK
In this section we introduce all the components of
the framework. Loosely speaking, our model regard-
less of occurred events, retrieves the relevant entities
from knowledge repositories (top-down) and subse-
quently sifts through knowledge using observations
coming from data (bottom-up). Depicted in Fig. 1,
this framework is composed of four components and a
Reasoner module. The Reasoner needs to have three
inputs, namely Causes, Relations and Observations
which are provided by components Cause Generator,
Relation Generator and Observation Generator, re-
spectively. The output of the system is produced by
the module called the Explanations. In the following
subsections we explain the details of the required in-
puts for the reasoning module which turns out the best
explanations for the observed situations.
3.1 Initialization
The initialization component labelled in Fig. 1 con-
tains the Configuration module which is a text file
containing settings related to signal data and their ab-
normalities. This file is filled by the expert of the do-
main and contains settings such as phenomena (i.e.
heart) being observed by sensors along with their
properties (i.e. rate). Figure 2 shows two examples of
the configuration file. Inspired from the SSN ontology
(Compton and et al, 2012), the setting terms are spec-
ified by ”feature of interest” and ”property”. In addi-
tion, other properties related to the signal behaviours
clarifying situations in which events are most likely
to occur, can be set in the ”Behaviours” section of the
file. Although it may seem that the process is depen-
dent to the manually set parameters, the eventual an-
KEOD2013-InternationalConferenceonKnowledgeEngineeringandOntologyDevelopment
346
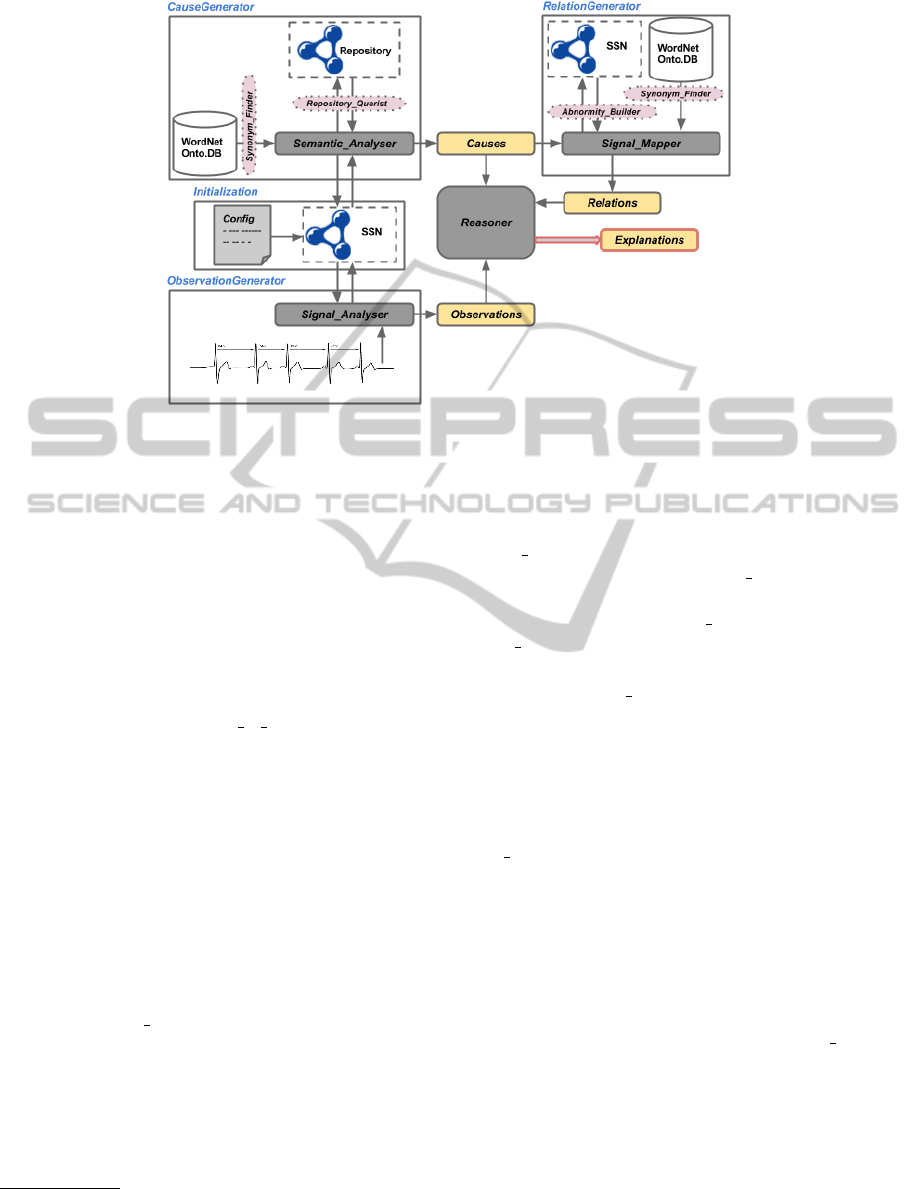
Figure 1: The Stream Data Annotation Framework.
notations of signals are not literally dependent to the
terms that the expert entered. In other words, regard-
less of the terms that the expert uses to explain the
abnormal behaviour of a sensor, the final annotation
will be unique.
The SSN ontology which is populated with the
content of the Configuration file is applied to discon-
nect the remaining parts of the framework from this
manually populated file. In this way, different com-
ponents of the system can use ontological methods to
acquire information in the Configuration. For exam-
ple, all values of the feature of interest keys in the
Configuration file are transferred to the SSN ontology
and saved there as subclasses of the ”FeatureOfInter-
est”
1
class. Moreover, all property keys in the file are
similarly copied as subclasses of the ”Property” class
in the ontology which are connected to the ”Feature-
OfInterest” subclasses via the ”has-Property” object
property.
The SSN ontology, in addition, creates a subclass
of its ”Observation” class in order to reify each ”Be-
haviours” section in the Configuration file providing
the numerical details of an abnormal behaviour in a
signal. As we will see later, during the signal anal-
ysis (Observation Generator component), once such
an abnormal behaviour is detected, an instance for this
subclass is spontaneously created. Shown in Fig. 1,
the other components transform the data independent
of the Configuration file.
1
A feature of interest can be any real-world object the
properties of which are observed by a sensor (Compton and
et al, 2012).
3.2 Generating Causes
The annotation process stems from the
Cause Generator component labelled in Fig. 1
which also contains the Semantic Analyser module.
This component is in addition composed of two
main interfaces, Repository Querist and the Syn-
onym Finder providing the ability of collaboration
with high level knowledge.
The Repository Querist interface is supposed to
search through a repository and return a hierarchy of
related concepts formatted in RDF/OWL. Consider-
ing the medical domain of this work, the NCBO Bio-
Portal is used as a repository with more than 300
linked biomedical ontologies and RDF terminologies
(Salvadores et al., 2012). Therefore, the Reposi-
tory Querist is implemented alongside of the Onto-
CAT package (Adamusiak et al., 2011) which pro-
vides high level abstraction for interacting with public
ontologies in repositories including the NCBO Bio-
Portal.
As mentioned above, we are aiming to anno-
tate medical signals that might contain abnormal
behaviours, namely symptoms of diseases. Given
the search term ”symptom”, the Repository Querist
draws all ontologies containing this term. 15 out
of 21 returned ontologies have the same domain ad-
dress and refer to different concepts of the ”Symp-
tom Ontology” which is ranked first in the returned
list. This ontology includes well-categorized medi-
cal symptoms in terms of the body part names so that
it provides an easy way to find the specific symptom
type. In other words, since the annotation in this do-
main refers to a kind of disease symptom, analysing
AutomaticAnnotationofSensorDataStreamsusingAbductiveReasoning
347

the content of the Symptom Ontology as a reference
ontology is sufficient.
Having the categorized list of symptoms, the Se-
mantic Analyser first tokenizes
2
each item into its
tokens and then passes each token through a stem-
ming
3
process. This process is followed by calling
the Semantic Analyser’s second interface, the Syn-
onym Finder. Before going to the further details, it
is worth mentioning that the tokenizing process pre-
serves all elements of a sentence (e.g. subject, object,
verb, etc.) in order to lessen the risk of information
losing.
The Synonym Finder interface using the
RiTa.WordNet
4
, is independently tasked to re-
trieve the set of synonyms of a single term defined in
the WordNet ontology. Given a token, this interface
then returns a related synonym list. Each symptom
(split into its tokens) is consequently assigned with
multiple synonym lists corresponding to its tokens.
We are particularly interested to find those symptoms
that are related to parts of the body (phenomena)
observed by sensors (i.e. heart). For this, the
Semantic Analyser counts the number of times that
the label of each phenomenon (which is already a
subclass of the ”FeatureOfInterest” class in the SSN
ontology) appears in the synonym list of each token.
As a result, the symptom item whose tokens have
the total highest number, is selected as the candidate
and then its subclasses in the Symptom Ontology are
returned.
Briefly speaking, the Semantic Analyser uses the
Synonym Finder for sifting the resulted hierarchy of
concepts and admitting those that are more pertinent
in terms of their ranks in semantic similarities. The fi-
nal Causes list shown in Fig. 1 is the union of all sub-
classes of a candidate returned per each phenomenon.
The details of this process are further illustrated in
Section 4.
3.3 Generating Relations
Labelled in Fig. 1, the Relation Generator contains
the Signal Mapper module which as such has two
interfaces, Abnormity Builder and Synonym Finder.
This component is responsible for bridging the gap
between knowledge drawn from repositories and sen-
sor observations. Defining the possible abnormal sit-
uations, the Abnormity Builder interface works based
on the ”Behaviour” section of the Configuration file
2
The process of splitting a sequence of strings into its
elements called tokens.
3
The process of reducing inflected words to their stem,
base or root form.
4
http://www.rednoise.org/rita
(a) Sample I.
(b) Sample II.
Figure 2: Configuration File Samples. (The red parts are
entered by the expert).
which are already transferred into the SSN ontology
5
.
It means that this interface works with the SSN ontol-
ogy rather than the file.
Shown in Fig. 2(a), for example, possible be-
haviours for a specific signal are defined as ”fast”,
”slow” and ”irregular”. Combining these trends with
their observed phenomenon, this module results in a
list of possible abnormalities in the signals. In other
words, this interface has the task of concatenating the
combination of the values of ”feature of interest” and
”property” keys (i.e. heart rate) with the aforemen-
tioned trends (i.e irregular). The final outcome is the
list of phrases such as ”irregular heart rate”, ”low oxy-
gen saturation”, etc.
With its Synonym Finder interface, the Sig-
nal Mapper module provides the possibility of link-
ing data behaviours to symptoms of diseases. As
we will see later, each cause coming from the Ca-
sue Generator can be either a single term or a phrase.
For each single term cause, the Synonym Finder re-
trieves its definitions from the Symptom Ontology or
from the WordNet Ontology (in case the former re-
turns nothing) and replaces the term with this defini-
tion.
At the next step, the Signal Mapper creates an
n×m similarity matrix S, where n and m are the length
of the items in the Causes list and the number of
phrases built by the Abnormity Builder, respectively.
As the details are represented in Algorithm 1 the ma-
trix S which is initialized to the zero matrix, holds the
similarity values between these two lists.
5
As the subclass of the Observation class in the SSN on-
tology (Compton and et al, 2012)
KEOD2013-InternationalConferenceonKnowledgeEngineeringandOntologyDevelopment
348

Algorithm 1: Similarity Matrix.
Data: Causes, AbnormalList
Result: S
/* The Similarity Matrix */
begin
n ← getLength(Causes)
m ← getLength(AbnormalList)
S ← getZeroMatrix(n, m)
for i ← 1 to n do
tree ← getGrammaticalTree(Cause[i])
foreach NN in the tree do
JJ ← tree.getAd jective(NN)
mainNN ← tree.getMainNoun(NN, JJ)
for j ← 1 to m do
if getProperty(AbnormalList[ j]) ∈
getSynonyms(NN) and
getBehaviour(AbnormalList[ j]) ∈
getSynonyms(JJ) and
getFeatureO f Interest(AbnormalList[ j]) ∈
getSynonyms(mainNN) then
S[i, j] ← 1
end
end
end
end
end
To measure the similarity values, the Sig-
nal Mapper needs to perform operations about gram-
matical processing over the Causes items addressing
the rows of the matrix S. To set the value of the ele-
ment s
i, j
of the matrix S, the Signal Mapper using the
StanfordParser (Marneffe et al., 2006), reads the i
th
cause and builds its grammatical structure tree. Dur-
ing this process, each word of the cause item finds
its own grammatical role such as noun (labelled by
”NN”) or adjective (labelled by ”JJ”) in the sentence.
Afterwards, all nodes of the tree having the noun role
are retrieved. For each ”NN”, the Signal Mapper col-
laborating with its Synonym Finder obtains the syn-
onym list. Moreover, the j
th
column is referring to the
abnormal behaviour that is composed by a feature of
interest (noun), behaviour (adjective) and a property
(noun). Therefore, if the synonym list of the ”NN”
contains the property name of the current column, the
process goes further as described below, otherwise it
switches to the next ”NN”.
Following the process, the Signal Mapper reads
the adjective of the ”NN” from the tree which is la-
belled by ”JJ” and similarly retrieves its synonym set.
If the ”behaviour” part of the j
th
column is also found
in the recent synonym list, and if the combination of
”JJ” and ”NN” is related to another ”NN” (by a propo-
sition) which is a synonym of the ”feature of interest”
part of the column j, the s
i, j
is set to 1.
Proceeding the above process for all elements of
the matrix S, the Signal Mapper nominates all non
zero elements as its output. These non zero elements
show the relations existing between the causes and an
abnormal behaviours. In other words, the row-column
of each candidate is considered as an item in the Re-
lations list. The resulted Relations list is regarded as
the second input of the Reasoner (Fig. 1).
3.4 Generating Observations
The Observation Generator is lastly needed to add
the information of captured events to the reasoner.
Shown in Fig. 1, it has one module called Sig-
nal Analyser doing the event detection process over
the signal. This module works based on threshold
values defined by the expert in order to localize the
events over a signal with their time points. Likewise
as Section 3.3, the module of this component works
with the SSN populated with information about the
behaviour of signals including the ranges of their val-
ues. For example, in Fig. 2(a), the ”Behaviours” sec-
tion related to the ”heart” shows the range of the heart
rate which is equivalent to an ”irregular” behaviour.
The signal analysis method in this component
works based on segmentation (Fig.4). In other words,
in an iterative process it looks for an anomaly over
one signal. Once an anomaly is found, it defines a
time interval around this. Considering the situations
of other signals during this interval, it defines a seg-
ment whose borders are set based on several parame-
ters including the number of observations (detected
abnormal behaviours) around the detected anomaly
over each signal and their average values as well.
Although the role of anomaly detection in data
annotation process is non trivial, the details of this
method is out of the scope of this paper. In fact, any
data driven event detection method would work with
this framework. Having signals labelled at time points
of anomalies, the Signal Analyser adds an item to the
Observations list for each type of anomaly detected at
each segment.
3.5 Reasoner
The Reasoner module is based on abductive reason-
ing whose basis is on the Set theory in mathematics,
with the goal of finding the best possible Explanations
for the Observations. Given three input lists (Causes,
Relations and Observations), the Reasoner calculates
the power set
6
of the Causes list to find the best ex-
planation. In other words, the items of the final Ex-
planations are subsets of the Causes list chosen based
on the reasoner principles.
6
The power set of a set is the set of all its subsets.
AutomaticAnnotationofSensorDataStreamsusingAbductiveReasoning
349

Precisely speaking, the abductive reasoning mod-
ule of this framework is based on the Parsimonious
Covering Theory (PCT) (Reggia and Peng, 1986).
According to this theory, the best explanation is de-
fined within two criteria: Covering and Minimality.
With the former criterion as shown in (1), the reasoner
nominates those subsets of the Causes list whose
items are related to all the observations detected in
a particular segment of signals:
covering = {c ⊆ Causes | ∀o ∈ Observations →
(o, c) ∈ Relations} (1)
Furthermore, the minimality criterion which is
also called irredundancy (2) considers the size of the
aforementioned selected subset. In this way, the rea-
soner is able to choose those covering subsets of the
Causes list that are minimal in terms of the cardinal-
ity.
irredundancy = {c ∈ covering | @d ⊂ c and
d ∈ covering} (2)
Algorithm 2: Abductive Reasoning.
Data: Causes, Observations, Relations
Result: Explanations
begin
/* Heuristic I: Removing
non-participant causes */
Causes← getActiveList(Causes, Relations)
Explanations←null
powerSet ← getPowerSet(Causes)
foreach ps in the powerSet do
if isCovering(ps, Observations) then
if isIrredundant(ps, Observations)
then
addExplanation(ps, Explanations)
else
/* Heuristic II: Removing
the supersets of ps */
removeSuperSet(ps, powerSet)
end
end
end
The reasoner takes above criteria into account for
each member of the power set, namely a subclass of
the Causes list. Once these two criteria hold, the rea-
soner adds the subclass to the final Explanations list
of a segment. Algorithm 2 shows the details of the
reasoner.
However, due to the exponential growth of the
power set, the reasoning process is intractable and
having a heuristic to resolve its complexity is well
advised. For this, the reasoning process applies two
heuristics: First, before calculating the power set, it
passes the Causes list through a filter to remove those
items that have not participated in any relation (in the
Relations list). Second, during the iterative process,
once the irredundancy of an element of the power set
does not hold, all other elements of the power set
which are the superset of this element are removed.
As we will see in Section 4, these heuristics reduce
the size of the Causes list and as a result the size of its
power set drastically.
Eventually, since each segment of signals is inde-
pendently analysed and separately labelled with ex-
planations, at its final step, the Reasoner calculates
the occurrence probability of each type of disease ap-
pearing in all Explanations lists. The most probable
explanations which are basically a cause or a symp-
tom of a disease (or a disease per se) are reported to
the expert.
4 EXPERIMENTS
This section first introduces the data set used in this
work and proceeds with the results obtained from
each part of the framework.
4.1 Data Set
Following the approach of data annotation, we need
to evaluate the final drawn Explanations for the Ob-
servations. For this reason, we make use of a labelled
data set which is the ICU data package provided for
use in 1994 AI in Medicine symposium submissions
(Bache and Lichman, 2013). This data set contains
12-hours time-series data come from sensors measur-
ing ”Heart Rate”, ”Arterial Pressure”, and ”Arterial
O
2
Saturation” of a 8.5 month old female infant suf-
fering from ”multiple liver abscesses”, ”portal hyper-
tension” and ”E. Coli sepsis”.
In the following, we examine our frameworks to
see how relevant the final explanations are to the dis-
eases of the aforementioned patient.
4.2 Results
Considering the signal data, the expert of the domain
initially fills the Configuration file based on his/her
idea in monitoring the patient. As mentioned before,
the process is not literally dependent to the parame-
ters set by the expert. For example, since the inter-
nal processes of the framework are basically based on
synonyms of terms, for two different configurations
shown in Fig. 2, the reasoner results in the same fi-
nal explanations. In this scenario (Fig. 2(a)), the ex-
pert fills the file for 3 sensors monitoring the ”heart”
and ”blood” of the patient, with their properties such
KEOD2013-InternationalConferenceonKnowledgeEngineeringandOntologyDevelopment
350
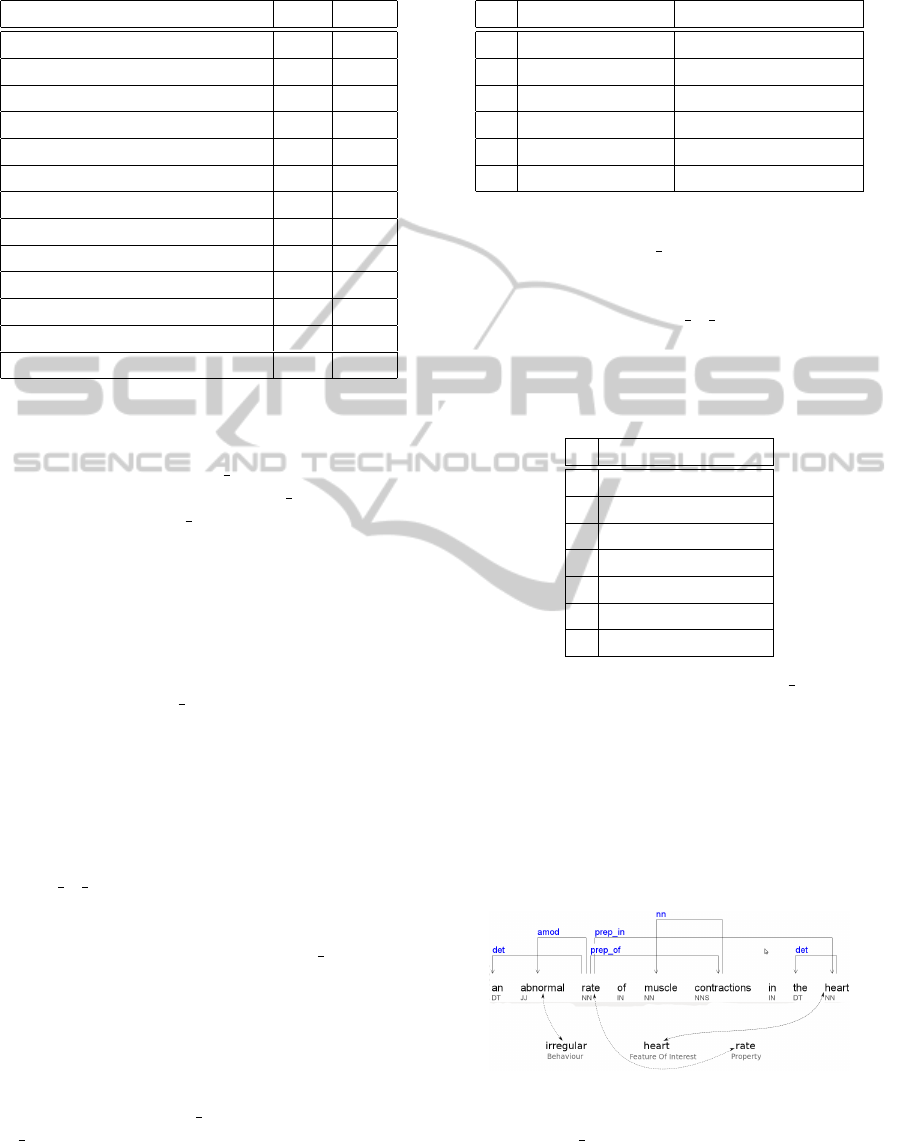
Table 1: List of Symptoms.
symptom category heart blood
abdominal symt 0 0
head & neck symt 0 0
musculoskeletal system symt 0 0
neurological & physiological symt 0 0
reproductive system symt 0 0
skin & integumentary tissue symt 0 0
digestive system symt 0 0
cardiovascular system symt 1 0
hemic system symt 0 1
nervous system symt 0 0
nutrition, metabolism symt 0 0
respiratory system & chest symt 0 0
urinary system symt 0 0
as the ”rate” (rate of heart), ”pressure” (pressure of
blood) and ”oxygen” (oxygen of blood).
After initializing the SSN ontology, the annotation
process starts from the Cause Generator component.
Given the term ”symptom” Semantic Analyser mod-
ule using its Repository Querist interface, retrieves
relevant concepts of the ”Symptom Ontology” from
the NCBO BioPortal repository. Table 1 shows all
returned symptoms categorized based on the body
parts’ names.
In order to single out those symptoms that are
more likely to be seen in our observations, each
item in Table 1 needs to be tokenized and then
stemmed. The Synonym Finder interface is called for
each pruned token and returns its synonyms list. Each
symptom item in Table 1 is consequently assigned
with multiple synonym lists corresponding to its to-
kens. As mentioned in Section 3.2, the number of
times that two terms ”heart” and ”blood” appear sep-
arately in the synonym lists can rank the symptoms in
terms of their relevance to each of these phenomena
(”feature of interest”). Using this criterion, the ”car-
diovascular system symptom” and the ”hemic system
symptom” due to their highest similarity values are
chosen (Table 1). The output of the Cause Generator,
as partially listed in Table 2, are the 30 and 32 (totally
62) concepts being in subsumption relation with the
”cardiovascular” and ”hemic” system symptoms, re-
spectively. This list is considered as the Causes list of
the framework (Fig. 1).
In order to provide the second input list of
the Reasoner, the Signal Mapper module in Rela-
tion Generator component is required to create all
possible abnormal behaviours in signals based on
what the expert has mentioned. As it is shown in Fig.
2, each sensor type has its own behaviour section in-
Table 2: List of Causes.
# Cause Symptom Group
1 arrhythmia Cardiovascular System
2 atrial fibrillation Cardiovascular System
3 postphlebitic ulcer Cardiovascular System
... ... ...
61 cyanosis Hemic System
62 hypoxemia Hemic System
dicating the probable abnormal behaviours. There-
fore, using its Abnormity Builder interface, this mod-
ule create the list of all observable events in the en-
vironment by concatenating each behaviour with the
combination of its ”feature of interest” and ”prop-
erty” values. Table 3 itemizes 7 behaviours as the
result of this process.
Table 3: Possible Abnormal Behaviours.
# Abnormal Behaviour
1 irregular heart rate
2 fast heart rate
3 slow heart rate
4 high blood pressure
5 low blood pressure
6 high blood oxygen
7 low blood oxygen
Proceeding the flow of the Relation Generator,
the process reaches to the phase of creating the simi-
larity matrix S. Each cause in Table 2 can be a single
term (i.e.”arrhythmia”) or a phrase (i.e.”atrial fibrilla-
tion”). The first step in building the matrix is replac-
ing each single term cause with its definition retrieved
from the symptom ontology (and in case of undefined
term, from the WordNet ontology). For example, the
term ”arrhythmia” is replaced with its definition: ”an
abnormal rate of muscle contractions in the heart”.
Figure 3: Grammatical Parsing Tree (arrhythmia).
The Signal
Mapper module first initializes the
62×7 matrix S to the zero matrix and then embarks to
set its elements’ values. Due to the big size of this ma-
trix, we cannot completely demonstrate it here. How-
AutomaticAnnotationofSensorDataStreamsusingAbductiveReasoning
351

ever, we concisely mention that, for instance, the el-
ement s
1,1
addressing the ”arrhythmia” and ”irregu-
lar heart rate” in its row and column, respectively, is
passed to the dependency parsing module which ex-
tracts the grammatical structure of the sentence (the
definition of the ”arrhythmia”) shown in Fig. 3. Fol-
lowing Algorithm 1, we see the term ”abnormal” is
identified as the adjective (JJ) of the term ”rate” (NN)
which is related to the term ”heart” (NN) (by a propo-
sition). This structure is quite matched with ”irregular
heart rate” phrase in the column so that the adjective
”irregular” is also found in the synonym list of the
word ”abnormal” and so on. Therefore the value of
the element s
1,1
is switched to 1.
At the end of this phase, considering the non-zero
value criterion at each column, this component totally
retrieves 18 relations (as the second input of the Rea-
soner) from the matrix S. Table 4 partially depicts
the Relations list. Counting the unique causes in Ta-
ble 4, we find that only 11 causes have participated in
the Relations list. It means that instead of analysing
the 2
62
elements of the power set, the reasoner using
the aforementioned heuristic iterates through 2
11
ele-
ments.
Table 4: Relations between Causes and Abnormal Be-
haviours
# Cause Abnormal Behaviour
1 arrhythmia irregular heart rate
2 bradycardia slow heart rate
... ...
10 hypotension low blood pressure
... ...
17 hyperemia low blood pressure
18 hypoxemia low blood oxygen
Moreover, in Observation Generator component,
the Signal Analyser discovers observations, namely
abnormal behaviours over the signals. The signal pro-
cessing method as depicted in Fig. 4, has defined 8
segments over 12-hours signal data. Each labelled
(starred) time point is regarded as an observation. To
prepare the Observations list, similar observations at
each segment are concatenated to one. For example,
for the first segment where the heart rate signal is
holding 4 similar anomalies (Fig. 4), 1 observation
is extracted as the candidate of this anomaly type in
the segment.
Given the Observations of each segment along
with the Causes and the Relations sets, the Reasoner
module following Algorithm 2 looks for the best ex-
planation for the segment.
Table 7 summarizing the Fig. 4 presents the de-
tected observations at each segment. In addition, the
Explanations list of each segment which is eventually
inferred by the reasoner is also given. It can be seen
that the Reasoner has totally assigned 6 disease types
to the 12-hours of observation. Counting the number
of each disease appearances (not the observation), we
can calculate its emerging probability.
Table 5: Disease Emerging Probability (I).
# Disease Appearance Probability
1 hypertension 31 39.2%
2 septicShock 10 12.67%
3 palpitation 10 12.67%
4 tachycardia 10 12.67%
5 hyperemia 9 11.4%
6 hypoxemia 9 11.4%
Table 6: Disease Emerging Probability (II).
# Disease Appearance Probability
1 hypertension 21 30.4%
2 Sepsis 20 29%
3 palpitation 10 14.5%
4 hyperemia 9 13.05%
5 hypoxemia 9 13.05%
Among 6 diseases listed in Table 5, the first (hy-
pertension) and second (Septic shock) ones are ad-
dressing the patient profile who is suffering from
”portal hypertension” and ”E. Coli sepsis”. Although
the rest of discovered annotations are not reported
in the data set, they are related to mentioned ones.
For example, in some references such as (Graves and
Rhodes, 1984) ”tachycardia” along with the ”hyper-
tension” are known as a sign of ”Sepsis”. It means
that if occurring the combination of the first and forth
diseases is also considered as a symptom of Sep-
sis, the probability of Sepsis will increase (Table 6).
Furthermore, the undiscovered disease of the patient,
”multiple liver abscesses” (Section 4.1), is obviously
related to the liver system which might need more
specific sensors to be diagnosed.
5 CONCLUSIONS
In this paper, we introduced a framework for the task
of automatic medical sensor data annotation which
are probable causes of detected events. Because of
its top-down view, this framework avoids to lose the
relevant cases and considers all possible causes for
anomalies observed. At the same time, its bottom-up
KEOD2013-InternationalConferenceonKnowledgeEngineeringandOntologyDevelopment
352
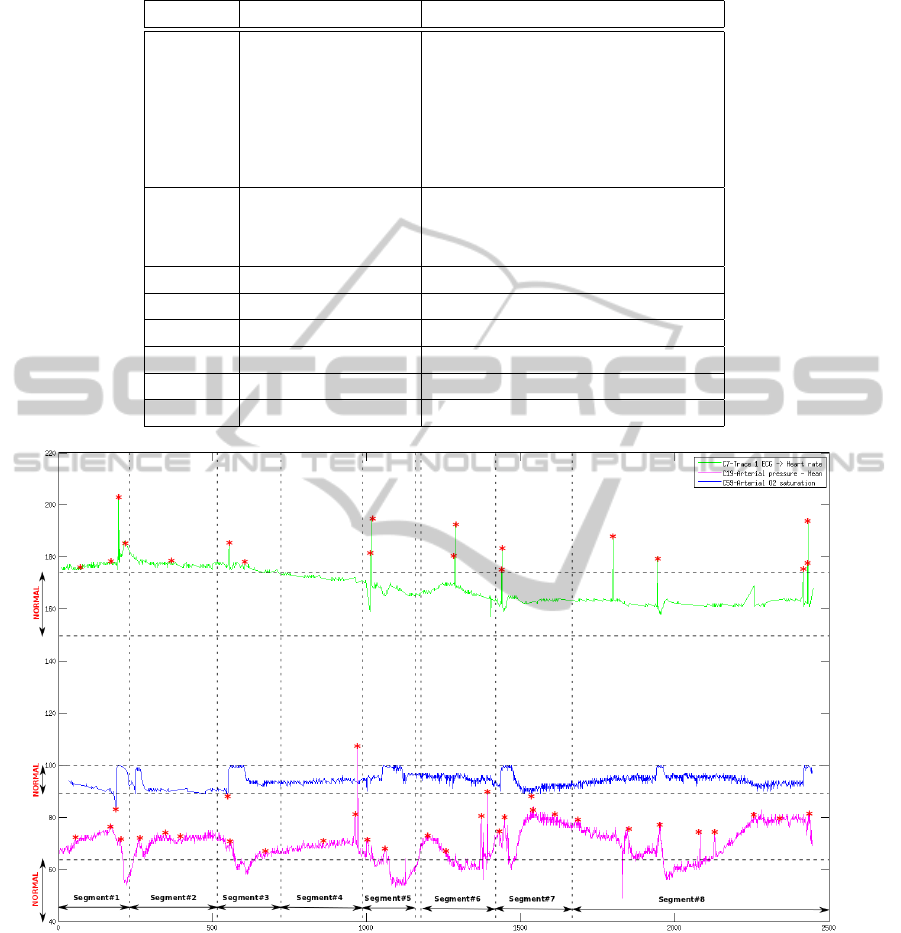
Table 7: Observations shown in Fig.4.
Segment# Observations Explanations
1 ”fast heart rate” (hypertension,hypoxemia,palpitation)
”low blood oxygen” (hypertension, palpitation,hyperemia)
”high blood pressure” (hypertension,hypoxemia,septicShock)
(hypertension,hyperemia,septicShock)
(hypertension,hypoxemia,tachycardia)
(hypertension,hyperemia,tachycardia)
2 ”fast heart rate” (hypertension,palpitation)
”high blood pressure” (hypertension,septicShock)
(hypertension,tachycardia)
3 same as segment 1 same as segment 1
4 ”high blood pressure” (hypertension)
5 same as segment 2 same as segment 2
6 same as segment 2 same as segment 2
7 same as segment 1 same as segment 1
8 same as segment 2 same as segment 2
Figure 4: Segmentation Result Over 12-Hours Data.
view helps as a sifter to remove irrelevant causes and
reduces the complexity of the reasoning process.
The only manually created module in this frame-
work is the Configuration file. Although the annota-
tion process introduced in this work is literally inde-
pendent to this file and the expert is free to explain the
behaviour of abnormal values with his/her own words,
the final explanation are drawn based on the meaning
of concepts written there. Moreover, in some situa-
tions where definition of abnormal behaviours is not
straightforward, it can be cumbersome to populate the
Configuration. Therefore, as one of the major future
steps, we are interested to replace the data analysis
method of this framework with an unsupervised data
processing method which automatically extracts fea-
tures of the signal and the expert can give up on filling
the Configuration file.
The framework has been designed to be as do-
main independent as possible. Nevertheless, an im-
portant prerequisite is to have available knowledge in
AutomaticAnnotationofSensorDataStreamsusingAbductiveReasoning
353

forms of linked-data. Due to the lack of structured
knowledge, for example, in life science, agriculture,
etc., we need to customize the framework for differ-
ent domains. For instance, in this work we used the
search term ”symptom” which has to change in other
domains. Moreover, the evaluation part of this work
would be more enriched if we examined the frame-
work for different domains. For this, as the extension
of this work, we look for different multivariate signal
data for which public linked knowledge is available.
REFERENCES
Abowd, G. D., Dey, A. K., Brown, P. J., Davies, N., Smith,
M., and Steggles, P. (1999). Towards a better under-
standing of context and context-awareness. In Pro-
ceedings of the 1st international symposium on Hand-
held and Ubiquitous Computing, HUC ’99, pages
304–307, London, UK, UK. Springer-Verlag.
Adamusiak, T., Burdett, T., Kurbatova, N., and et al (2011).
Ontocat - simple ontology search and integration in
java, r and rest/javascript. BMC Bioinformatics,
12:218.
Alirezaie, M. and Loutfi, A. (2012). Ontology alignment
for classification of low level sensor data. In KEOD,
pages 89–97.
Bache, K. and Lichman, M. (2013). Uci-machine learn-
ing repository. Irvine, CA: University of California,
School of Information and Computer Science.
Belkacem, C., Shengrui, W., and H
´
el
`
ene, P. (2011). Ac-
tivity recognition in smart environments: an informa-
tion retrieval problem. In Proceedings of the 9th in-
ternational conference on Toward useful services for
elderly and people with disabilities: smart homes and
health telematics, ICOST’11, pages 33–40, Berlin,
Heidelberg. Springer-Verlag.
Compton, M. and et al (2012). The ssn ontology of the
w3c semantic sensor network incubator group. Web
Semantics: Science, Services and Agents on the World
Wide Web.
Coradeschi, S., Loutfi, A., and Wrede, B. (2013). A short
review of symbol grounding in robotic and intelligent
systems. KI - Knstliche Intelligenz, 27(2):129–136.
Daoutis, M., Coradeschi, S., and Loutfi, A. (2009). Ground-
ing commonsense knowledge in intelligent systems.
JAISE, 1(4):311–321.
Graves, G. R. and Rhodes, P. G. (1984). Tachycardia as a
sign of early onset neonatal sepsis. Pediatr Infect Dis,
3(5):404–6.
Henson, C., Thirunarayan, K., and Sheth, A. P. (2011a).
An ontological approach to focusing attention and en-
hancing machine perception on the web. Appl. Ontol.,
6(4):345–376.
Henson, C. A., Sheth, A. P., and Thirunarayan, K. (2012).
Semantic perception: Converting sensory observa-
tions to abstractions. IEEE Internet Computing,
16(2):26–34.
Henson, C. A., Thirunarayan, K., Sheth, A. P., and , P. H.
(2011b). Representation of parsimonious covering
theory in owl-dl. In OWLED.
Joshi, R. and Sanderson, A. C. (1999). Multisensor fusion :
a minimal representation framework. Series in Intel-
ligent Control and Intelligent Automation. World Sci-
entific, Singapore, London, Hong Kong.
Loutfi, A., Coradeschi, S., and Saffiotti, A. (2005). Main-
taining coherent perceptual information using anchor-
ing. In Proc. of the 19th IJCAI Conf., Edinburgh, UK.
Online at http://www.aass.oru.se/˜ali/.
Marneffe, M., MacCartney, B., and Manning, C. D. (2006).
Generating typed dependency parses from phrase
structure parses. Technical report, LREC.
Perera, S., Henson, C. A., Thirunarayan, K., and Sheth,
A. P. (2012). Data driven knowledge acquisition
method for domain knowledge enrichment in the
healthcare. In BIBM, pages 1–8.
Reggia, J. A. and Peng, Y. (1986). Modeling diagnostic rea-
soning: A summary of parsimonious covering theory.
Comput Methods Programs Biomed, 25(2):125–34.
Salvadores, M., Alexander, P. R., Musen, M. A., and Noy,
N. F. (2012). Bioportal as a dataset of linked biomed-
ical ontologies and terminologies in rdf. SWJ.
Thirunarayan, K., Henson, C. A., and Sheth, A. P. (2009).
Situation awareness via abductive reasoning from se-
mantic sensor data: A preliminary report. In CTS,
pages 111–118.
KEOD2013-InternationalConferenceonKnowledgeEngineeringandOntologyDevelopment
354
