Carrier Frequency Specificity of Short-sound Elicited Auditory
Steady-State Response and Effect of Animation Presentation
Keita Tanaka
1
, Fumie Kudo
1
, Shinya Kuriki
2
and Yoshinori Uchikawa
1
1
Depatment of Science and Engineering, Tokyo Denki University, Ishizaka, Hatoyama, Hikigun, Saitama, Japan
2
Research Institute for Science and Technology, Tokyo Denki University, 2-1200, Muzai-Gakuendai, Inzai, Chiba, Japan
1 INTRODUCTION
The auditory steady state response (ASSR) of the
scalp potential is elicited by repetitive acoustic
stimuli with a maximum response at 35-45 Hz
repetition rate (Galambos et al., 1981). In most
previous studies using amplitude-modulated (AM)
tones of stimulus sound, long lasting tones of more
than 10 s in length were used. However,
characteristics of the ASSR elicited by short AM
tones have remained unclear. The aim of this study
was to clarify the basic characteristics of the ASSR
elicited by sequential short amplitude modulated
(AM) tones having a length of less than 1 s. We
examined how the magnitude of ASSR of
Electroencephalogram (EEG) depended on the
carrier frequency while the modulation frequency
was fixed to about 40 Hz. In the previous study,
when the stimulus amplitude was adjusted along the
equal loudness curve between 440 and 990 Hz, the
ASSR amplitude stayed constant (Kuriki et al.,
2013).
In this study, we examined the amplitude of the
ASSR in response to AM tones varying in carrier
frequencies for 290 and 3840 Hz and investigated
whether its amplitude was modulated by watching
silent animation movie.
2 METHODS
Eleven males (21-26 years), without histories of
hearing loss or neurological disorder participated in
the study. A written form of informed consent was
obtained from all of them.
The subjects sat in a chair in a sound-attenuated
chamber. In the two experiments, the subjects were
presented an auditory stimulation with a silent
animation movie and without the movie.
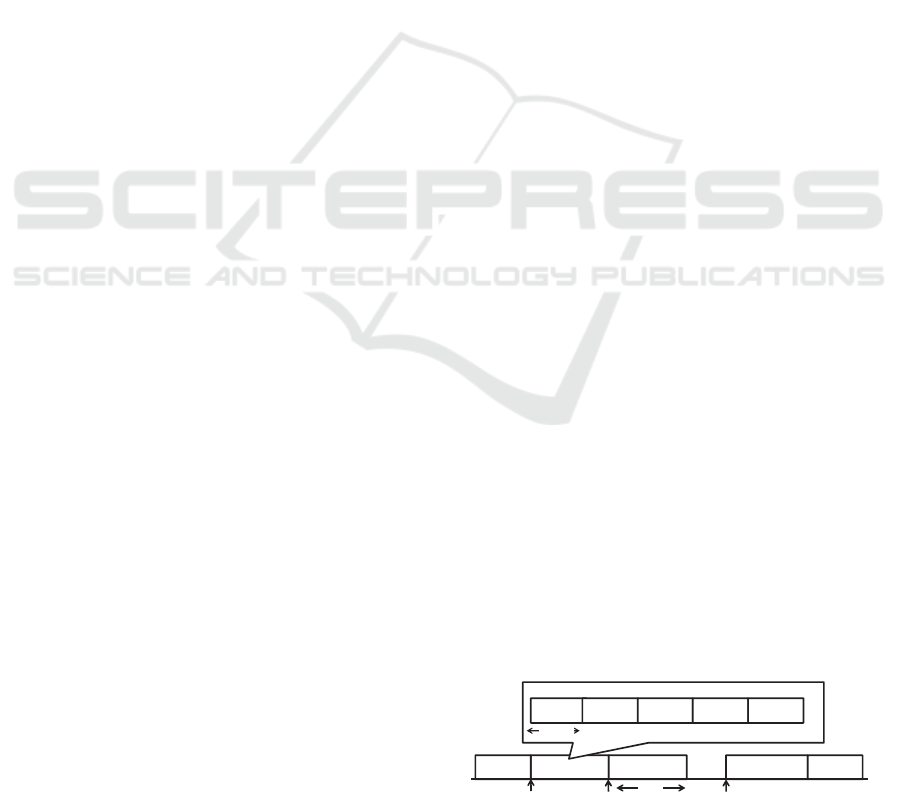
The stimulus sound was a amplitude-modulated
(AM) tones of 780 ms in length having different
carrier frequencies (f
c
) connected in series without
intermission (Fig. 1). The modulation
frequency (f
m
)
was 41.0256 Hz and the modulation depth was
100%.
The 780-ms length of each f
c
-tone included
32 cycles of modulated
waves, where transition of
the f
c
change occurred at the time of zero amplitude.
The stimulus sounds were generated with a PC at a
sampling frequency of 44.1 kHz and
presented in a
sequence of six f
c
s of 960, 3840, 1920, 480 and 240
Hz in 3.9 s. A measurement
run of EEG recording
consisted of the delivery of this stimuli
sequence.
Each subject underwent 200 measurement runs in
about
13 min.
The sound pressure level (SPL) of the AM tones
was measured
with a sound meter at the earpiece of
the sound delivery system.
The SPLs of different fc
tones were adjusted by controlling the
amplitude of
the sound signal to follow the equal loudness curve,
where the SPL at 960 Hz was set to be 70 dB.
Electrodes for EEG were placed on the vertex
(active), the posterior midline neck just below the
hairline (reference) and the nasion (grand). The EEG
signals were digitized at 1 kHz and averaged across
200 epochs of 3.9 s period (1 sequence). The
averaged data were digitally band-pass filtered 40 to
42 Hz. We obtained the amplitude of ASSR from
Hilbert-transform of the averaged waveforms under
the two conditions of with and without animation.
Figure 1: AM modulation tones and stimulus sequence.
3 RESULTS AND DISCUSSION
Figure 2 shows the waveforms of 40-Hz ASSR to
the auditory stimulation during the condition of
without animation. ASSRs to the AM tones are
1 tone row 2 tone row 200 tone row
960 Hz 3840 Hz 1920 Hz 480 Hz 240 Hz
0 s 0 .78 s 1.56 s 2.34 s 3.12 s 3.9 s
0 .78 s
240 Hz 960 Hz
・・・・・・・
3.9 s
trigger
Tanaka K., Kudo F., Kuriki S. and Uchikawa Y..
Carrier Frequency Specificity of Short-sound Elicited Auditory Steady-State Response and Effect of Animation Presentation.
Copyright
c
2013 SCITEPRESS (Science and Technology Publications, Lda.)
clearly observed in this figure.
Figure 2: ASSR waveform to the auditory stimulation
without animation presentation in one subject.
Figure 3: Hilbert transformed ASSR for S_A and S_nA
conditions.
Figure 4: Comparison of the amplitude of ASSR during
the animation (S_A) and with no animation (S_nA)
conditions. Grand-mean values across all eleven subjects
are shown for different carrier frequencies. Bars indicate
SE of the mean.
Figure 3 shows the time-course of amplitudes of
SSVEF in the averaged response for 'the sound and
animation (S_A)' and 'the sound with no animation
(S_nA)'. These waveforms were obtained from
Hilbert-transform of 40-Hz component.
Figure 4 shows the comparison of the amplitude
of ASSR during the S_A and the S_nA. Grand-mean
values across all eleven subjects are shown for
different carrier frequencies. It was found that the
amplitude of the ASSR was invariant with tone
frequencies when the level of sound pressure was
adjusted along an equal-loudness curve from 240 Hz
to 960 Hz. This was consistent with the result of 440
- 990 Hz in the previous ASSR study of MEG
(Kuriki et al., 2013). From 1920 to 3840 Hz, the
amplitude of ASSR decreased with increasing
carrier frequency. Ross et al. (2005) reported that the
amplitude of ASSR decreased in high carrier
frequency (> 1 kHz). Two way (carrier frequency
and animation conditions) ANOVA applied to the
amplitude of ASSR exhibited significant effect of a
carrier frequency. Therefore, we applied multiple
comparisons for carrier frequency. As the results, the
amplitude exhibited significant differences between
frequencies under 960 Hz and over 1920 Hz (see
figure 4).
On the other hand, no significant difference in
the amplitude was observed between the animation
and no animation conditions (n.s). Therefore,
amplitude of ASSR may not be depended on the
attention to the sounds.
This study shows that ASSR might be useful tool
for audiometry in a limited frequency band (240 Hz
- 960 Hz).
ACKNOWLEDGEMENTS
Part of this work was supported by Grants-in-Aid for
Scientific Research (B23300169) from the Ministry
of Education, Science and Culture of Japan.
REFERENCES
Galambos, R., Makeig S., Talmachoff, PJ., 1981. A 40-Hz
auditory potential recorded from the human scalp.
Proc Natl Acad Sci U S A. 78: 2643-2647.
Kuriki, S, Kobayashi Y, Kobayashi T, Tanaka K,
Uchikawa Y, 2013. Steady-state MEG responses
elicited by a sequence of amplitude-modulated short
tones of different carrier frequencies. Hear Res. 296:
25-35.
Ross, B., Borgmann, C., Draganova, R., Roberts, L.E.,
Pantev, C., 2000. A high-precision magneto-
encephalographic study of human auditory steady-
stateresponses to amplitude-modulated tones. J.
Acoust. Soc. Am. 108, 679-691.
Amplitude (μV)
-2
-1.5
-1
-0.5
0
0.5
1
1.5
2
-0.78 0 0.78 1.56 2.34 3.12 3.9 4.68
Time
(
s
)
Stimulus
960 Hz 3840 Hz 1920 Hz 480 Hz 240 Hz
0
0.4
0.8
1.2
1.6
2
-0.78 0 0.78 1.56 2.34 3.12 3.9 4.68
S_nA S_A
960 Hz 3840 Hz 1920 Hz 480 Hz 240 Hz
Amplitude (μV)
Time (s)
0
0.1
0.2
0.3
0.4
0.5
0.6
0.7
240 480 960 1920 3840
S_nA
S_A
**
****
***
***
*
*
:P<0.01,
**
:P<0.001,
***
:P<0.0001,
****
:P<0.00001
Amplitude (μV)
Frequency (Hz)
