
Keystroke Authentication with a Capacitive Display using Different
Mobile Devices
Matthias Trojahn
1
, Christian Schadewald
1
and Frank Ortmeier
2
1
Volkswagen AG, Wolfsburg, Germany
2
Otto-von-Guericke University of Magdeburg, Computer Systems in Engineering, Magdeburg, Germany
Keywords:
Keystroke Dynamics, Capacitive Display, Device Dependencies.
Abstract:
This study investigates keystroke dynamics as biometric authentication on different smartphones. We analysed
different sensors in the smartphones which affect the error rates of the authentication. We also evaluate the
effectiveness of different features based on the error rates. In addition, a framework is presented for using one
device as a base model to authenticate the same person on other devices. We conduct with an experiment with
three devices and three different keywords to assess how well different devices can be used (error rates smaller
than 3.5 %) and suitable combinations of devices. Moreover, our experiment results showed that passwords
spread over the whole keyboard have lower error rates.
1 INTRODUCTION
The loss of iPhone 3 or 4 in public places attracted
the awareness of the public because of the bad conse-
quences of leaked personal data stored on the phone.
Though we do not have an accurate number of lost
smart phones per year, we may have a rough idea by
knowing the fact – that in the cabs of London 55,000
mobile devices are forgotten in half a year (Twenty-
man, 2009).
At the same time utilizing security features of mo-
bile devices is becoming increasingly popular. Usu-
ally we are able to store sensitive data on the smart-
phone or accessing some information with apps.
In general, passwords are used as an authentica-
tion method but this is an unreliable authentication
because malicious attacks against static passwords are
mature technologies. For example, shoulder surfing
or social engineering work effectively with little or no
technical knowledge (O’Gorman, 2003). That is why,
we would like to use static passwords as well as the
keystroke during typing the password as a biometrical
feature.
However, the error rate of keystrokes is too high to
be useful. Hence, many research in recent years has
focused on decreasing theerror rates for keystroke dy-
namics. In particular, multiple classifiers are recently
introduced to this context.
However, most research focuses on minimizing
the error rates for a specific mobile device (see
(Banerjee and Woodard, 2012)). Thus, it is almost
impossible to use the learned features on different
smart phones without recalibration. It depends on
each scenario of the used device. The situations are
worse because most people have more than one de-
vice. Sometimes the devices are changed on a regular
base, sometimes two different devices are used at the
same time. In this case for each device an own enrol-
ment has to be done which is not user friendly.
Our study is to provide information about the error
rates depending on multiple mobile devices. Further-
more, we show how an enrolment model can be used
on multiple devices for authentication. For this, we
present the error rates for different feature groups on
different devices. Moreover, we define an algorithm
to convert the enrolment model of one device to dif-
ferent device.
2 THEORETICAL BACKGROUND
Biometrical authentication depends on the process
of enrolment and verification. Both processes con-
sist of different steps including data acquisition, pre-
processing and feature extraction. The last step during
enrolment is to generate and store a person record in a
database. The last step is to classify and compare the
user input with the extract features during the verifi-
cation stage (Vielhauer, 2006).
580
Trojahn M., Schadewald C. and Ortmeier F..
Keystroke Authentication with a Capacitive Display using Different Mobile Devices.
DOI: 10.5220/0004606105800585
In Proceedings of the 10th International Conference on Security and Cryptography (SECRYPT-2013), pages 580-585
ISBN: 978-989-8565-73-0
Copyright
c
2013 SCITEPRESS (Science and Technology Publications, Lda.)
On devices supplied with a physical keyboard we
can easily extract keystrokes. The duration which
represents the time between pressing and releasing
a key or the n-graphs (time between pressing one
key and the n-th key of a sequence) is a simple dy-
namic feature to be used for authentication (Chora´s
and Mroczkowski, 2007). With a capacitive display
it is also possible to extract the exact time of press-
ing keys and the time interval of different keystrokes.
Moreover, additional values could be exported, like
pressure on the device during typing (Luca et al.,
2012), the size of the fingertip or the exact X- and
Y-coordinates. These values are all used in this paper
as a feature group because for example we could ex-
tract for each pressed key the one pressure value. In
a pre-test we analysed devices with different sensors.
We found out that there are big differences, especially,
for the features pressure and size. Some devices have
more than ten times more values for the pressure com-
pared to the amount of size values. For other devices
it is the other way around. The last group is where
only one value exists for the feature pressure which
cannot be used for authentication.
After classification (normally for keystroke dy-
namics a statistical classifier or neuronal network
(Banerjee and Woodard, 2012)) the authentication
system has to decide whether accepting or rejecting
a user. For a system depending on the threshold, dif-
ferent errors occur. The first type of error is the false
acceptance rate (FAR) which represents how many in-
truders get access to the system. The second type of
error shows the amount of rejections for a person who
is in the system which is described as false rejection
rate (FRR). Both error rates are relying on the special
threshold. The point where both error rates are equal
to each other is called equal error rate (EER). All the
three error rates are used in our paper to compare the
results of different studies.
Currently in the research for smartphones with a
capacitive display by Trojahn (Trojahn and Ortmeier,
2012) a FAR of 9.53 % and a FRR of 5.88 % was
achieved. In comparison to authentication on a key-
board of a computer or on a mobile device with 12
hardware keys, these error rates are high. The error
rates are mainly associated with the length of pass-
word (Buchoux and Clarke, 2008) and the amount of
subjects. With less than 20 subjects the error rates
EER could be smaller than 2 % (Obaidat and Sadoun,
1997; Trojahn and Ortmeier, 2013). With more than
20 human subjects the EER raises up to 10 % (Clarke
and Furnell, 2006; Campisi et al., 2009). There
are some big differences between authentication on
touchscreen displays and hardware keyboards (12-
mobile phonesor computer). On touchscreen displays
there is no physical feedback whether one key was
pressed correctly or whether two keys were pressed at
the same time. Without looking at the device this in-
formation could not be tracked. In addition, the stan-
dard keyboard layout for writing text (e.g. email or
SMS) is a full featured QWERTY-layout where the
keys are smaller than the keys in a 12 key layout.
In this situation, the chance to type a wrong letter is
higher (Trojahn and Ortmeier, 2012).
Miluzzo et al. (Miluzzo et al., 2012) showed an
interesting attack on the password entry. By using
an app to record the gyroscope data while entering
the password. They were able to reach an accuracy
of over 60 % to distinguish which key was pressed.
This means for authentication with keystroke dynam-
ics the gyroscope is comparable to a biometrical char-
acteristic. In addition, during entering the password it
should disallow other apps to extract the gyroscope
data. In addition to the gyroscope, the accelerome-
ter could be used which gives information about the
general position of the device during typing.
3 EXPERIMENTAL SUBJECTS
AND PROCEDURE
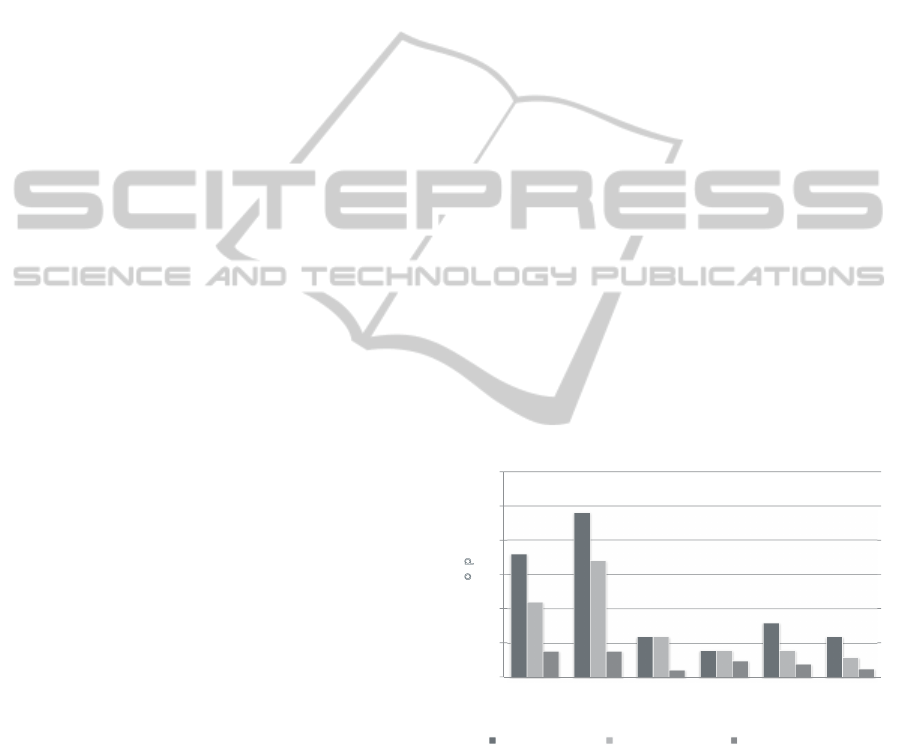
In our study 66 subjects were employed to answer the
questions and enter the keywords. Figure 1 shows the
distribution of the person related to their age.
0
5
10
15
20
25
30
under 25 25-29 30-34 35-39 40-49 over 49
number of persons
age
person per age smartphone user average usage time
Figure 1: Person per age group.
In addition, the figure shows howmuch people use
a smartphone with a touchscreen and their daily use
of various phones. Nearly 70 % of the subjects have
used at least a smartphone prior to this test. We can
easily observe the fact that the people under 30 years
are using it more than older people.
To extract data for the biometrical authentication a
keyboard layout was developed. This layout is a key-
logger which stores all input data information from
the capacitive display for each user. We disabled
KeystrokeAuthenticationwithaCapacitiveDisplayusingDifferentMobileDevices
581
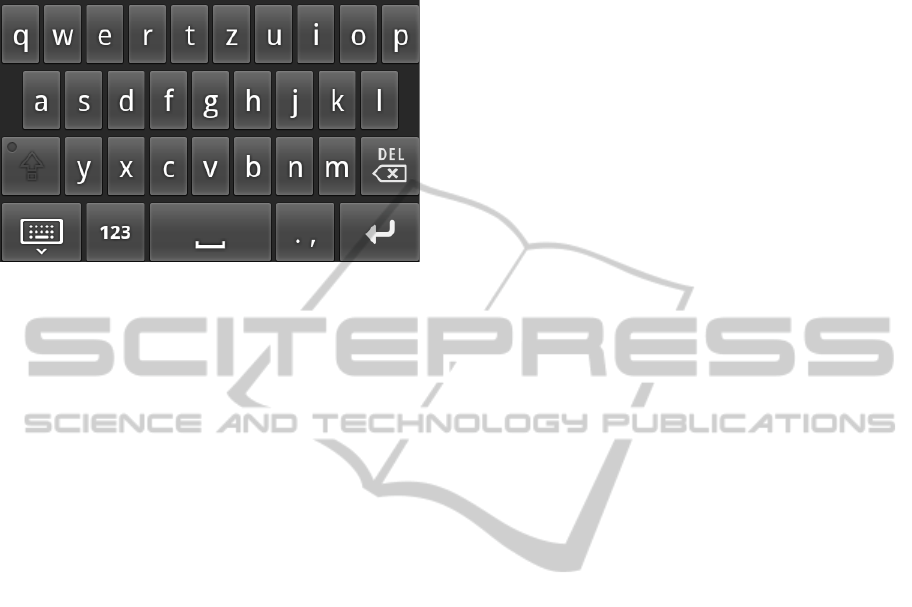
caps lock and restricted the usage only for the por-
trait alignment. A screen shot of the keyboard layout
is in Figure 2.
Figure 2: Implemented soft keyboard layout (German) for
Android OS.
Altogether, the key-logger and an application
which was designed to retrieve basic information
about the user and to perform the authentication pro-
cess were developed for Android OS.
During the tests each subject was asked to enter
some descriptive data. As descriptive data we tracked
age, sex and experience with touchscreens of the sub-
jects. Then a demo was shown where the user was
exposed to the keyboard layout and could train the
passwords to reduce the effects of learning. We se-
lected three different keywords (in German language:
“treter”, “module” and “sommer”). These three pass-
words were chosen to see whether it is important how
complex a password is. For example, the word treter
uses only three different letters which are next to each
other. On the other hand the word module is spread
over the whole keyboard. The last word sommer has
a double letter. After the demo the actual experiment
started where the subject had to enter all three pass-
words during different scenarios. Each keyword must
be entered in correctly for 20 times. If the user made
a mistake the attempt was not counted. Because dur-
ing deleting a letter the writing flow is disturbed. And
to analyze the time characters, we wanted to have 20
attempts with the same flow.
We used three pre-selected devices (Galaxy
Nexus, Samsung S2 and Samsung S3) which repre-
sent each of the defined group described in Section 2.
All of them used the Android API level 15.
After each device the user was asked to select the
used hand (left hand, right hand or both hands). All
the samples were stored on the device and later they
were transferred to a computer to do the classification
and comparison.
4 EVALUATION PROCEDURE
For analysing the different test cases of the subjects
we will address the used features and the classifica-
tion algorithm we used to retrieve results in the next
section. In the second part of this section we address
an approach to compare different devices.
4.1 Feature Extraction and
Classification Algorithm
As features we extracted the basic feature groups (du-
ration, digraph and trigraph) and the features embed-
ded on smartphones (like pressure and size).
In addition, we used the X/Y-coordinates which
represent the concrete point of the touch event. With
this information we could extract the geometrical in-
formation of keystroke. Furthermore, the three differ-
ent gyroscope values (X, Y and Z) and two from the
accelerometer (pitch and roll) were used.
For classification we used a statistical classi-
fier. The verification was based on the K-Nearest-
Neighbour classifier. For generating the model of one
person and for verification we had 20 test cases per
person and word. The first step was to delete the test
cases one to five. Then we selected from the rest 1/3
for training and 2/3 for evaluation.
4.2 Approach to Compare Different
Devices
This subsection is based on pre-test where we ex-
tracted the different features for the three devices.
All time based feature groups showed constant
changes between the devices. Di- and trigraph had
in most cases bigger time differences. This could be
explained by the different size of the keyboard. More
concretely, the dimensions of keyboard layout of the
Galaxy Nexus 6 x 5.4 cm, for the S2 5.6 x 3.5 cm and
the S3 had the following dimensions 5.8 x 3.2 cm. If
the screen is bigger, more time is needed to reach the
next letter. In contrast to this, the duration time was
in average the same over the different devices. This
means that it is not significantly affected by different
devices.
The X/Y-coordinates depend on the solution and
the dimension of the device. They could be calculated
for another device using both values.
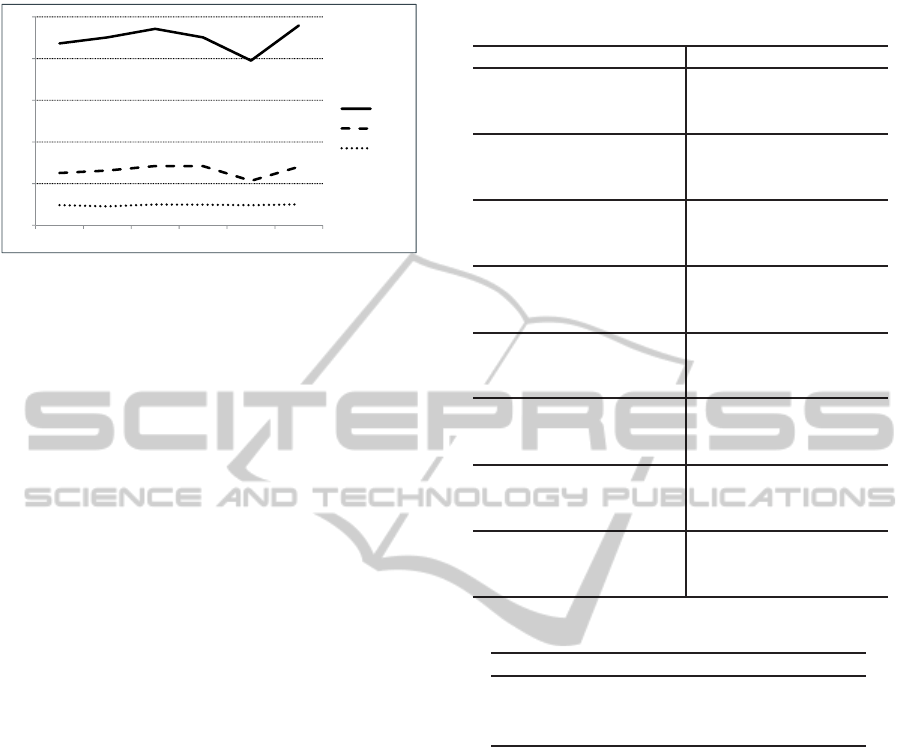
The first experiment showed that the feature
groups pressure and size are not normalised between
zero and one for every devices. Figure 3 shows the
values for the size while one person is typing on the
three different devices.
SECRYPT2013-InternationalConferenceonSecurityandCryptography
582
0
0,1
0,2
0,3
0,4
0,5
m o d u l e
Nexus
S2
S3
Figure 3: Different size values for the three devices.
In addition, the amount of different values is de-
pending of the device. The S3 has only one value
for pressure. In this situation no information could be
extracted. In the other cases the values for pressure
and size have to be normalised. With a higher amount
of different values for one feature the quality of the
feature is rising up. That means converting problems
exist if a device is used for enrolment with a lower
quality to one with a higher quality for one feature.
The gyroscope data showed no specific similari-
ties which could be calculated.
5 RESULTS
In this section, we will present at first the error rates
which can be received if one device is used for enrol-
ment and verification. Then, we show the results if
the information of an enrolment of one result is used
for another result.
5.1 Error Rates for Single Devices
From our study we extracted for each feature group
the error rates. These can be seen in Table 1.
Basically, it can be seen that the error rates of sin-
gle feature groups are depending on the special device
which is used for authentication. In these devices dif-
ferent sensors are used which are one reason for the
differences. Table 2 is showing there are big distinc-
tions between the number of different values.
The results are extracted from all test cases of the
different subjects. It shows that the S3 has only one
value for the pressure feature. This explains the high
EER of the device using pressure. With one value no
decision can be made so this feature group should not
be used for verification of a person if someone uses
the S3. Others devices like the Galaxy Nexus have
over 159 values. For the feature group size the S2 has
the most values in this experiment. It can be seen that
Table 1: Different ERRs (in %) for single feature groups in
relation to the used device and written word.
Nexus S2 S3
duration
treter
20.91 18.81 20.04
module
19.64 19.16 19.05
sommer
18.21 19.46 18.57
digraph
treter
23.02 21.73 18.17
module
17.77 17.02 14.47
sommer
14.59 15.83 14.67
trigraph
treter
24.32 22.95 21.18
module
20.43 19.44 16.27
sommer
16.1 18.28 15.67
pressure
treter
18.84 39.65 50
module
17.76 30.85 50
sommer
15.52 26.86 50
size
treter
29.34 17.44 24.75
module
28.62 16.06 24.31
sommer
26.26 15.97 22.44
XY
treter
25.77 24.94 23.2
module
27.22 26.95 22.86
sommer
20.89 20.67 22.41
gyroscope
treter
36.27 37.39 37.1
module
38.85 39.76 35.17
sommer
36.94 41.02 37.46
accelerometer
treter
31.49 19.77 22.56
module
32.91 19.93 25.53
sommer
36.28 18.89 21.38
Table 2: Amount of different values for feature groups.
pressure size X/Y-coordinates
Nexus 159 12 574 / 397
S2 10 93 384 / 296
S3 1 50 542 / 381
each device has in one category the most values and
in these special categories they have the best error rate
compared to the other devices which can be extracted
from Table 1.
Furthermore, differences between the feature
groups can be easily categorized. The basic features
(like duration, digraph and trigraph) have the best
recognition rate. In addition, some touchscreen re-
lated features (size and X/Y-coordinates) have a good
recognition rate, too. Only the feature groups pres-
sure and gyroscope values produce fair but not great
results. But, especially, the pressure depends on the
selection of the device. If the S3 is not considered
the feature group pressure has also some good error
rates. The quality of the features pressure and size are
device dependable. This will have an impact on the
device-independent authentication.
The error rates are not only depending on the se-
lected feature group. In addition, the choice of key-
word has an impact on the result. For the features
digraph, trigraph and pressure the error rates are sig-
KeystrokeAuthenticationwithaCapacitiveDisplayusingDifferentMobileDevices
583

nificant higher for the word treter. For the duration
and size the differences are smaller but still the key-
word module has the better results. Only the X/Y-
coordinates and the gyroscope show a better recog-
nition rate for the password treter. But compared
with other feature groups the recognition rate for X/Y-
coordinates and the gyroscope are insufficient.
The different recognition rates can be used to
weight the feature groups to receive better results. Ta-
ble 3 shows the error rates where all feature groupsare
used for the authentication.
Table 3: Total error rates (in %) for the test according to the
passwords and devices. Bold values are more suitable than
the other.
Nexus S2 S3
FAR FRR FAR FRR FAR FRR
treter 5.72 5.81 6.09 5.43 6.76 10.19
module 4.09 3.12 4.9 5.19 5.60 8.87
sommer
3.27 4.97 5.87 4.65 7.69 5.42
The results are similar to the results in Table 1.
In general, the word module has a higher accuracy
for all three devices. But the differences are insignif-
icant. The word sommer produces better results than
treter but in comparison to module the error rates are
marginally higher. Furthermore, it can be recognized
that it is important which device is used. The error
rates are depending on the device. The Nexus Galaxy
shows the best error rates for all words in comparison
to the other two. The worst error rates could be seen if
the S3 was used. One reason is that the feature group
pressure cannot be used.
5.2 Error Rates for Different Devices
If the same model which was generated by an enrol-
ment of one device is used for verification, on other
devices the error rates are increasing. The EER is
between 27 % and 36 %. This could not be used to
authenticate a person in a reliable manner.
For this reason, we proposed in Section 4.2 a cal-
culation for the different feature groups. If these ap-
proaches are used, better results can be reached (see
Table 4). Here, we used 100 % of the data of one
device for the enrolment and the same amount of the
information of the second device for verification.
In general, the error rates are increasing if another
device is used. Furthermore, converting from or to
the S2 shows the highest error rates. In average the
error rates are bigger than 10 %. But it is shown that
in each case the pre-processing has improved the re-
sults. Also with different devices the error rates de-
pend on the used password. The words module and
sommer are having almost every time better results
than the word treter. The S3 and the Nexus Galaxy
have nearly the same display size and the same dpi
values (308 and 315). The user has the same feeling
using both devices.
6 DISCUSSION
Differentkeywordson several deviceshave been anal-
ysed. It turned out that neither of the presented fea-
tures fulfills a single authentication for one device.
But they are depending on the keyword and device.
If a weighted fusion is used the weights for the differ-
ent feature groups should depend on the device. This
improves the error rates for an authentication on one
device. Even if the single feature group is for them
self-insufficient. At the same time not only the length
of password is important (see (Buchoux and Clarke,
2008)). We presented that passwords should be cho-
sen carefully. The experiment showed that the pass-
word should be spread around the keyboard. Espe-
cially, the n-graphs are showing better results if the
letters are not near to each other. The problem is that
the design of the QWERTY-layout is placing the most
common letters at two points to allow writing faster
with ten fingers.
Furthermore, the different quality of the sensors
in the devices does not support a device independent
keystroke authentication completely. The device must
be known previously to know which weight combina-
tion is the best and should be used for this device.
Otherwise, the error rates are not sufficient. And even
in this situation some device are producing an EER
of over 8 % which neither satisfy the security or the
usability (see the S3 in Table 3).
Moreover, an authentication where the enrolment
is done on one device and the verification on another
is without transformation not possible. But even if the
approach of this paper is used, the error rates are not
sufficient completely.
As mentioned in Section 2 the error rates are in-
creasing with a higher amount of people in the study.
Overall, we used more subjects and get the same or
better results for authentication in comparison to other
studies where a statistical classifier was used. One
reason is the growing number of different features
which can be extracted during typing.
7 CONCLUSSIONS
In this paper, we first identified the problem of
keystroke authentication on different devices. Some
SECRYPT2013-InternationalConferenceonSecurityandCryptography
584
Table 4: Error rates (in %) if different devices are used for enrolment and verification.
enrolment Nexus S2 S3
verification
S2 S3 Nexus S3 Nexus S2
FAR FRR FAR FRR FAR FRR FAR FRR FAR FRR FAR FRR
treter 12.2 18.2 10.4 8.6 12.7 12.4 13.6 13.7 7.8 5.4 12.9 10.7
module 12.8 11.8 7.6 6.1 12.8 9.6 13.2 10.7 6.0 5.9 13.3 10.2
sommer
13.4 12.2 7.6 6.2 12.6 9.1 13.3 9.6 7.9 3.7 14.1 8.0
feature groups are more robust for using them on dif-
ferent devices than other. Mostly, it depends on the
used of sensor. To observe the impact of different
sensors, we first presented the experimental proce-
dure which we designed. Furthermore, we explained
which feature, classifier and the algorithm to compare
different devices we used for authentication. Based
on these, we presented the error rates for a single de-
vice. Especially, the comparison of the different fea-
ture groups showed how features depend on the dif-
ferent device. In addition, we showed how good the
proposed algorithm works if an enrolment is done on
one device and authenticate on another.
Overall, the proposed algorithm showed an im-
provement for the error rates. With an EER of smaller
than 10 % for several devices and keywords. It is im-
portant to select a widespread password and to choose
a device with sensors which are suitable for extract-
ing keystroke dynamics (in our study Nexus Galaxy
or S2).
However, further work is planned in designing a
keystroke authentication system that supports one en-
rolment for different devices. Furthermore, we plan
to analyse whether this framework can be adapted to
tablets. Moreover, we want to analyse how the length
of the password affects the error rates.
REFERENCES
Banerjee, S. and Woodard, D. (2012). Biometric authen-
tication and identification using keystroke dynamics:
A survey. Journal of Pattern Recognition Research,
7:116–139.
Buchoux, A. and Clarke, N. L. (2008). Deployment of
keystroke analysis on a smartphone. In Proceedings
of the 6th Australian Information Security & Manage-
ment Conference.
Campisi, P., Maiorana, E., and Neri, A. (2009). User
authentication using keystroke dynamics for cellular
phones. In IET Signal Processing, volume 3, Issue: 4,
pages 333–341.
Chora´s, M. and Mroczkowski, P. (2007). Keystroke dynam-
ics for biometrics identification. In Proceedings of the
8th international conference on Adaptive and Natural
Computing Algorithms, Part II, ICANNGA ’07, pages
424–431, Berlin, Heidelberg. Springer-Verlag.
Clarke, N. L. and Furnell, S. M. (2006). Authenticating
mobile phone users using keystroke analysis. In Int. J.
Inf. Secur, volume 6, pages 1–14, Berlin, Heidelberg.
Springer-Verlag.
Luca, A. d., Hang, A., Brudy, F., Lindner, C., and Huss-
mann, H. (2012). Touch me once and i know it’s you!:
implicit authentication based on touch screen patterns.
In CHI’12, pages 987–996.
Miluzzo, E., Varshavsky, A., Balakrishnan, S., and Choud-
hury, R. R. (2012). Tapprints: your finger taps have
fingerprints. In Proceedings of the 10th international
conference on Mobile systems, applications, and ser-
vices, MobiSys ’12, pages 323–336, New York, NY,
USA. ACM.
Obaidat, M. and Sadoun, B. (1997). Verification of com-
puter users using keystroke dynamics. Systems, Man,
and Cybernetics, Part B: Cybernetics, IEEE Transac-
tions on, 27(2):261–269.
O’Gorman, L. (2003). Comparing passwords, tokens, and
biometrics for user authentication. Proceedings of the
IEEE, 91(12):2019–2020.
Trojahn, M. and Ortmeier, F. (2012). Biometric authen-
tication through a virtual keyboard for smartphones.
International Journal of Computer Science & Infor-
mation Technology (IJCSIT).
Trojahn, M. and Ortmeier, F. (2013). Toward mobile
authentication with keystroke dynamics on mobile
phones. 7th International Symposium on Security and
Multimodality in Pervasive Environment (SMPE).
Twentyman, J. (2009). Lost smartphones pose significant
corporate risk. http://www.scmagazineuk.com/lost-
smartphones-pose-significant-corporate-
risk/article/126759/. [Online; accessed 01-March-
2013].
Vielhauer, C. (2006). Biometric User Authentication for IT
Security: From Fundamentals to Handwriting. Ad-
vances in information security. Springer-Verlag.
KeystrokeAuthenticationwithaCapacitiveDisplayusingDifferentMobileDevices
585
