
BITalino
A Multimodal Platform for Physiological Computing
Jos
´
e Guerreiro
1,2
, Ra
´
ul Martins
1
, Hugo Silva
1
, Andr
´
e Lourenc¸o
1,2
and Ana Fred
1
1
Instituto de Telecomunicac¸
˜
oes, Instituto Superior T
´
ecnico, Avenida Rovisco Pais, 1, 1049-001 Lisboa, Portugal
2
Instituto Superior de Engenharia de Lisboa, Rua Conselheiro Em
´
ıdio Navarro, 1, 1959-007 Lisboa, Portugal
Keywords:
Biomedical Instrumentation, Biosignal Acquisition, Electrocardiography, Electromiography, Electrodermal
Activity, Accelerometry, Light Sensing.
Abstract:
By definition, physical computing deals with the study and development of interactive systems that sense
and react to the analog world. In an analogous way, physiological computing can be defined as the field,
within physical computing, that deals with the study and development of systems that sense and react to the
human body. While physical computing has seen significant advancements leveraged by the popular Arduino
platform, no such equivalent can yet be found for physiological computing. In this paper we present a novel,
low-cost and versatile platform, targeted at multimodal biosignal acquisition and that can be used to support
classroom activities, interface with other devices, or perform rapid prototyping of end-user applications in
the field of physiological computing. We build on previous work developed by our group, by presenting an
improved version of the BITalino platform, emphasizing on the hardware characterization, benchmarking and
design principles.
1 INTRODUCTION
Today, biosignals are increasingly gaining atten-
tion beyond the classical medical domain, into a
paradigm, which using the physical computing anal-
ogy (O’Sullivan and Igoe, 2004), can be described as
physiological computing. The modern uses of biosig-
nals have become an increasingly important topic of
study within the global engineering community and
consequently, many evidences show that biosignals
are clearly a growing field of interest; recent appli-
cations include: Human-Computer Interaction (HCI),
which involve the interface between the user and the
computer (Graimann et al., 2011); Quantified-self,
giving people new ways to deal with medical prob-
lems or improve their quality of life; and many other
disciplines.
Our first approach to the BITalino targeted the
integration of an Arduino, together with a series of
other off-the-shelve components, and a single Elec-
trocardiographic (ECG) sensor into a system, that al-
lowed real-time acquisition (Alves et al., 2013). In
this paper we extend this preliminary work, by pre-
senting a more generic acquisition platform that en-
ables the acquisition of multiple physiological sig-
nals, namely Electrocardiography (ECG), Electro-
miography (EMG), Electrodermal Activity (EDA),
and Accelerometry (ACC). Additionaly, it also pro-
vides a Light sensor and a Light-Emitting Diode
(LED).
We developed analog signal conditioning circuitry
adapted for each of the acquired signals (in terms of
gain and bandwidth). The analog signals are then fed
to a digital back-end consisting of a Micro-controller
Unit (MCU - AVR 8-bit RISC), which is directly con-
nected to a Class II Bluetooth v2.0 module (EGBT-
045MS). The BITalino platform also includes a low-
drop voltage regulator (3.3V) powered by a single
Lithium Ion Polymer battery with nominal voltage
of 3.7V and 400mAh. For system status and bat-
tery information a white and red LED, respectively,
were also included, and finally, the clock speed of the
system is sourced by an 8MHz external crystal with
±20ppm of frequency stability.
By default, the platform comes as a single board
(Figure 1), with its onboard sensors pre-connected to
analog and digital ports on the control block. How-
ever, it is designed in such way that each individ-
ual block can be physically detached from the main
board, allowing people to use it in many different con-
figurations. We developed a custom firmware, de-
signed to command the behaviour of the BITalino,
500
Guerreiro J., Martins R., Silva H., Lourenço A. and Fred A..
BITalino - A Multimodal Platform for Physiological Computing.
DOI: 10.5220/0004594105000506
In Proceedings of the 10th International Conference on Informatics in Control, Automation and Robotics (ICINCO-2013), pages 500-506
ISBN: 978-989-8565-70-9
Copyright
c
2013 SCITEPRESS (Science and Technology Publications, Lda.)
and configure multiple acquisition parameters.
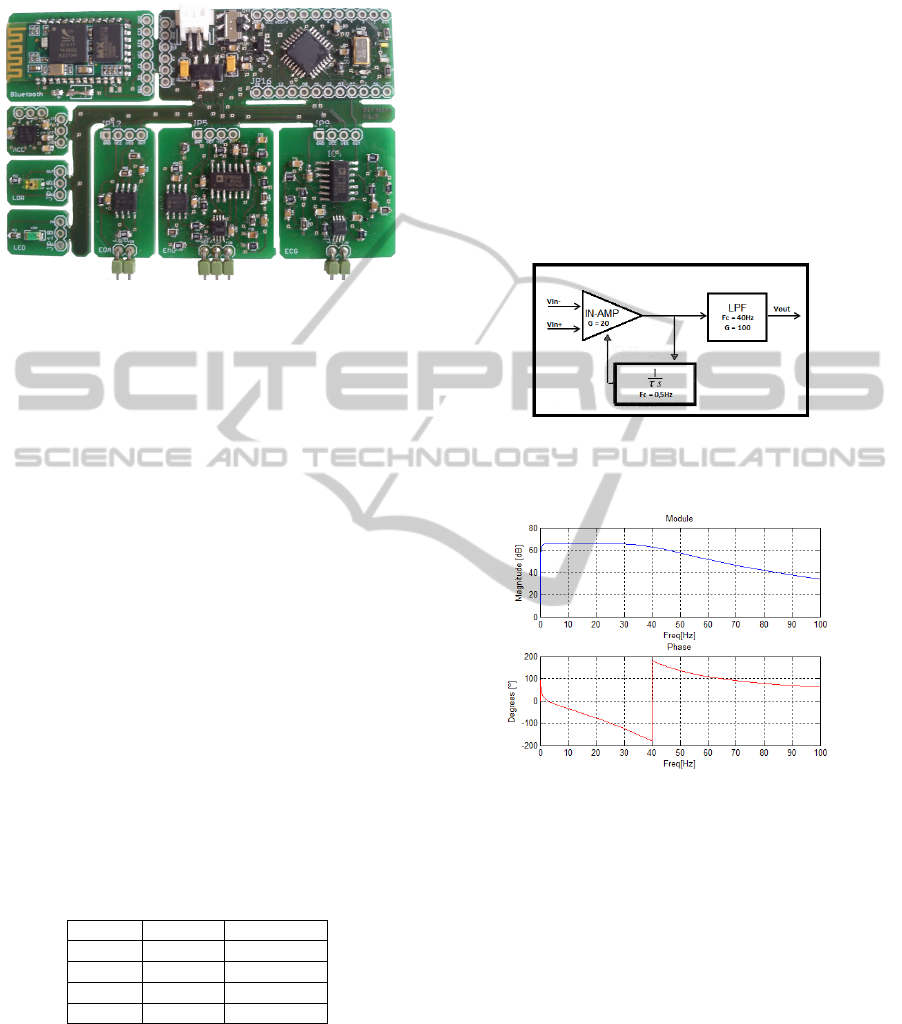
Figure 1: The BITalino platform.
The remainder of the paper is organized as fol-
lows: Section 2 describes the analog front-end; Sec-
tion 3 describes the data handling firmware logic; Ex-
perimental results are summarized in Section 4, and
finally, we outline the main conclusions and future
work in Section 5.
2 ANALOG FRONT-END
In this section we describe each of the sensors (ECG,
EMG, EDA, ACC, LDR) and the actuator (LED)
that the BITalino platform integrates. Each sensor
is single-ended and was designed according to the
nature of the signal. There are different types of
measurement principles that can be used, namely:
electrical potentials, such as ECG and EMG signals
(Malmivuo, 1995), (Webster, 2009); resistance, such
as EDA signals (Boucsein, 2011); and biomechanics
(Winter, 2004). Table 1 summarizes a few of the com-
monly used physiological signals which were the ba-
sis for our design (Webster, 2009), (Merlo and Cam-
panini, 2010), (Myong-Woo Lee, 2011).
Table 1: A few commonly used physiological signals.
Modality Range Frequency
ECG 0.5 − 4mV 0.01 − 250Hz
EMG 0.1 − 5mV 10 − 400Hz
EDA 1 − 500kΩ 0.01 − 1Hz
ACC ±1.5G 0 − 10Hz
2.1 ECG and EMG
The ECG and EMG sensors are based on voltage po-
tential differential principles. Accordingly, to mea-
sure the low potential differences associated with
these signals (in the mV range), both include a pre-
cision instrumentation amplifier (In-Amp), offering
high common-mode rejection (110dB at G ≥ 10).
Also, they have low-noise high speed operational am-
plifiers (Op-Amp) to perform bandpass filtering and
amplification.
On one hand, the ECG sensor was designed for 1-
lead measurement of the bioelectrical activity of the
heart, and it is specially designed for fingers or hands
electrode placement. However, it is also possible use
the sensor in the standard locations (e.g. chest). A
block diagram of the ECG sensor circuit can be seen
in Figure 2, and its frequency response is shown in
Figure 3. Equation 1 shows the transfer function for
this sensor.
Figure 2: Block diagram of the ECG sensor block; an In-
Amp with AC coupling to reject DC input voltages, fol-
lowed by a Butterworth 4
th
order lowpass filter.
Figure 3: Frequency response of the ECG sensor.
V
out
= (V
IN+
−V
IN−
) × 2000 +V
ss
(1)
On the other hand, the EMG sensor is used for
measuring the bioelectrical activity from the muscles,
and may be applied to any surface muscle found in
the standard locations (Hermens et al., 2000), (Bas-
majian and De Luca, 1985). A block diagram of the
EMG sensor circuit can be seen in Figure 4, and its
frequency response is shown in Figure 5. Equation 2
shows the transfer function for this sensor.
V
out
= (V
IN+
−V
IN−
) × 1000 +V
ss
(2)
2.2 EDA
The EDA sensor was designed for measuring skin re-
sistance, namely, the galvanic skin level and the gal-
vanic skin response. In which case the electrodes
BITalino-AMultimodalPlatformforPhysiologicalComputing
501
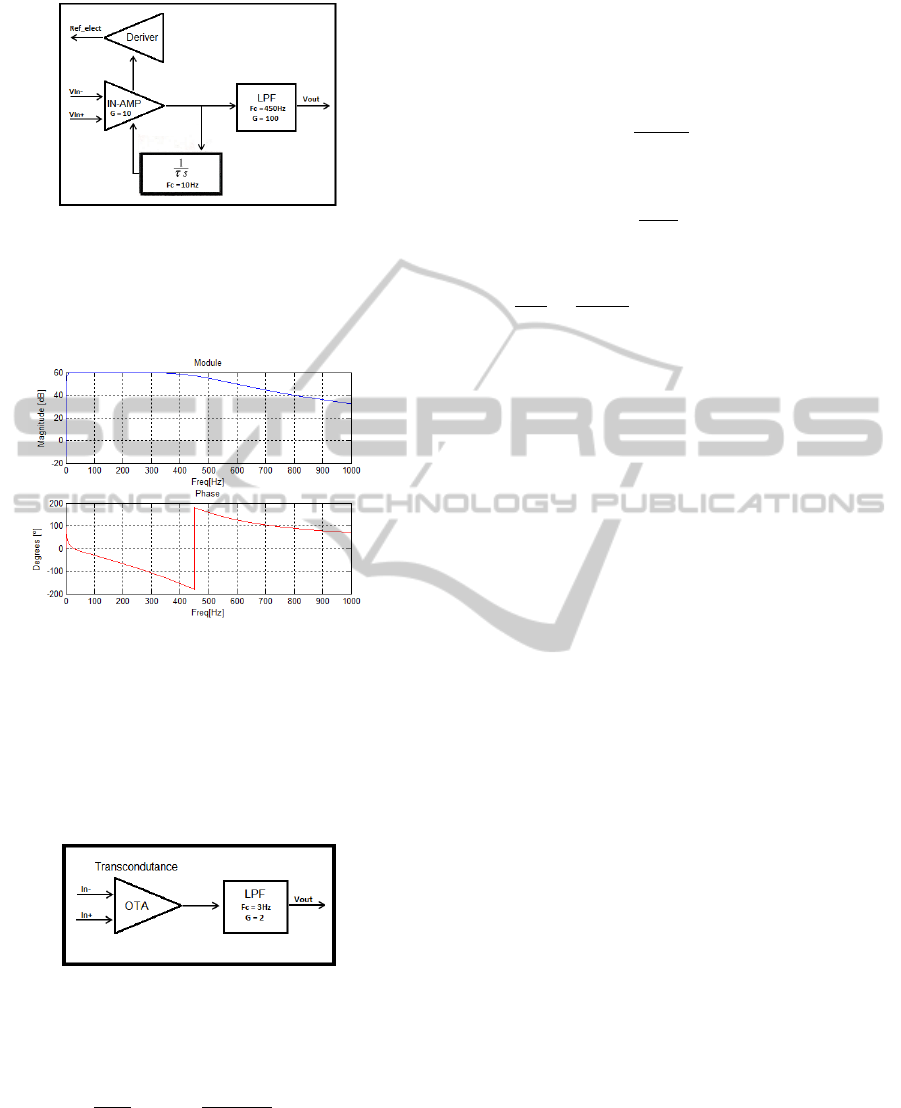
Figure 4: Block diagram of the EMG sensor block; an In-
Amp with AC coupling to reject DC input voltages, fol-
lowed by a Butterworth 4
th
order lowpass filter; a circuit
to deriving common-mode voltage is used to invert the
common-mode signal and drive it back into the user through
the reference electrode.
Figure 5: Frequency response of the EMG sensor block.
are applied at the hand palms or fingers, allowing the
measurement of the variations in the skin resistance
originated by sweat duct secretion activity. This sen-
sor is based on an Operational Transcondutance Am-
plifier (OTA) circuit, whose input voltage produces
an output current. The block diagram of this circuit is
shown in Figure 6.
Figure 6: Block diagram of the EDA sensor block; an OTA
followed by a 1
st
order lowpass filter.
Equation 3 shows the transfer function of this cir-
cuit.
V
out
= (−
R
skin
R
×V
cc
+
R + R
skin
R
×V
ss
) × G (3)
As described in (Boucsein, 2011), the typical skin
resistance values range between 1kΩ ≤ R
skin
≤ 500kΩ
when injecting a DC current. Assuming R = 500kΩ
then:
• R
skin
= 1kΩ −→ V
out
' V
cc
;
• R
skin
= 500kΩ −→ V
out
' 0.
The value of the resistance R defines the value of the
current injected in the user skin. In this case we as-
sume that V
cc
= 3.3V , then:
I
skin
=
3.3V
500kΩ
= 6.6µA (4)
Considering a sampling resolution of 10 bits, then:
4V =
3.3V
2
10
= 3.2mV (5)
As such, the resistance resolution of the circuit is:
4C =
I
skin
4V
=
6.6µA
3.2mV
= 2.06mΩ
−1
−→ 4R = 485Ω
(6)
As highlighted in Equation 6, the resolution of the
circuit is delimited by the value of the injected cur-
rent.
2.3 Other Features
In order to maximize the range of applications and
provide a more versatile platform. BITalino also in-
tegrates an accelerometer, a light sensor and a LED.
The accelerometer can be used for measuring biome-
chanical events (e.g. walking patterns, step count-
ing, or physical activity). To enable the creation of a
complete 3-axis acceleration measurement system, a
small and low power accelerometer module was used
(ADXL335), allowing a full-scale range of ±3G and
analog outputs. In our design, the bandwidth was se-
lected with a range of 0.5 − 50Hz for all axis (x, y,
z).
The light sensor can be used for optical synchro-
nization with external sources or for ambient light
sensing. This sensor acts as an NPN transistor (photo
transistor); the more the sensor is exposed to light, the
stronger is the base bias. The device is sensitive to the
spectral bandwidth range of 360−970nm. Finally, the
LED actuator can be used for synchronization with
image capture external devices.
3 FIRMWARE
As previously mentioned, the firmware defines the
overall behaviour of the system, and controls the data
streaming over Bluetooth. The system allows the ac-
quisition of 6 analog input ports (4 with 10 bit + 2
with 6 bit), and also exposes 8 digital ports (4 input
+ 4 output). The system has three operation modes,
and has a set of commands that can be used to con-
figure the device. The global operation workflow is
represented in Figure 7.
ICINCO2013-10thInternationalConferenceonInformaticsinControl,AutomationandRobotics
502
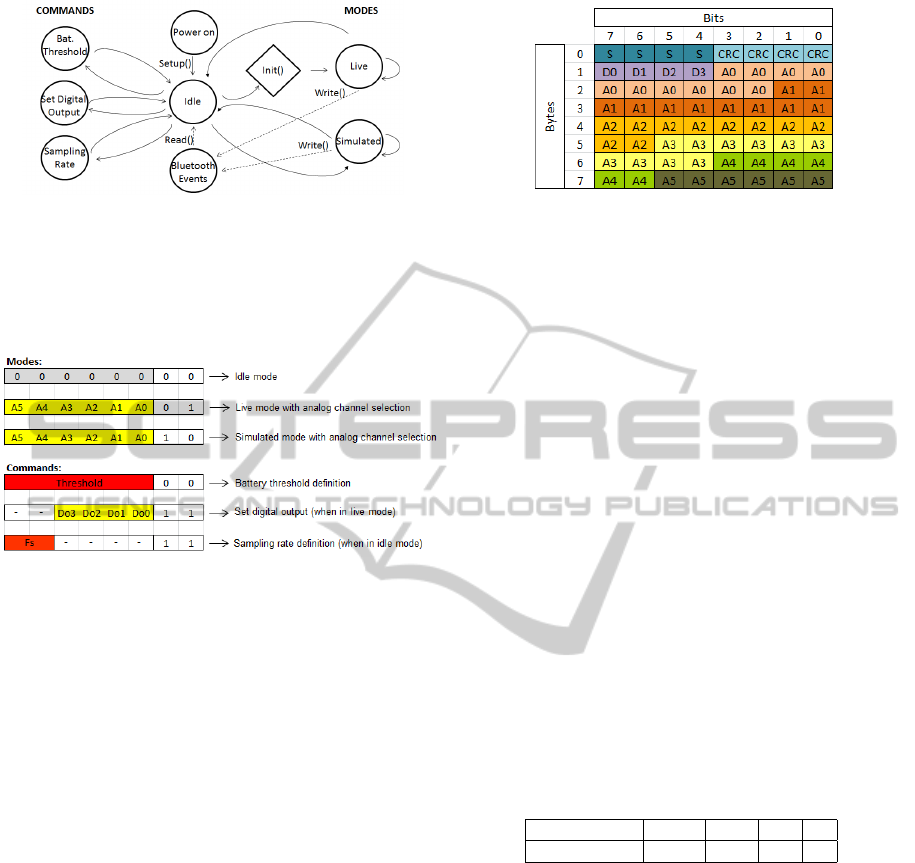
Figure 7: State diagram of the firmware operation.
The configurable settings on the system are
changed by sending 1 byte commands from the base
station to the device; Figure 8 summarizes the modes
and commands that are recognized by the system.
Figure 8: Modes and commands of the system operation.
3.1 Modes
a) Idle: The system disables any mode in which it
is in, and stays in standby until it receives a com-
mand from the base station to change mode or ad-
just settings;
b) Live: In this mode, the system continuously sam-
ples all input analog and digital channels, packs
the data into a set of bytes, and sends the data
packets through the USART controller. In order to
make the most efficient use of the available band-
width on the communication channel, the packet
is optimized and its size depends on the number
of channels acquired in each period. The packet
has a maximum size of 8 bytes and a minimum
size of 3 bytes; it includes also a sequence num-
ber and a 4-bit Cyclic Redundancy Check (CRC),
based on a Linear Feedback Shift Register (LSFR)
function, to enable the detection of possible errors
in the message. This packing process is done us-
ing bitwise operators, and the packet structure can
be seen in Figure 9.
c) Simulated: Although it is similar to what is done
in the Live mode; in this mode the system will
simulate the acquisition, transmitting synthesized
signals. These correspond to sinusoidal (A2-A4)
and square waves (D0-D3), white noise (with
Figure 9: Data packet structure.
Normal Distribution) (A1) and a synthetic ECG
wave (A0). The data packet structure is the same
as before. This way, the communication and inter-
action between the base station and the device can
be tested, without having the system connected to
a user.
3.2 Commands
a) Threshold: This command is used to define the
threshold for the low battery LED indication. One
of the analog input ports (A5) is continuously ac-
quiring the voltage level of the battery; when the
level is lower than the threshold initially defined,
the red LED integrated in the system is turned on.
b) Set Digital Output: With this command, the sys-
tem activates or deactivates the physical digital
output ports, according to the information on the
channel mask.
c) Sampling Rate: This command is used to define
the sampling rate for data acquisition; Table 2
presents the valid options for this command.
Table 2: Sampling rate definitions.
Sampling Rate 1000Hz 100Hz 10Hz 1Hz
10
Fs
10
3
10
2
10
1
10
0
3.3 Real-time Acquisition
The most important requirement on the Live mode is
the sampling rate accuracy. The approach followed in
our work was based on timer interrupts, and as such
two Interrupt Service Routines (ISRs) were imple-
mented on Timer 1 and 2, respectively, as illustrated
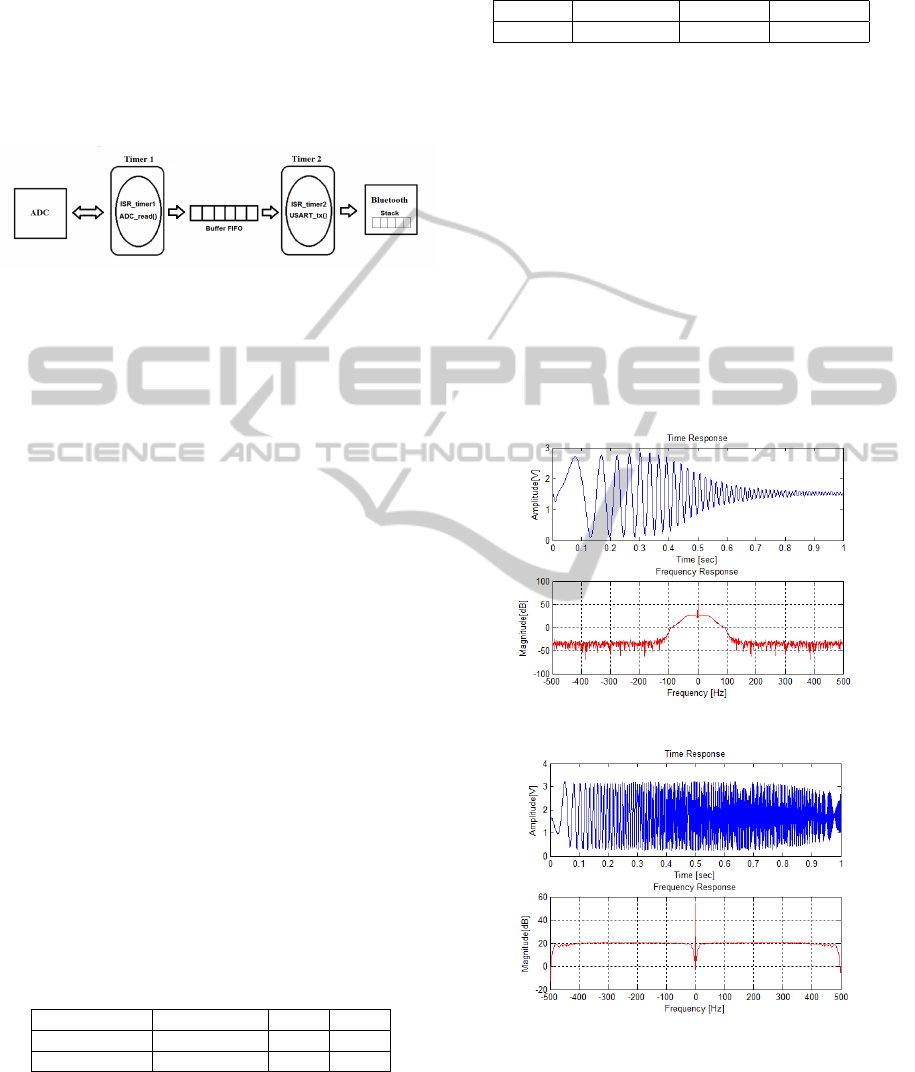
in Figure 10.
The ISR on Timer 1 (16 bits) defines the sampling
rate, and it is programmed to set the ADC, sample
each channel, and fill a circular buffer (FIFO). On
the other hand, the ISR on Timer 2 (8 bits) gets the
samples from the buffer, packs all the data and calcu-
lates the CRC before sending the data packets through
the USART controller, and consequently to Bluetooth
module.
BITalino-AMultimodalPlatformforPhysiologicalComputing
503
Both are programmed in Clear Timer on Compare
(CTC) match mode. It is extremely important that the
samples inside the buffer are retrieved quicker than
they are placed; as such, Timer 2 requires a system
call to occur 4 times more frequently than Timer 1
does. Otherwise, there would be an overflow inside
the buffer, and consequently the data would be cor-
rupted.
Figure 10: State diagram of the acquisition process.
4 EXPERIMENTAL EVALUATION
Tests were performed to the final system, to check
both the digital and analog components, namely, the
dynamic specifications of the Analog-to-Digital Con-
version (ADC), and the quality of the analog front-
end (SNR: Signal-to-Noise Ratio, ENOB: Effective
Number of Bits, SINAD: Signal-to-Noise Ratio plus
Distortion and THD: Total Harmonic Distortion). In
all experimental tests, the signals were generated us-
ing an Agilent 33220A function generator.
4.1 Analog-to-Digital Conversion
To characterize the temporal uncertainty of the sys-
tem, a synthesized ramp wave with a frequency of
10kHz, with 3V
pp
and offset of V
cc
/2 was acquired,
and the data was analysed. The dynamic specifica-
tions of the ADC function was also characterize and a
synthesized sine wave with a frequency of 15Hz, with
95% of 3.3V
pp
and offset of V
cc
/2 was used for this
purpose. In Table 3 we summarize the sampling rate
accuracy results; only the high sampling rates were
tested as they are the most demanding in terms of
sampling accuracy.
Table 3: Temporal uncertainty of the system.
Fs (ideal value)[Hz] Fs (real value)[Hz] skew [%] jitter [%]
1000 999.9989 ± 0.138 0.00011 0.0138
100 99.9988 ± 0.03 0.00121 0.03
In Table 4 we show the results of the ADC
dynamic specifications when the sampling rate is
1000Hz and 100Hz.
The crosstalk between channels was also mea-
sured, and it is less than −105.95dB.
Table 4: Dynamic specifications of the ADC (15Hz sine
wave; Fs = 1kHz).
SNR [dB] SINAD [dBc] THD [dBc] ENOB [bits]
55.72 54.29 -59.80 8.73
4.2 ECG and EMG
To characterize the real response of the analog circuits
(ECG and EMG), we reduced the gain to 100 (IN-
AMP with Gain = 1), to ensure a desirable output sig-
nal between 0 − 3.3V . In Figures 11 and 12 we show
the frequency response of the ECG and EMG circuits.
As illustrated in the plots (on top) of these figures, the
output signal is a chirp wave with ≈ 2.8V
pp
and with
attenuation in low and high frequencies, which is typ-
ical in the filter we applied (bandpass filter). During
this evaluate test, a synthesized chirp wave with fre-
quencies between 0 − 100Hz and 0 − 500Hz, respec-
tively, duration of 1 second, and 28mV
pp
and offset of
V
cc
/2 was applied.
Figure 11: Frequency response of the ECG sensor.
Figure 12: Frequency response of the EMG sensor.
To characterize the dynamic specifications of the
analog circuits (ECG and EMG), a synthesized sine
wave with a frequency of 24Hz and 55Hz, respec-
tively, with 28mV
pp
and offset of V
cc
/2 was used. Ta-
ble 5 summarizes the results of the dynamic specifi-
cations of the circuits.
ICINCO2013-10thInternationalConferenceonInformaticsinControl,AutomationandRobotics
504
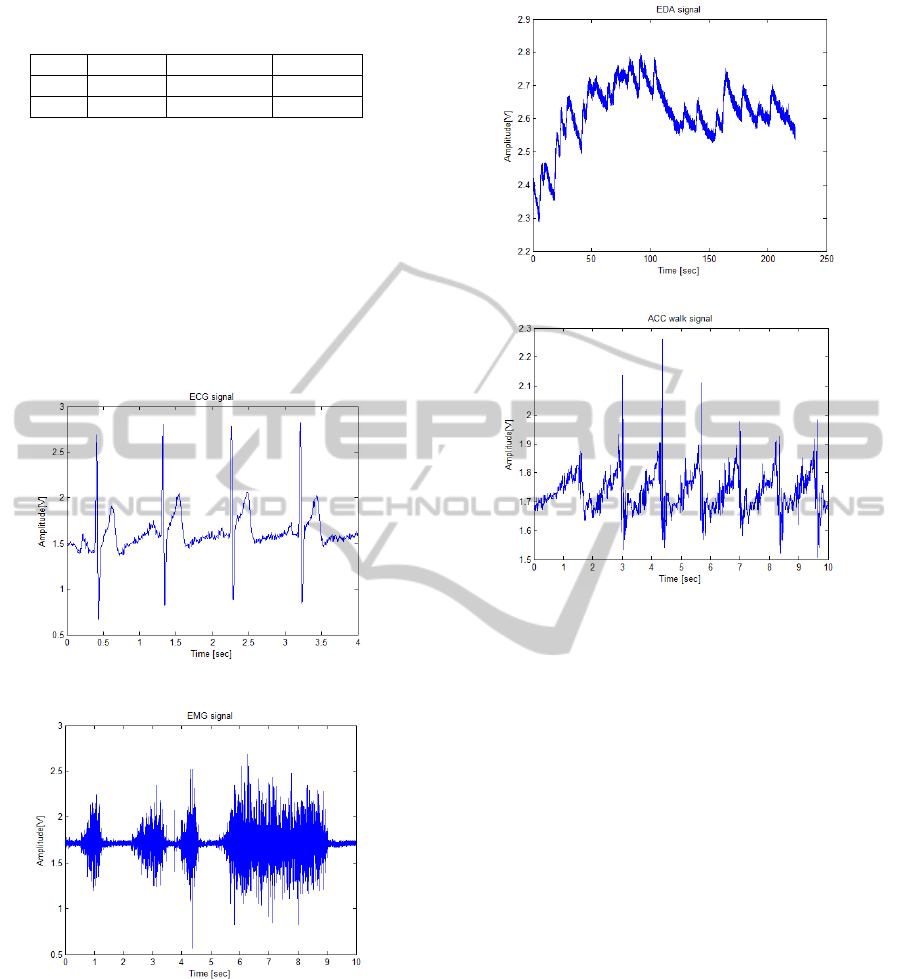
Table 5: Dynamic specifications (ECG and EMG, Fs =
1kHz).
Sensor SNR [dB] SINAD [dBc] THD [dBc]
ECG 44.54 42.49 -46.74
EMG 34.85 34.75 -51.24
In order to measure the time delay of the circuits, a
transient analysis was performed and thus, 2.337 sec-
onds is the time delay of the ECG design and 0.146
seconds is the time delay of the EMG design. Finally,
real ECG and EMG signals were acquired. For the
ECG, we placed the electrodes between the left and
right arms and using dry electrodes, and for EMG
measurement we placed the sensor over a muscle (bi-
ceps brachii) using pre-gelled electrodes, Figures 13
and 14 show examples of real-world data collected
with our sensors.
Figure 13: Example of an ECG signal.
Figure 14: Example of an EMG signal.
4.3 EDA and ACC
The full-scale range of the EDA circuit was tested
experimentally, and shown to be able to measure re-
sistances between 0Ω ≤ R
skin
≤ 500kΩ, as expected.
Figure 15 shows an example of the signal acquired us-
ing this sensor. The ACC sensor was also tested, and
in Figure 16 we present a sample of a signal acquired
from the z axis during a walking task, in which the
BITalino board was carried in the pocket(right leg).
Figure 15: Example of an EDA signal.
Figure 16: Example of an accelerometry signal.
5 CONCLUSIONS
Our work presents a versatile and low-cost (below
e 100) platform, which consists of a hardware de-
vice with a ”Credit Card” form factor, that integrates
multiple measurement sensors for biosignal data ac-
quisition, namely, Electrocardiography (ECG), Elec-
tromiography (EMG), Electrodermal Activity (EDA),
Accelerometry (ACC). It also includes a Light sensor
and a Light-Emitting Diode (LED). We believe that
BITalino is an important contribution for the research
community, as it integrates various types of biosignal
sensors in a single board in a way that no other plat-
form does.
The experimental results have shown that the data
collected through the proposed system preserves the
waveform properties, that the system is accurate for
real-time data acquisition, and that the analog front-
end behaves according to what is defined in the refer-
ence literature as the characteristics of each signal.
Future work will be focused on revising the analog
front-end for some of the sensors, improving the form
factor of the device into a more flexible platform, inte-
grating an on-board charge management controller to
ensure a Lithium-Ion/Lithium-Polymer battery charg-
BITalino-AMultimodalPlatformforPhysiologicalComputing
505

ing, and on experimenting with Bluetooth Low En-
ergy (BLE), to ensure lower power consumption.
ACKNOWLEDGEMENTS
This work was partially funded by the Fundac¸
˜
ao
para a Ci
ˆ
encia e Tecnologia (FCT) under the grants
PTDC/EEI-SII/2312/2012, SFRH/BD/65248/2009
and SFRH/PROTEC/49512/2009, whose support
the authors gratefully acknowledge. The authors
would also like to thank the Institute for Systems and
Technologies of Information, Control and Communi-
cation (INSTICC), the graphic designer Andr
´
e Lista,
Prof. Pedro Oliveira, and the Instituto Superior de
Educac¸
˜
ao e Ci
ˆ
encias (ISEC), for their support to this
work.
REFERENCES
Alves, A. P., Silva, H., Lourenc¸o, A., and Fred, A. (2013).
BITalino: A biosignal acquisition system based on
arduino. In Proceeding of the 6th Conference on
Biomedical Electronics and Devices (BIODEVICES).
Basmajian, J. V. and De Luca, C. J. (1985). Muscles
Alive: Their Functions Revealed by Electromyogra-
phy. Williams & Wilkins, 5 sub edition.
Boucsein, W. (2011). Electrodermal Activity. Springer, 2nd
ed. 2012 edition.
Graimann, B., Allison, B., and Pfurtscheller, G., editors
(2011). Brain-Computer Interfaces. Springer.
Hermens, H. J., Freriks, B., Disselhorst-Klug, C., and Rau,
G. (2000). Development of recommendations for
sEMG sensors and sensor placement procedures. J. of
Electromyography and Kinesiology, 10(5):361–374.
Malmivuo, J. (1995). Bioelectromagnetism - Principles and
Applications of Bioelectric and Biomagnetic Fields.
Oxford University Press, New York.
Merlo, A. and Campanini, I. (2010). Technical aspects of
surface electromyography for clinicians. The Open
Rehabilitation Journal, 3rd:98–109.
Myong-Woo Lee, Adil Mehmood Khan, T.-S. K. (2011).
A single tri-axial accelerometer-based real-time per-
sonal life log system capable of human activity recog-
nition and exercise information generation. Springer-
Verlag London Limited 2011.
O’Sullivan, D. and Igoe, T. (2004). Physical Comput-
ing: Sensing and Controlling the Physical World with
Computers. Thomson, 1st edition.
Webster, J. G. (2009). Medical Instrumentation Application
and Design. Wiley, 4th edition.
Winter, D. A. (2004). Biomechanics and Motor Control of
Human Movement. Wiley, 3rd edition.
ICINCO2013-10thInternationalConferenceonInformaticsinControl,AutomationandRobotics
506
