
Gene Ontology Analysis of Colorectal Cancer Biomarkers Probed with
Affymetrix and Illumina Microarrays
Monika Simjanoska
1
, Ana Madevska Bogdanova
1
and Sasho Panov
2
1
Ss. Cyril and Methodius University, Faculty of Information Sciences and Computer Engineering, Skopje, Macedonia
2
Ss. Cyril and Methodius University, Faculty of Natural Sciences and Mathematics, Institute of Biology, Skopje, Macedonia
Keywords:
Colorectal Cancer, Affymetrix, Illumina, Machine Learning, Gene Ontology, Bayesian Classification.
Abstract:
Colorectal cancer is the fourth most common cause of death worldwide. Recently, many microarray exper-
iments have been done to investigate the expression of the genes in the colorectal tissues and thus, to find
the answers for its occurrence. Previously, we used experiments obtained from both Illumina and Affymetrix
microarray platforms to analyze the gene expression in healthy and carcinogenic tissues. As a result we got
specific sets of biomarkers that we used to build an accurate Bayesian diagnostic system. The high degree of
classifier’s sensitivity and specificity intrigued us to proceed with the research of the significant genes we dis-
covered, the biomarkers. Therefore, in this paper we aim towards biomarkers identification and the functional
groups they are associated with, i.e., we performed gene ontology analysis. Investigating the genes that control
the colorectal carcinogenic tissue development is of central importance to the verification of the biomarkers’
revealing method’s validity. Moreover, we showed the importance of their participation in the prior distribu-
tions modeling, which is the key part for achieving an accurate Bayesian classification, regardless their strict
disease and disorder association.
1 INTRODUCTION
The cancer incidence, mortality and prevalence were
a target of the research which the World Health Orga-
nization (WHO) provided in 2008. The results of the
GLOBOCAN project showed that the colorectal can-
cer is the third most common cancer in men, and the
second in women with a total incidence of 1,234,000
cases, of which 60% occur in developed regions. The
mortality results of 8% of total cancer deaths make
this type of cancer to be the fourth most common
cause of death from cancer (GLOBOCAN, 2008).
Recently, the scientists provide intensive gene ex-
pression profiling experiments in order to compare the
malignant to the healthy cells in a particular tissue.
The advantage of the microarray technologies enables
simultaneous observation of thousands of genes and
allows the researchers to derive conclusions whether
the disorder is a result of the abnormal expression of
a subset of genes.
In our previous researches we assumed that the
colorectal cancer occurs as a result of increased and
decreases expression levels of a set of significant
genes, which we refer to as biomarker genes. There-
fore, in (Simjanoska et al., 2013b) and (Simjanoska
et al., 2013a) we used experiments of colorectal car-
cinogenic and healthy adjacent tissues probed with
two widely used microarray technologies, Illumina
and Affymetrix. For each platform we developed
original methodologies for unveiling the genes that
show significant changes in their expression levels
in presence of colorectal cancer, both adenomas and
adenocarcinomas, and we used the genes’ expres-
sions to model binary diagnostic system based on the
Bayes’ theorem. The outcomes of the classification
showed a high precision when diagnosing both car-
cinogenic and healthy tissues.
The ability of the selected biomarkers to discrim-
inate between colorectal cancer and normal health
condition intrigued us to go deeper in the problem
and to investigate the biomarkers functions on molec-
ular level, i.e, to perform gene ontology analysis.
Analysing the molecular function and the biologi-
cal processes of the biomarkers will provide answers
whether all the significant genes are tightly related to
the colorectal cancer phenomena, and whether all of
them are necessary for the developed classifier to pro-
duce accurate decisions. Conducting this kind of re-
search is of great importance to the Bayesian machine
learning classification approach, which we confirmed
396
Simjanoska M., Madevska Bogdanova A. and Panov S..
Gene Ontology Analysis of Colorectal Cancer Biomarkers Probed with Affymetrix and Illumina Microarrays.
DOI: 10.5220/0004554803960406
In Proceedings of the 5th International Joint Conference on Computational Intelligence (NCTA-2013), pages 396-406
ISBN: 978-989-8565-77-8
Copyright
c
2013 SCITEPRESS (Science and Technology Publications, Lda.)

to be very accurate, and also very important to ver-
ify if the methods used for biomarkers selection are
reliable. Furthermore, the results obtained from a re-
search like this can advance the progress of the future
personalized cancer treatment (Jain, 2004).
The rest of the paper is organized as follows. In
Section 2 we briefly present the work related to our
field of interest. The methodology for biomarkers re-
vealing, tissues classification and ontology analysis is
explained in Section 3. In Section 4 we present the ex-
periments and the results from the ontology analysis
and the additional classification experiments. In the
final Section 5 we derive conclusions from the results
and we present our plans for future work.
2 RELATED WORK
In this section we give a brief review of the recent sci-
entific work that relates to ontology analysis and its
importance to various health disorders and diseases.
Furthermore, we present some of the most important
researches related to the colorectal cancer. Eventu-
ally, we exhibit the literature related to the microarray
experiments we used in our paper.
In (Ahn et al., 2003) the authors present their re-
search where the gene ontology analysis was used
to systematically characterize the global expression
profiles at cellular process levels. They showed that
potentially significant pathogenetic cellular processes
can be identified and showed that the functional pro-
filing has a significant impact on the discovery of
pathogenic pathway in leiomyoma.
Another research is presented in (Holmans et al.,
2009) where gene ontology analysis has been used to
provide insights into the biology of bipolar disorder.
Avoiding single marker analysis, the authors in
(Jia et al., 2010) also incorporated Gene Set Enrich-
ment Analysis (GSEA) and hypergeometric test, and
combined them using Fisher’s combined method to
perform pathway-based analysis in order to detect
genes’ combined effects on mediating schizophrenia.
Interestingly, they found a few pathways to be top
ranked and likely associated with schizophrenia, how-
ever non of the genes involved in these pathways had
been detected by single marker analysis, conclud-
ing that this approach may complement the original
analysis of genome-wide association studies (GWAS)
dataset.
The approach of gene set enrichment analysis for
interpreting gene expression data was also discussed
in (Subramanian et al., 2005) where the researchers
demonstrate how it yields insights into several cancer-
related data sets, including leukemia and lung cancer.
They also state that single-gene analysis may miss im-
portant effects on pathways. Sometimes an increase
of 20% in all genes encoding members of a metabolic
pathway may be more important than a 20-fold in-
crease in a single gene. Also another statement that
is important to our research is that often the different
studies of the same biological system present a list of
statistically significant genes that show distressingly
little overlap.
Considering the colorectal cancer, we cannot dis-
miss the Vogelstein’s genetic model for colorectal car-
cinoma which has been proposed as a result of a long
term research. In (Kinzler and Vogelstein, 1996) they
present the genetic changes associated with colorec-
tal tumorigenesis and distinguish several genes that
showed high involvement in colorectal neoplasia. In
this paper we will rely on this model, which is a mile-
stone in cancer research (Nature, 2006), to compare
our results and to verify our methods for biomark-
ers selection. However, blindly relying only on Vo-
gelstein’s model and not assuming any exceptions
is completely wrong. This is confirmed by the re-
search in (Smith et al., 2002) where the authors inves-
tigate the mutations in the specific genes introduced
by Vogelstein, including adenomatous polyposis coli
(APC), Kirsten-ras (K-ras), and p53. According to
the results from their research, they come up with the
conclusion that multiple alternative genetic pathways
to colorectal cancer exist and that the widely accepted
genetic model of cancer development is not represen-
tative of the majority of colorectal tumors.
Regarding ontology and classification analysis re-
lated to colorectal cancer, authors in (Lascorz et al.,
2011a) sum up the biomarkers results from 23 dif-
ferent researches. Even though most of them show
diversity in the significant genes revealed, the au-
thors in their research take into account the unique
biomarkers, which are nearly 1000, and perform on-
tology analysis using various tools. They mainly hold
on to the ontology results analysis of the enriched set
of genes, rather than verifying the biomarkers with
classification methods so that we can compare our re-
sults. Similarly, in (Xu et al., 2013) the researchers
use Affymetrix microarray data from 20 patients and
a different procedure from the one we presented in 3.1
to reveal significant gene expression, which resulted
in 1469 biomarkers. From the ontology analysis they
ranked top 10 most important pathways. Compar-
ing our results to theirs, we realized that there is no
overlap between ours and their biomarkers sets. Even
though they lack a classification analysis, we may in-
clude their biomarkers in our future work and test the
ability of the Bayesian approach to make an appro-
priate modelling using different biomarkers reveal-
GeneOntologyAnalysisofColorectalCancerBiomarkersProbedwithAffymetrixandIlluminaMicroarrays
397

ing procedure. Since the non overlapping between
the biomarkers sets discovered in different scientific
papers is very common, a new meta-analysis model
of colorectal cancer gene expression profiling studies
is proposed in (Chan et al., 2008). As the authors
ranked the biomarker genes according to various pa-
rameters, the gene CDH3 which we found to play
role in the colorectal cancer, is also found by their
meta-analysis model. Another interesting approach
maintained with classification analysis is presented
in (Jiang et al., 2008), where the authors constructed
disease-specific gene networks and used them to iden-
tify significantly expressed genes. A particular atten-
tion is given to five biomarkers, from which one of
them, IL8, was also detected by our methodology,
but it was not considered important in our research
since no specific connection to the colorectal cancer
was found in the literature. In order to test the power
of the colon cancer-specific gene network biomark-
ers revealing ability, they use five different classifiers:
diagonal linear discriminate analysis (DLDA), 3 near-
est neighbours (3NN), nearest centroid (NC), support
vector machine (SVM) and Bayesian compound co-
variate (BCC).
Considering the fact that in this paper we use mi-
croarray experiments from Affymetrix and Illumina
platforms performed for different purposes, we pro-
vide an overview of the work related to these sets of
data.
The experiments obtained from the Affymetrix
platform were used in several researches. In (Hong
et al., 2010) the authors aimed to find a metastasis-
prone signature for early stage mismatch-repair pro-
ficient sporadic colorectal cancer (CRC) patients
for better prognosis and informed use of adjuvant
chemotherapy. A transcriptome profile of human
colorectal adenomas is given in (Sabates-Bellver
et al., 2007) where they characterize the molecular
processes underlying the transformation of normal
colonic epithelium. One of the data sets has been
used in (Watanabe et al., 2006) to clarify the differ-
ence between microsatellite instability (MSI) and mi-
crosatellite stability (MSS) cancers and, furthermore,
to determine distinct characteristics of proximal and
distal MSI cancers. A similar research is presented
in (Jorissen et al., 2008) where the scientists showed
cross-study consistency of MSI-associated gene ex-
pression changes in colorectal cancers. The microar-
ray data obtained from the Illumina chip was used
in (Hinoue et al., 2012) where the authors performed
comprehensive genome-scale DNA methylation pro-
filing of normal and carcinogenic tissues and identi-
fied four DNA methylation-based subgroups of CRC
using model-based cluster analyses.
3 METHODS AND
METHODOLOGY
In this section we describe the procedure used for sig-
nificant genes detection from both widely used types
of DNA microarrays, Affymetrix and Illumina. Fur-
thermore, we exhibit the methodology used for build-
ing the Bayesian classificator, and finally, we present
the gene ontology method that we use in this paper to
reveal overrepresented functional groups of genes.
3.1 Biomarkers Detection Methodology
The process for revealing the biomarkers consists of
the following steps (Simjanoska et al., 2013b), (Sim-
janoska et al., 2013a):
• Quantile normalization. Since our aim is to unveil
the difference in gene expression levels between
the carcinogenic and healthy tissues, we proposed
the Quantile normalization (QN) as a suitable nor-
malization method (Wu and Aryee, 2010).
• Low entropy filter. We used low entropy filter to
remove the genes with almost ordered expression
levels (Needham et al., 2009), since they lead to
wrong conclusions about the genes behaviour.
• Paired-sample t-test. Knowing the facts that both
carcinogenic and healthy tissues are taken from
the same patients, and that the whole-genome
gene expression follows normal distribution (Hui
et al., 2010), we used a paired-sample t-test.
• FDR method. False Discovery Rate (FDR) is a
reduction method that usually follows the t-test.
FDR solves the problem of false positives, i.e.,
the genes which are considered statistically sig-
nificant when in reality there is not any difference
in their expression levels.
• Volcano plot. Both the t-test and the FDR method
identify different expressions in accordance with
statistical significance values, and do not consider
biological significance. In order to display both
statistically and biologically significant genes we
used volcano plot visual tool.
3.2 Bayesian Classification
As we discovered the two sets of biomarkers from
both microarray chips, we used them in our pre-
vious work (Simjanoska et al., 2013b) and (Sim-
janoska et al., 2013a) to propose a generative ap-
proach for building a Bayesian classifier that models
the prior distributions at carcinogenic and healthy tis-
sues. Once we modelled the prior distributions for
IJCCI2013-InternationalJointConferenceonComputationalIntelligence
398

both classes, carcinogenic and healthy, we were able
to use them in the Bayes’ theorem and to calculate the
a posteriori probability for a given tissue to belong to
one of the two classes, C
i
.
Therefore, we calculate the a posteriori probabil-
ity P(C
i
|~x), as:
p(C
i
|~x) =
p(~x|C
i
) ∗ P(C
i
)
2
∑
i=1
p(~x|C
i
) ∗ P(C
i
)
(1)
The class-conditional densities, or, the prior distri-
butions, p(~x|C
i
), are calculated as the product of the
continuous probability distributions of each gene dis-
tinctively:
p(~x|C
i
) =
∏
f
1
f
2
... f
n
(2)
For the prior probabilities P(C
i
), we defined two
test cases:
• Test Case 1: Since we have equal number of tis-
sues into both of the classes, the prior probabilities
are also equal P(C
1
) = P(C
2
) = 0.5;
• Test Case 2: The prior probabilities are esti-
mated according to the statistics in (GLOBO-
CAN, 2008). Therefore, P(C
1
) = 0.0002 and
P(C
2
) = 0.9998, where C
1
denotes the carcino-
genic class, and C
2
denotes the healthy class.
The tissue ~x, which is an input to the Bayesian
classifier, is classified according to the rule of maxi-
mizing the a posteriori probability (MAP):
C
i
= max p(C
i
|~x) (3)
3.3 Gene Ontology
The analyses of single markers have been in the fo-
cus of the genome-wide association studies. How-
ever, it often lacks the power to uncover the relatively
small effect sizes conferred by most genetic variants.
Therefore, using prior biological knowledge on gene
function, pathway-based approaches have been devel-
oped with the aim to examine whether a group of re-
lated genes in the same functional pathway are jointly
associated with a trait of interest (Wang et al., 2010).
The goal of the Gene Ontology Consortium is to
produce a dynamic, controlled vocabulary that can
be applied to all eukaryotes even as knowledge of
gene and protein roles in cells is accumulating and
changing (Ashburner et al., 2000). The Gene On-
tology (GO) project since 1998 is a collaborative ef-
fort to provide consistent descriptors for gene prod-
ucts in different databases and to standardize classi-
fications for sequences and sequence features. The
GO project provides ontologies to describe attributes
of gene products in three non-overlapping domains of
molecular biology (Harris et al., 2004):
• Molecular Function describes activities, such as
catalytic or binding activities, at the molecular
level. GO molecular function terms represent ac-
tivities rather than the entities that perform the ac-
tions, and do not specify where, when or in what
context the action takes place.
• Biological Process describes biological goals ac-
complished by one or more ordered assemblies of
molecular functions.
• Cellular Component describes locations, at the
levels of subcellular structures and macromolec-
ular complexes.
There are many tools based on Gene Ontology re-
source, however, many of them require local instal-
lation and specific platform. Therefore, in this re-
search we use the freely accessible Gene Ontology
Enrichment Analysis Software Toolkit, GOEAST. It
is a web based tool which applies appropriate statis-
tical methods to identify significantly enriched GO
terms among a given list of genes. Beside the other
functions, GOEAST supports analysis of probe set
IDs from Affymetrix and Illumina microarrays. It
provides graphical outputs of enriched GO terms to
demonstrate their relationships in the three ontology
categories. In order to compare GO enrichment sta-
tus of multiple experiments, GOEAST supports cross
comparisons to identify the correlations and differ-
ences among them (Zheng and Wang, 2008).
4 EXPERIMENTS AND RESULTS
In this section we present the experiments and the re-
sults obtained from the previously defined methodolo-
gies.
4.1 Microarray Data Analysis
In order to extract significant genes that character-
ize the colorectal cancer, we used two sets of mi-
croarray data. The first was gene expression profil-
ing of 32 colorectal tumors, adenomas, and matched
adjacent 32 non-tumor colorectal tissues probed with
Affymetrix Human Genome U133 Plus 2.0 Array.
It contains 54,675 probes, but the unique genes ob-
served are 21,050. The second is gene expres-
sion analysis of 26 colorectal tumors, adenocarcino-
mas, and matched adjacent non-tumor colorectal tis-
sues, probed with Illumina Human Ref-8 v3.0 whole-
genome expression BeadChip. It allows 24,526 tran-
script probes, but unique genes are 17,853.
GeneOntologyAnalysisofColorectalCancerBiomarkersProbedwithAffymetrixandIlluminaMicroarrays
399
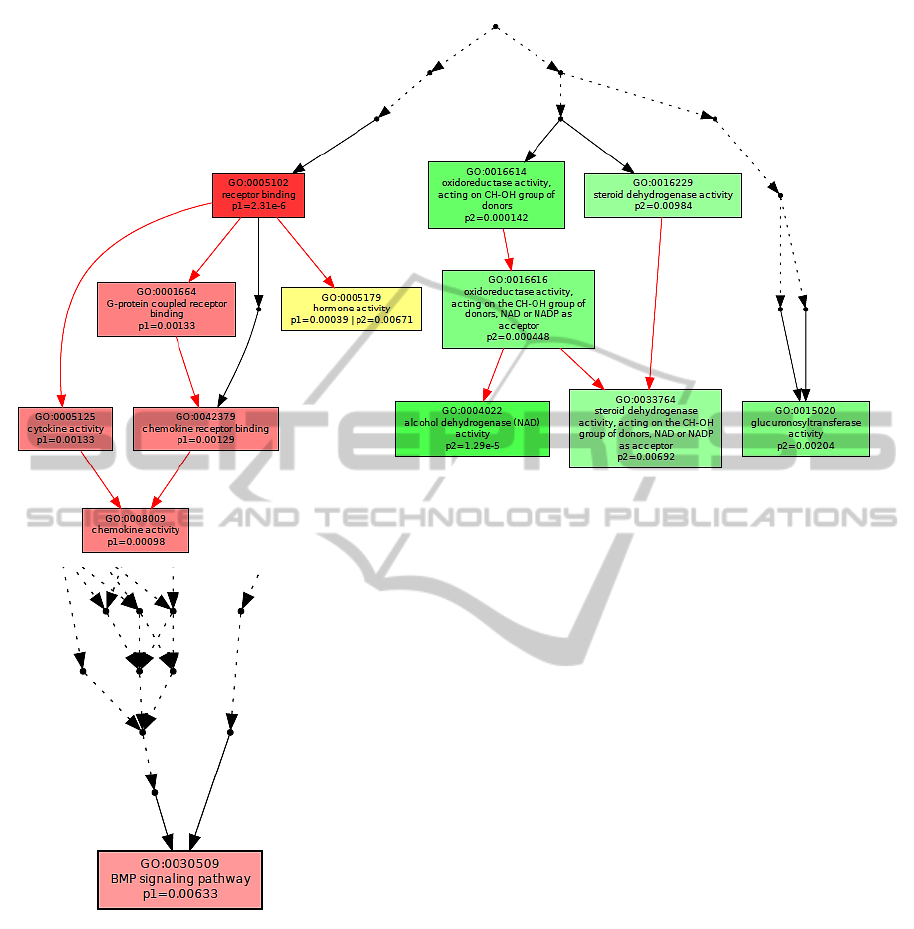
Figure 1: Molecular function.
Both sets of data were preprocessed according to
the methodology described in Section 3.1. The re-
sults showed 138 significant probes from the tissues
probed with Affymetrix microarray, and 213 signifi-
cant probes from the tissues probed with Illumina mi-
croarray.
The significant probes were used in the Bayes’
theorem as discussed in Section 3.2. Table 1 presents
the results from the tissues classification. Sensitiv-
ity refers to the classifier’s ability to correctly classify
carcinogenic tissues, whereas specificity refers to the
classifier’s ability to correctly classify healthy sam-
ples. Additionally, we used 239 patients already diag-
nosed with colorectal cancer, and 12 healthy patients,
in order to present the classifier’s reliability. We need
the results from the Table 1 for comparing the out-
comes from the experiments that follow.
4.2 Gene Ontology Analysis
Once we revealed biomarker genes that showed ex-
cellent ability in distinguishing between the colorec-
tal cancer and the healthy samples, we continued our
research in analysing biomarkers functions on molec-
IJCCI2013-InternationalJointConferenceonComputationalIntelligence
400

Table 1: Classifier’s sensitivity and specificity.
Chip Performance Sensitivity Specificity Test Cases
Affymetrix
Tissues
1 0.84 Test case 1
0.94 1 Test case 2
Patients
0.98 0.92 Test case 1
0.90 1 Test case 2
Illumina Tissues
0.96 0.92 Test case 1
0.81 1 Test case 2
ular level. For this purpose, we used the online avail-
able tool GOEAST, previously discussed in Section
3.3. For obtaining reliable results, we chose the
Fisher’s exact test and a p-value of 0.01. In order to
compare both enrichment results, we used the Multi-
GOEAST tool and produced the ontologies depicted
in figures 1, 2 and 3.
The different colour saturation degrees in the
graphs present the enrichment significance of each
GO term, defined by the p-value. In the graphical
output of Multi-GOEAST results, each set is repre-
sented with different colour. Therefore, red and green
boxes represent enriched GO terms only found in
Affymetrix and Illumina biomarkers, whereas yellow
boxes represent commonly enriched GO terms in both
experiments.
Figure 1 depicts the molecular function of the dif-
ferentially expressed genes. The results show that
’hormone activity’ is a common molecular function
for a subset of the biomarker genes from both mi-
croarray platforms. Inspecting the biological pro-
cesses described in Figure 2, we conclude that there
are no processes in common, whereas considering the
cellular component analysis in Figure 3 we perceive
that some genes from both platforms are found in the
extracellular region.
As we examined the genes from the ontology anal-
ysis, we derived conclusion that there is a small over-
lap between the enriched sets from the two platforms.
However, as explained in Section 2 this is not an un-
expected phenomena.
In order to compare the results, we analyzed an-
other study where the researchers also examined path-
ways in colorectal cancer development (Lascorz et al.,
2011b). They used 242 genes and total of nine tools
to detect enrichment of Gene Ontology (GO) cate-
gories or Kyoto Encyclopedia of Genes and Genomes
(KEGG) pathways. Among identified the consistently
enriched gene categories, we realized that our exper-
iment and their research have the following enriched
molecular functions and cellular components in com-
mon: receptor binding, cytokine activity, chemokine
activity, hormone activity, oxidoreductase activity,
acting on CH-OH group of donors, and oxidoreduc-
tase activity, acting on the CH-OH group of donors,
NAD or NADP as acceptor.
Assuming the enriched entities we found are sta-
tistically overrepresented among all biomarkers, we
performed classification experiments to realize if the
Bayesian classificator we developed is able to dis-
criminate between the carcinogenic and the healthy
tissues using only the overrepresented genes as a
training set. However, the results presented in Table 2
show that the Bayesian classifier’s ability to recognize
colorectal cancer has decreased.
Table 2: Classifier’s sensitivity and specificity for the en-
riched sets of genes.
Chip Performance Sensitivity Specificity Test Cases
Affymetrix
Tissues
0.91 0.69 Test case 1
0.47 1 Test case 2
Patients
0.96 1 Test case 1
0.78 1 Test case 2
Illumina Tissues
0.96 0.88 Test case 1
0.58 1 Test case 2
Considering the results in tables 1 and 2, we con-
firmed that the statistical pattern recognition process,
i.e. the Bayesian model requires larger amount of
data, therefore, it works well only if both enriched
and residual genes are taken into account.
Furthermore, the next step is to verify the reliabil-
ity of the procedure for distinguishing the biomarkers
considering their relation to the colorectal cancer.
Using publicly available microarray data profiled
on Affymetrix U133A chips, the authors in (Benita
et al., 2010) examined gene enrichment profiles from
a tissue perspective rather than gene perspective,
thereby identifying highly enriched genes within a
cell type, which are often key to cellular differen-
tiation and function. To identify genes that are tis-
sue specific, the authors used an enrichment score to
benchmark expression levels in one tissue compared
to all other tissues. When applying their online avail-
able tool Gene Enrichment Profiler on the genes that
the ontology tool found to be overrepresented, we no-
ticed that at Affymetrix platform a group of genes
are enriched in the Central Nervous System’s tissues,
whereas the others are enriched in various other tis-
sues. For the overrepresented genes among the Illu-
mina biomarkers, we noticed that the enrichment is
also not concentrated in any particular tissue.
This intrigued as to go deeper and investigate ev-
ery gene involved in the molecular functions and the
biological processes from the ontology analysis. Few
of them are confirmed to play role in colorectal cancer
beside the other related diseases and functions:
• VIP - Vasoactive intestinal peptide (VIP) is found
in hormone activity and receptor binding molecu-
lar functions. Its expression is down regulated at
both chips, Affymetrix and Illumina. In (Zhang
GeneOntologyAnalysisofColorectalCancerBiomarkersProbedwithAffymetrixandIlluminaMicroarrays
401
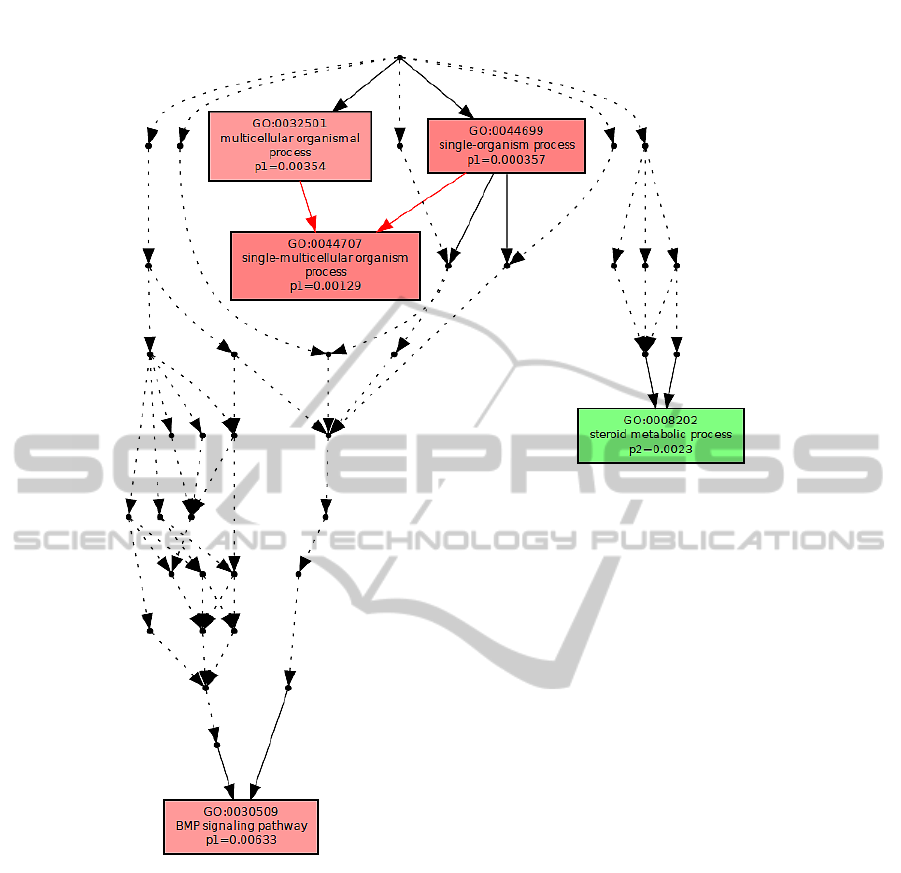
Figure 2: Biological processes.
et al., 1997), the researchers evaluate the expres-
sion of VIP receptor in colonic carcinoma and in-
vestigate the its role in colon cancer growth.
• SCG2 - This gene is related to cytokine activity
and receptor binding molecular functions. It is
found to be significant from the Affymetrix plat-
form and showed decreased expression. The pro-
tein encoded by this gene is a member of the chro-
mogranin/secretogranin family of neuroendocrine
secretory proteins. Chromogranin genes have
been explored in (Pagani et al., 1995) and (Fer-
rero et al., 1995).
• CHGA - The protein encoded by this gene is also a
member of the chromogranin/secretogranin fam-
ily of neuroendocrine secretory proteins and is
also down expressed at the Affymetrix chip.
• GUCA2B - The expression of this gene is down
regulated at Affymetrix chip. It encodes a mem-
ber of the guanylin family, and is expressed in
the stomach and intestine. It may be involved
in salt and water secretion into the intestinal lu-
men as well as the renal tubules, and thus regulate
electrolyte homeostasis in these tissues. Its role
in the colorectal cancer is discussed in (Li et al.,
2009) where the colorectal cancer is observed as
a disease of hormone insufficiency. Guanylin cor-
relation is examined in (Camici, 2008) and also
new diagnostic and therapeutic approaches for
colorectal cancer are discussed.
• MMP7 - Proteins of the matrix metalloproteinase
IJCCI2013-InternationalJointConferenceonComputationalIntelligence
402
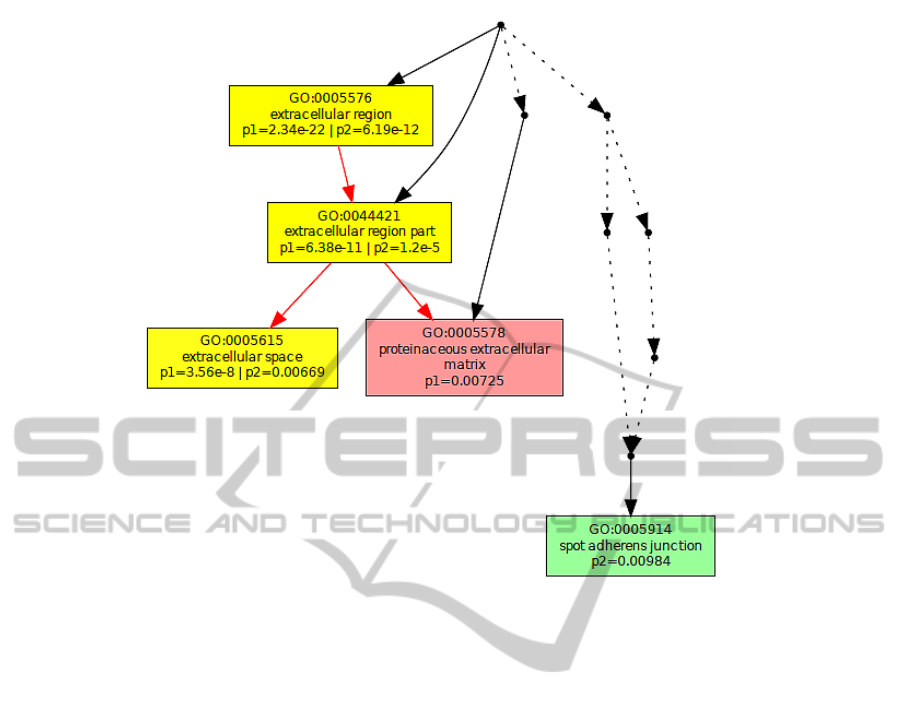
Figure 3: Cellular component.
(MMP) family are involved in the breakdown of
extracellular matrix in normal physiological pro-
cesses, such as embryonic development, repro-
duction, and tissue remodeling, as well as in dis-
ease processes, such as arthritis and metastasis.
This gene showed up expression at the Affymetrix
chip. Its association with tumor cell invasion and
metastasis is exhibited in (Masaki et al., 2001).
Authors in (Mori et al., 1995) find that MMP-7
mRNA is overexpressed in human colorectal car-
cinomas and that MMP-7 may prove useful as a
marker of biologic aggressiveness.
• MMP3 - MMPs play a central role in cell pro-
liferation, migration, differentiation, angiogene-
sis, apoptosis and host defences. Dysregulatoin of
MMPs has been implicated in many diseases in-
cluding arthritis, chronic ulcers, encephalomyeli-
tis and cancer. One of the first steps in metasta-
sis is the degradation of the basement membrane,
a process in which MMPs have been implicated.
Synthetic or natural inhibitors of MMPs result in
inhibition of metastasis, while up-regulation of
MMPs led to enhanced cancer cell invasion. This
gene has showed up regulation at the Affymetrix
chip. Its importance to the colorectal cancer is
proved in (Zinzindohou
´
e et al., 2005), (Baba et al.,
2004), and (Roeb et al., 2004).
• CDH3 - This gene is a classical cadherin from
the cadherin superfamily. The encoded protein is
a calcium-dependent cell-cell adhesion glycopro-
tein comprised of five extracellular cadherin re-
peats, a transmembrane region and a highly con-
served cytoplasmic tail. CDH3 is overexpressed
in the majority of pancreatic cancer and various
other malignancies, including gastric and colorec-
tal cancers (Imai et al., 2008).
• DHRS9 - This gene is found to be down regulated
at the Illumina chip. It is involved in alcohol dehy-
drogenase (NAD) activity, oxidoreductase activ-
ity, acting on CH-OH group of donors, oxidore-
ductase activity, acting on the CH-OH group of
donors, NAD or NADP as acceptor, steroid dehy-
drogenase activity, acting on the CH-OH group of
donors, NAD or NADP as acceptor, steroid dehy-
drogenase activity, and steroid metabolic process.
This gene may play a role in the biosynthesis of
retinoic acid. The importance of the retionic acid
to the colorectal cancer is explained in (Jette et al.,
2004).
• GUCA2A - This gene is endogenous activator of
intestinal guanylate cyclase. It is highly expressed
in ileum and colon. At the Illumina chip it showed
down expression. The ontology results showed it
is involved in a hormone activity. The possibility
GeneOntologyAnalysisofColorectalCancerBiomarkersProbedwithAffymetrixandIlluminaMicroarrays
403

that the loss of guanylin activity leads to, or, is a
result of colorectal adenocarcinoma formation is
presented in (Cohen et al., 1998).
• PYY - This gene shows down expression at Il-
lumina platform. The ontology results showed
it is also involved in a hormone activity. PYY
chemotherapy resistance in colon cancer is dis-
cussed in (Kling et al., 1999).
• HPGD - This gene encodes an enzyme that func-
tion in a variety of physiologic and cellular pro-
cesses such as inflammation. Inhibits in vivo pro-
liferation of colon cancer cells. It is detected in
colon epithelium. According to the ontology, this
gene is involved in oxidoreductase activity, acting
on CH-OH group of donors and oxidoreductase
activity, acting on the CH-OH group of donors,
NAD or NADP as acceptor. At the Illumina chip
it showed down expression. Its role in the colorec-
tal cancer is researched in (Holla et al., 2008).
However, we found that the set we revealed is able
to discriminate between colorectal cancer and healthy
tissue. In order to confirm our hypothesis, we used
additional biomarkers set, revealed with the GEO2R
web tool available from the Gene Expression Om-
nibus database (GEO, 2013). GEO2R allows rank-
ing the most significant biomarkers from particular
tissues. We used the same data sets as in this pa-
per, and we took into account the top 250 biomarkers.
The GEO2R biomarkers and the Illumina biomarkers
set showed overlap in 84 genes and the retrained clas-
sifier with this set of biomarkers showed very high
accuracy during the classification, whereas biomark-
ers from the Affymetrix set showed overlap in only
32 genes and our model was unable to discriminate
between the two classes with this retrained classifier.
Very important result is that among the small num-
ber of the overlapping genes, we found many of
the genes we confirmed to be related to colorectal
cancer: CHGA, GUCA2B, MMP7, CDH3, DHRS9,
GUCA2A, PYY and HPGD.
Considering the Vogelstein’s model, none of the
genes he defined as biomarkers were found in the
biomarkers we discovered.
5 CONCLUSIONS
The aim of this paper was to show whether the
biomarkers revealed by appropriately defined statis-
tical methodology in Section 3.1 and that showed ex-
cellent classification ability using the model in Sec-
tion 3.2, play important biological role in the colorec-
tal cancer development.
For that purpose, we provided gene ontology anal-
ysis, and inspected the molecular functions and the
biological processes of a particular set of genes that
were overrepresented among all biomarkers. Further-
more, using the overrepresented genes, we performed
tests over the Bayesian classifier. However, the results
showed decreased precision when using only the en-
riched sets of genes as a training set. This implicated
a conclusion that for successful Bayesian modelling,
we need larger amount of data which implicates more
detailed description of the statistical distribution of
the data.
To test the methodology relevance for biomark-
ers discovery, we used another set of biomarkers, re-
trieved from the same data sets using the GEO2R on-
line tool. Comparing the sets, we perceived that at
Illumina microarray data, 84 genes overlap, whereas
at Affymetrix microarray data, the number of over-
lapped genes is 32. In addition, we retrained our
Bayesian classifier with the new biomarkers. The re-
sults for the Illumina chip were promising, since the
overlapping set is larger, whereas the results for the
Affymetrix chip were a complete failure. This once
again confirmed that our methodology for significant
genes revealing produces more biologically signifi-
cant biomarkers.
Considering the colorectal cancer significance of
the biomarker genes, we exhibit few biomarkers that
are proved to be related to the disease. This was
again supported by the fact that the same significant
biomarkers are also found in the intersection between
our biomarkers and the GEO2R biomarkers.
Therefore, in this paper we confirmed that our
previously developed methodology for biomarkers re-
vealing provided successful generative model for tis-
sues and patients recognition, and for the biomarkers
involved in this model, we confirmed that they are re-
lated to the colorectal cancer using the GEO2R online
tool.
Further investigations are needed to validate our
results and to identify the scientific and applicative
potential of the biomarkers for molecular diagnostics,
evaluation and prognostic purposes in patients with
colorectal cancer.
REFERENCES
Ahn, W. S., Kim, K.-W., Bae, S. M., Yoon, J. H., Lee,
J. M., Namkoong, S. E., Kim, J. H., Kim, C. K., Lee,
Y. J., and Kim, Y.-W. (2003). Targeted cellular pro-
cess profiling approach for uterine leiomyoma using
cdna microarray, proteomics and gene ontology anal-
ysis. International journal of experimental pathology,
84(6):267–279.
IJCCI2013-InternationalJointConferenceonComputationalIntelligence
404

Ashburner, M., Ball, C. A., Blake, J. A., Botstein, D.,
Butler, H., Cherry, J. M., Davis, A. P., Dolinski, K.,
Dwight, S. S., Eppig, J. T., et al. (2000). Gene ontol-
ogy: tool for the unification of biology. Nature genet-
ics, 25(1):25.
Baba, M., Itoh, K., and Tatsuta, M. (2004). Glycine-
extended gastrin induces matrix metalloproteinase-1-
and-3-mediated invasion of human colon cancer cells
through type i collagen gel and matrigel. International
journal of cancer, 111(1):23–31.
Benita, Y., Cao, Z., Giallourakis, C., Li, C., Gardet, A.,
and Xavier, R. J. (2010). Gene enrichment profiles re-
veal t-cell development, differentiation, and lineage-
specific transcription factors including zbtb25 as a
novel nf-at repressor. Blood, 115(26):5376–5384.
Camici, M. (2008). Guanylin peptides and colorectal cancer
(crc). BioMedicine & pharmacotherapy, 62(2):70–76.
Chan, S. K., Griffith, O. L., Tai, I. T., and Jones, S. J. (2008).
Meta-analysis of colorectal cancer gene expression
profiling studies identifies consistently reported can-
didate biomarkers. Cancer Epidemiology Biomarkers
& Prevention, 17(3):543–552.
Cohen, M. B., Hawkins, J. A., and Witte, D. P. (1998).
Guanylin mrna expression in human intestine and col-
orectal adenocarcinoma. Laboratory investigation,
78(1):101–108.
Ferrero, S., Buffa, R., Pruneri, G., Siccardi, A., Pelagi, M.,
Lee, A., Coggi, G., and Bosari, S. (1995). The preva-
lence and clinical significance of chromogranin a and
secretogranin ii immunoreactivity in colorectal adeno-
carcinomas. Virchows Archiv, 426(6):587–592.
GEO ,2013. Gene Expression Omnibus.
GLOBOCAN, 2008.
Harris, M., Clark, J., Ireland, A., Lomax, J., Ashburner,
M., Foulger, R., Eilbeck, K., Lewis, S., Marshall, B.,
Mungall, C., et al. (2004). The gene ontology (go)
database and informatics resource. Nucleic acids re-
search, 32(Database issue):D258.
Hinoue, T., Weisenberger, D. J., Lange, C. P., Shen, H.,
Byun, H.-M., Van Den Berg, D., Malik, S., Pan,
F., Noushmehr, H., van Dijk, C. M., et al. (2012).
Genome-scale analysis of aberrant dna methylation in
colorectal cancer. Genome Research, 22(2):271–282.
Holla, V. R., Backlund, M. G., Yang, P., Newman,
R. A., and DuBois, R. N. (2008). Regulation
of prostaglandin transporters in colorectal neoplasia.
Cancer Prevention Research, 1(2):93–99.
Holmans, P., Green, E. K., Pahwa, J. S., Ferreira, M. A.,
Purcell, S. M., Sklar, P., et al. (2009). Gene ontology
analysis of gwa study data sets provides insights into
the biology of bipolar disorder. American journal of
human genetics, 85(1):13.
Hong, Y., Downey, T., Eu, K., Koh, P., and Cheah, P.
(2010). A metastasis-prone signature for early-stage
mismatch-repair proficient sporadic colorectal cancer
patients and its implications for possible therapeutics.
Clinical and Experimental Metastasis, 27(2):83–90.
Hui, Y., Kang, T., Xie, L., and Yuan-Yuan, L. (2010).
Digout: Viewing differential expression genes as out-
liers. Journal of Bioinformatics and Computational
Biology, 8(supp01):161–175.
Imai, K., Hirata, S., Irie, A., Senju, S., Ikuta, Y., Yokomine,
K., Harao, M., Inoue, M., Tsunoda, T., Nakatsuru,
S., et al. (2008). Identification of a novel tumor-
associated antigen, cadherin 3/p-cadherin, as a pos-
sible target for immunotherapy of pancreatic, gastric,
and colorectal cancers. Clinical Cancer Research,
14(20):6487–6495.
Jain, K. (2004). Applications of biochips: From diagnos-
tics to personalized medicine. Current opinion in drug
discovery & development, 7(3):285–289.
Jette, C., Peterson, P. W., Sandoval, I. T., Manos, E. J.,
Hadley, E., Ireland, C. M., and Jones, D. A. (2004).
The tumor suppressor adenomatous polyposis coli and
caudal related homeodomain protein regulate expres-
sion of retinol dehydrogenase l. Journal of Biological
Chemistry, 279(33):34397–34405.
Jia, P., Wang, L., Meltzer, H. Y., and Zhao, Z. (2010). Com-
mon variants conferring risk of schizophrenia: a path-
way analysis of gwas data. Schizophrenia research,
122(1):38–42.
Jiang, W., Li, X., Rao, S., Wang, L., Du, L., Li, C., Wu,
C., Wang, H., Wang, Y., and Yang, B. (2008). Con-
structing disease-specific gene networks using pair-
wise relevance metric: application to colon cancer
identifies interleukin 8, desmin and enolase 1 as the
central elements. BMC systems biology, 2(1):72.
Jorissen, R., Lipton, L., Gibbs, P., Chapman, M., Desai,
J., Jones, I., Yeatman, T., East, P., Tomlinson, I.,
Verspaget, H., et al. (2008). Dna copy-number alter-
ations underlie gene expression differences between
microsatellite stable and unstable colorectal cancers.
Clinical Cancer Research, 14(24):8061–8069.
Kinzler, K. W. and Vogelstein, B. (1996). Lessons from
hereditary review colorectal cancer. Cell, 87:159–170.
Kling, K., Kim, F., Cole, M., and McFadden, D. (1999). B-
cell leukemia protein-2 and peptide yy chemotherapy
resistance in colon cancer. The American journal of
surgery, 178(5):411–414.
Lascorz, J., Chen, B., Hemminki, K., and F
¨
orsti, A.
(2011a). Consensus pathways implicated in progno-
sis of colorectal cancer identified through systematic
enrichment analysis of gene expression profiling stud-
ies. PloS one, 6(4):e18867.
Lascorz, J., Hemminki, K., F
¨
orsti, A., et al. (2011b). Sys-
tematic enrichment analysis of gene expression profil-
ing studies identifies consensus pathways implicated
in colorectal cancer development. Journal of carcino-
genesis, 10(1):7.
Li, P., Lin, J., Marszlowicz, G., Valentino, M., Chang, C.,
Schulz, S., Pitari, G., and Waldman, S. (2009). Gcc
signaling in colorectal cancer: Is colorectal cancer a
paracrine deficiency syndrome? Drug news & per-
spectives, 22(6):313.
Masaki, T., Matsuoka, H., Sugiyama, M., Abe, N., Goto,
A., Sakamoto, A., and Atomi, Y. (2001). Matrilysin
(mmp-7) as a significant determinant of malignant po-
tential of early invasive colorectal carcinomas. British
journal of cancer, 84(10):1317.
GeneOntologyAnalysisofColorectalCancerBiomarkersProbedwithAffymetrixandIlluminaMicroarrays
405

Mori, M., Barnard, G. F., Mimori, K., Ueo, H., Akiyoshi, T.,
and Sugimachi, K. (1995). Overexpression of matrix
metalloproteinase-7 mrna in human colon carcinomas.
Cancer, 75(S6):1516–1519.
Nature (2006). Nature milestones — cancer.
Needham, C., Manfield, I., Bulpitt, A., Gilmartin, P., and
Westhead, D. (2009). From gene expression to gene
regulatory networks in arabidopsis thaliana. BMC sys-
tems biology, 3(1):85.
Pagani, A., Papotti, M., Abbona, G., Bussolati, G., et al.
(1995). Chromogranin gene expressions in colorec-
tal adenocarcinomas. Modern pathology: an official
journal of the United States and Canadian Academy
of Pathology, Inc, 8(6):626.
Roeb, E., Arndt, M., Jansen, B., Schumpelick, V., and
Matern, S. (2004). Simultaneous determination of
matrix metalloproteinase (mmp)-7, mmp-1,-3, and-13
gene expression by multiplex pcr in colorectal carci-
nomas. International journal of colorectal disease,
19(6):518–524.
Sabates-Bellver, J., Van der Flier, L., de Palo, M., Cat-
taneo, E., Maake, C., Rehrauer, H., Laczko, E.,
Kurowski, M., Bujnicki, J., Menigatti, M., et al.
(2007). Transcriptome profile of human colorectal
adenomas. Molecular Cancer Research, 5(12):1263–
1275.
Simjanoska, M., Bogdanova, A. M., and Popeska, Z.
(2013a). Bayesian posterior probability classification
of colorectal cancer probed with affymetrix microar-
ray technology. In 36th International Convention on
Information and Communication Technology, Elec-
tronics and Microelectronics, MIPRO, CIS Intelligent
Systems.
Simjanoska, M., Bogdanova, A. M., and Popeska, Z.
(2013b). Recognition of colorectal carcinogenic tissue
with gene expression analysis using bayesian proba-
bility. In ICT Innovations 2012, Advances in Intelli-
gent Systems and Computing, volume 207, pages 305–
314. Springer Berlin Heidelberg.
Smith, G., Carey, F. A., Beattie, J., Wilkie, M. J., Light-
foot, T. J., Coxhead, J., Garner, R. C., Steele, R. J.,
and Wolf, C. R. (2002). Mutations in apc, kirsten-ras,
and p53alternative genetic pathways to colorectal can-
cer. Proceedings of the National Academy of Sciences,
99(14):9433–9438.
Subramanian, A., Tamayo, P., Mootha, V. K., Mukher-
jee, S., Ebert, B. L., Gillette, M. A., Paulovich,
A., Pomeroy, S. L., Golub, T. R., Lander, E. S.,
et al. (2005). Gene set enrichment analysis: a
knowledge-based approach for interpreting genome-
wide expression profiles. Proceedings of the National
Academy of Sciences of the United States of America,
102(43):15545–15550.
Wang, K., Li, M., and Hakonarson, H. (2010). Analysing
biological pathways in genome-wide association stud-
ies. Nature Reviews Genetics, 11(12):843–854.
Watanabe, T., Kobunai, T., Toda, E., Yamamoto, Y.,
Kanazawa, T., Kazama, Y., Tanaka, J., Tanaka, T.,
Konishi, T., Okayama, Y., et al. (2006). Distal col-
orectal cancers with microsatellite instability (msi)
display distinct gene expression profiles that are dif-
ferent from proximal msi cancers. Cancer research,
66(20):9804–9808.
Wu, Z. and Aryee, M. (2010). Subset quantile normaliza-
tion using negative control features. Journal of Com-
putational Biology, 17(10):1385–1395.
Xu, Y., Xu, Q., Yang, L., Liu, F., Ye, X., Wu, F., Ni, S., Tan,
C., Cai, G., Meng, X., et al. (2013). Gene expression
analysis of peripheral blood cells reveals toll-like re-
ceptor pathway deregulation in colorectal cancer. PloS
one, 8(5):e62870.
Zhang, Z., Xu, L., Chen, M., and Zhang, J. (1997). Ex-
pression of vasoactive intestinal peptide receptor in
human colonic carcinoma cell membranes]. Hua xi
yi ke da xue xue bao= Journal of West China Uni-
versity of Medical Sciences= Huaxi yike daxue xue-
bao/[bian ji zhe, Hua xi yi ke da xue xue bao bian wei
hui], 28(4):380.
Zheng, Q. and Wang, X.-J. (2008). Goeast: a web-based
software toolkit for gene ontology enrichment analy-
sis. Nucleic acids research, 36(suppl 2):W358–W363.
Zinzindohou
´
e, F., Lecomte, T., Ferraz, J.-M., Houllier,
A.-M., Cugnenc, P.-H., Berger, A., Blons, H., and
Laurent-Puig, P. (2005). Prognostic significance of
mmp-1 and mmp-3 functional promoter polymor-
phisms in colorectal cancer. Clinical cancer research,
11(2):594–599.
IJCCI2013-InternationalJointConferenceonComputationalIntelligence
406
