
Clustering and Classifying Text Documents
A Revisit to Tagging Integration Methods
Elisabete Cunha
1,2,3
, Álvaro Figueira
1
and Óscar Mealha
2
1
CRACS/INESCTEC, Universidade do Porto, Rua do Campo Alegre, 1021/1055, 4169-007, Porto, Portugal
2
CETAC.MEDIA,Universidade de Aveiro, Campus de Santiago, 3810-193, Aveiro, Portugal
3
ESE, IPVC, Av. Capitão Gaspar de Castro – Apartado 513, 4901-908, Viana do Castelo, Portugal
Keywords: Semantic Document Classification, Clustering, Tagging, Seed Selection, k-means, k-C, Cosine Similarity.
Abstract: In this paper we analyze and discuss two methods that are based on the traditional k-means for document
clustering and that feature integration of social tags in the process. The first one allows the integration of
tags directly into a Vector Space Model, and the second one proposes the integration of tags in order to
select the initial seeds. We created a predictive model for the impact of the tags’ integration in both models,
and compared the two methods using the traditional k-means++ and the novel k-C algorithm. To compare
the results, we propose a new internal measure, allowing the computation of the cluster compactness. The
experimental results indicate that the careful selection of seeds on the k-C algorithm present better results to
those obtained with the k-means++, with and without integration of tags.
1 INTRODUCTION
As a result of an unsupervised text clustering
process, the documents are distributed among a set
of groups (the “clusters”). It is expected that similar
documents are placed on the same cluster and
dissimilar documents in different ones.
A clustering algorithm is expected to be both
efficient (fast at execution time, even with a large
input) and effective (creating coherent clusters).
However, although there are several clustering
algorithms (Theodoridis and Koutroumbas, 2009),
their advantages and disadvantages won’t allow the
finding of one which fulfills these two properties for
any input type and size.
Our investigation intends to assess how social
classification, namely by the use of social tags, may
contribute to improve the effectiveness of automatic
document grouping.
In this article we will revisit two tag integration
methods previously proposed. Our starting base is
the k-means algorithm, considered one of the “top
10 algorithms” in data mining (Wu et al., 2007),
mainly because of its efficiency (Feldman and
Sanger, 2007, Theodoridis and Koutroumbas, 2009).
The first tag integration model (Cunha and
Figueira, 2012) allows their integration on the
document vectors (document representation in a
Vector Space Model) through a parameter called
Social Slider (SS) which allows attributing different
weights to tags accordingly to their occurrence in the
document. In order to predict the integration impact,
a theoretical model was created. We describe this
model and the obtained results, which suggest that
using cosine similarity approaches the documents
that share the same tags and sets apart those which
do not have tags in common.
The second integration model is based on
Communities Detection in the network of tags,
enabling a careful seed selection. This new
algorithm was named k-Communities (Cunha et al.,
2013) and is different from the k-means algorithm
not only because of the initial seed selection but also
because it introduces a new way to calculate the
centroids in each iteration of the clustering process.
In this article we compare both tag integration
methods. To perform this comparison we use
external evaluation measures which allow
comparing automatic clusters with manual clusters.
Further on, we introduce an internal evaluation
index that allows measuring compactness and
separation among clusters. Separation is measured
through the distance between centroids and
compactness through the network of documents,
where each document is linked to its closest one.
The k-means++ and k-Communities algorithms
160
Cunha E., Figueira Á. and Mealha Ó..
Clustering and Classifying Text Documents - A Revisit to Tagging Integration Methods.
DOI: 10.5220/0004545201600168
In Proceedings of the International Conference on Knowledge Discovery and Information Retrieval and the International Conference on Knowledge
Management and Information Sharing (KDIR-2013), pages 160-168
ISBN: 978-989-8565-75-4
Copyright
c
2013 SCITEPRESS (Science and Technology Publications, Lda.)

are executed with and without integration of tags.
2 SOCIAL CLASSIFICATION
The evolution of the World Wide Web led to the rise
and growth of new concepts like Web 2.0 and the
Social Web, in which users have access to a set of
applications that allow them to interact with each
other by easily publishing, editing and sharing
content (for example, blogs, wikis, video sharing
systems, photo sharing systems, etc.).
However, the massive user participation creates a
growing flow of information which again requires
new ways to recover information (Lee et al., 2009).
The dynamics which occur among Web 2.0 users
are naturally providing interesting ways to help
organize information by creating folksonomies
. The
term folksonomy (Wal, 2007) was created by
Thomas Vander Wal and derives from the
agglutination of the terms folk and taxonomy.
Folksonomies naturally arise when a set of users,
interested in some information, decide to describe it
through comments, or by attributing tags (Snuderl,
2008), providing important elements to categorize
that information. The power that resides in creating a
folksonomy is visible in initiatives like the one
carried out by the Library of Congress or at
steve.museum research project (Trant, 2008).
The Library of Congress launched a pilot project
on Flickr, a popular photo sharing website, which
consisted of an open invitation to the general public
to tag and describe two sets of approximately 3000
historical photographs (Springer et al., 2008). The
initiative was a success, generating a massive
growing movement, typical to the Web 2.0
communities.
steve.museum research project is another
example which relies on cooperation between
museum professionals and other entities who believe
social tagging may provide new ways to describe
and access cultural object collections, besides
promoting visitor interaction.
According to Trant (Trant, 2008), when
implementing the steve.museum project prototype,
the analyses of the tags attributed by common
museum users showed they did not match the terms
used by museum professionals. To minimize the gap
between professional language and common
language, social tagging was used as a promising
addition to museum records as its terminology is
usable in some king of searches (although this
possibility stills has to be verified by a large scale
study) (Trant, 2008).
In fact, “[it] is still uncertain that [a] new
folksonomy will replace traditional hierarchy but
now that all users have the power to classify
according to their own language, research will never
be the same” (Dye, 2006).
Still, in Trant (Trant, 2008) it is said that the
museum professionals general opinion is that the
tags attributed by users may be interesting even
though its pertinence may require validation.
However, self-normalization theories state that
folksonomic tags will self regulate, the collective
vocabulary will become more consistent in time and
all without need for an external imposed control
(Trant, 2009).
The initiatives conducted in these two projects
demonstrate an awareness of the potentialities
emerging from using the collective intelligence
generated from a folksonomy.
3 k-means ALGORITHM
The k-means algorithm was the starting point for
this investigation specially because of its simplicity
and efficiency (Feldman and Sanger, 2007,
Theodoridis and Koutroumbas, 2009). Its time
complexity by iteration is, in the worst case, O(kn)
but the number of iterations is generally quite small.
The k-means algorithm (MacQueen, 1967)
allows the partition of an initial set of documents
(each document is represented as a vector) in k
clusters. The algorithm starts by selecting k random
seeds and then calculates the distance from each
document to every seed, grouping each document to
its nearest seed. When all clusters are formed, the
new centroids become the mean of the document
vectors on each cluster. Each document is then
associated to the nearest centroid. The process ends
when convergence is achieved, or in other words,
when there are no more changes.
Despite the efficiency, the random choice of
seeds may lead to bad clustering examples. In this
sense, Arthur e Sergei Vasilvitskii (Arthur and
Vassilvitskii, 2007) proposed the k-means++
algorithm to overcome that fault, which chooses the
seeds according to specific probabilities. Its
complexity is O(log k) and the experimental results
show a shrinkage on the number of iterations until
convergence is achieved. However, the number of
clusters is still unknown, a parameter which greatly
influences the quality of the formed clusters.
ClusteringandClassifyingTextDocuments-ARevisittoTaggingIntegrationMethods
161

4 INTEGRATION MODEL
In this section we revisit two proposed tag
integration methods. The first method allows,
through a parameter called Social Slider, the
attribution of weights to tags accordingly to their
occurrence in the document (Cunha and Figueira,
2012). The second approach consists in using a
network of tags to determine the seeds that allow
initializing the k-C algorithm (Cunha et al., 2013)
(which, such as the k-means algorithm, initiates with
k seeds).
4.1 Tags in Vector Space Model
The tag integration model (Cunha and Figueira,
2012) is based on the occurrence of tags on the
content of the document, weighted according to a
parameter called SS (Social Slider). Let
,
,…,
be a set of documents;
,
,…,
and
,
,…,
be
respectively the bag of words and tags which may
appear in the documents. There are several
possibilities for the occurrence of a tag in a
document: the tag does not appear in the document;
the tag appears only once; the tag appears more than
once. Each case is attributed a different weight as
shown on Fig. 1. Every tag vector (
) is changed:
to each vector coordinate is added the number of
times the tag occurs in the document and, finally
each coordinate is multiplied by the SS parameter
accordingly to the tags occurrence in the document.
The calculation ends with the replacement of the
coordinates on the document vectors (
) by their
respective coordinates on the tag vector.
Figure 1: Integration Model.
4.2 Similarity Measures
The tag integration model was based on the
construction of a prediction model that relies on the
similarity measures, most commonly used to
implement the k-means algorithm, which are the
Euclidean distance and the Cosine Similarity.
When intending to weight tags accordingly to
their occurrence in the document, it emerges the
need to predict its impact: if documents get closer
when using common tags or if they get more distant
when they are not sharing any tags.
4.2.1 Euclidean Distance and Cosine
Similarity
Using Euclidian distance it is easy to conclude that
the Social Slider parameter must vary between 0 and
1 in order to allow shortening the distance between
documents sharing tags.
On the other hand, the idea to predict the impact
of cosine similarity is to analyze the influence of tag
integration through the cosine of the angle formed
between documents after tag integration (cos(a)).
So, considering the cosine of angle between
two documents before tag integration we have:
cos
∑
‖
‖
‖
‖
(1)
Where
,
,…,
and
,
,…,
Therefore, by writing the new angle cosine using
the initial coordinates it is possible to change the
value of the SS parameter and verify how the cosine
of the angle varies after tag integration (cos(a)).
Using the integration model, and without losing
generality, we will assume that coordinates
and
correspond to the frequency of the same tag,
coincident with the tag associated with both
documents. Therefore, the coordinates which have
tags associated are updated providing, through
algebraic manipulation, the angle cosine formed by
the new vectors can be expressed using the
parameters present in equation (1):
cos
1
‖
‖
‖
‖
cos
1
(2)
Where:
1
1
2
∑
1
1
2
∑
In order to show the impact of tags integration
we elaborated several graphs, considering
documents with norms close to 10, 30 and 100, as
seen in fig. 2. When the SS increases (or, in other
KDIR2013-InternationalConferenceonKnowledgeDiscoveryandInformationRetrieval
162
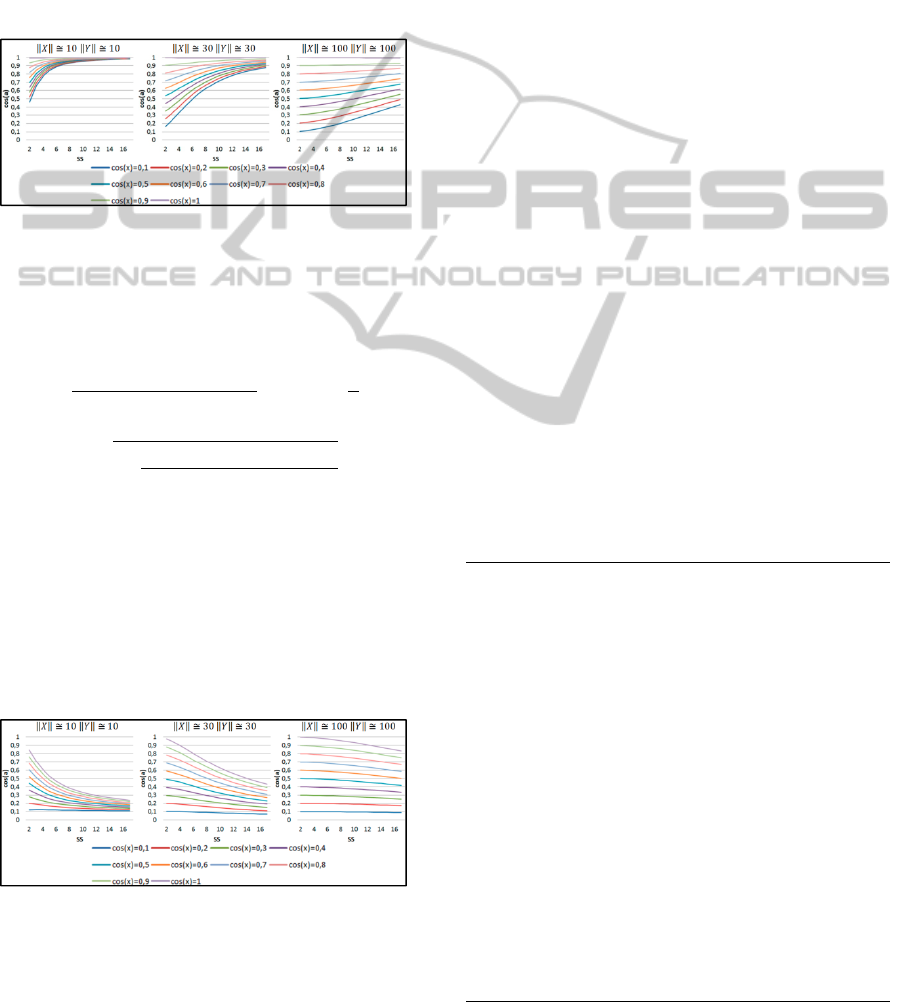
words, when tags are given a greater importance),
the cosine similarity tends to approach 1,
independently of documents being close or far
before integration. This means the angle formed
between documents tends to become zero.
Similarly, we analyzed the tag integration impact
on all other situations which result in tag
differentiation (whether they exist or not in the
document) and it showed a positive impact even
though it depended on the weight given to each
situation described in the model.
Figure 2: variation between two documents
sharing tags which appear in both document texts.
On the other hand, it is important to understand
what happens between documents which do not
share tags. The new angle cosine is given by (3):
cos
1
‖
‖
‖
‖
cos
1
(3)
Where:
1
1
2
∑
For example, analyzing the specific case where
two documents don’t share the same tag but it
appears once in the document to which it is not
associated, we can observe, looking at fig. 3, that
when SS increases, the angle cosine decreases, i.e.,
the angle between documents becomes bigger.
However, as the vectors norm increases, the angle
cosine only starts to change on increasingly larger
SS values.
Figure 3:
cosa
variation between two documents which
do not share tags which also appear in both document
texts.
When analyzing all the other situations between
documents which did not share tags, it showed the
angle between documents increased when
documents don’t share tags.
Accordingly to this prediction model, it was
expected for documents sharing the same tags to be
closer and documents not sharing tags to be further
apart.
4.3 k-Communities Algorithm
The second approach is still based on k-means
algorithm but uses community detection, for a
network of tags, for the initial seed selection (recall
this is one of the main problems of the k-means).
We use cosine similarity as the similarity
measure because of its independence from document
length, allowing the pattern identification between
documents that share the same words but not exactly
with the same frequencies, and also because the
prediction model expects a positive impact among
documents sharing the same tags, whenever the
integration occurs directly on the document’s
vectors (as described on Section 4.1). Note that in
traditional k-means when cosine similarity is chosen
to implement the k-means algorithm the new
centroid selection is still made through Euclidean
distance since the new centroid is calculated
throughout the mean of the vectors in each cluster.
Using two measures simultaneously may provide
inconsistent results. Therefore, we propose the k-
Communities (k-C) algorithm (Cunha et al., 2013)
which is described below:
Listing 1: K-C algorithm.
1. Select k seeds using community detection in a
network of tags (where documents are nodes and
each edge is the connection between documents that
share a tag ): each seed is the document that has the
greater degree inside its community.
2. Compute the cosine similarity between each
document and all seeds.
(a) If the cosine similarity between a document
and all centroids is zero then stop calculating.
Go to step 1 and add this document to the
seeds set.
(b) Else if generates clustering by assigning each
document to its closest seed.
3. Compute the new centroid for each cluster, the
chosen document is the one who gets maximum sum
as shown in Equation (4)
cos
,
(4)
4. Go to step 2. The process ends when convergence is
achieved, i.e., no more changes occur.
ClusteringandClassifyingTextDocuments-ARevisittoTaggingIntegrationMethods
163
5 EVALUATION MEASURES
It is a standard procedure to use internal and external
evaluation measures in order to assess an
algorithm’s quality. The internal ones intend to
measure compactness and separation. I.e., whether
the groups are well separated and simultaneously the
documents inside the clusters are close together.
However, it all depends on the documents on a
determined dataset because we may find documents
which are apparently far apart inside its cluster,
however, this may only mean that they belong to the
same area but are semantically unrelated with the
other documents in the cluster. Therefore, we may
have an internal evaluation measure which indicates
the documents are too far apart within the cluster but
that might be the only organization that makes sense.
Despite human judging being subjective, it is
also important to consider external evaluation
measures when intending to measure the
coincidence degree between the automatically
formed clusters and the manually formed ones.
In this article we propose a new internal
evaluation measure and revisit some of the external
evaluation measures most commonly used in
literature.
5.1 Maximum Cosine Index
There are several internal evaluation measures found
in literature. The way compactness and separation
are measured often varies. For example, on the Dunn
Index (Dunn, 1974), compactness is calculated using
the square root of the maximum distance between
any two points in the same cluster, therefore using
the documents diameter. On the other hand, the DB
Index (Davies and Bouldin, 1979) calculates
compactness based on the similarities between each
cluster and all other clusters, measuring the sum of
two clusters dispersion.
We consider that, more than the distance
between documents in each cluster, it is important to
find out if each document and its nearest document
belong in the same cluster. Therefore, our proposal
intends to measure the compactness according to this
principle, and separation through the distance
between each cluster’s centroid. For each cluster is
chosen the distance to the closest cluster, building
the measure on the worst case as on the DB index
(Davies and Bouldin, 1979).
To perform the Maximum Cosine Index (MCI),
we need to build a network of documents where
each document is connected to its nearest document
(according to cosine similarity). It is intended to
measure the distance from each cluster to its nearest
cluster and assess how many times it is superior to
the mean of the distances between each document
and its nearest document within each cluster.
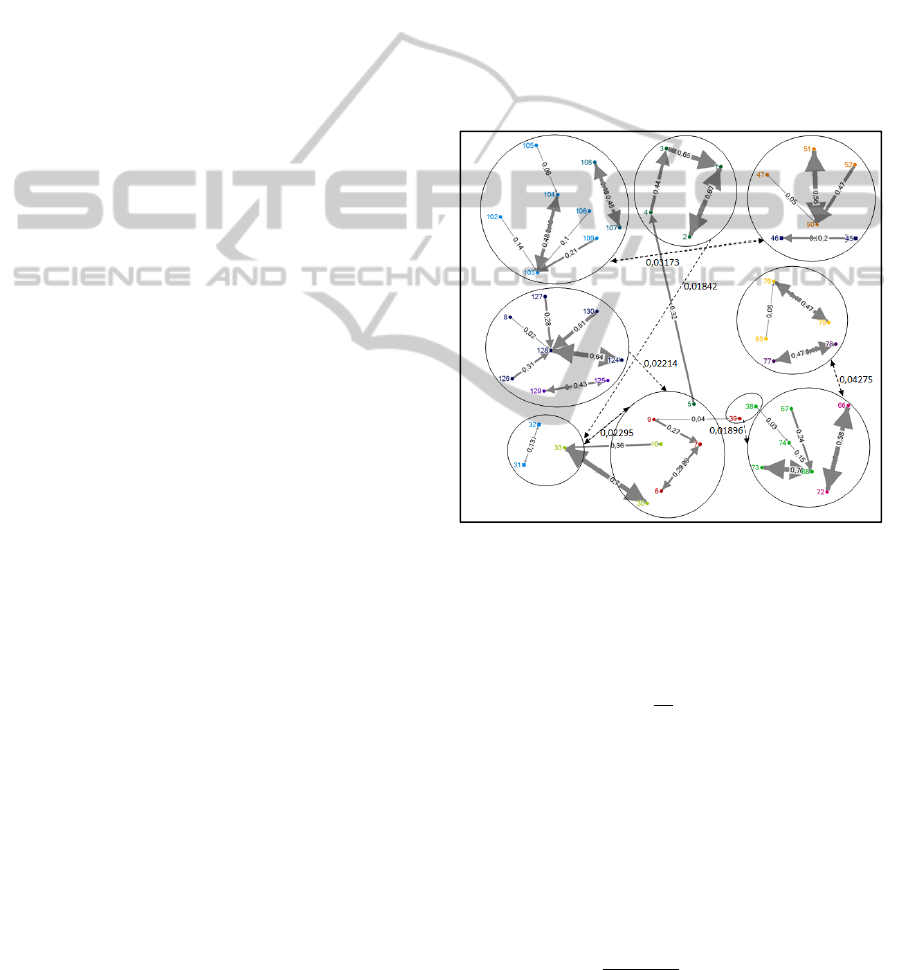
In fig. 4 we can see the documents belonging to
each cluster. The dashed arrows indicate the distance
from each cluster to its closest cluster and the other
arrows indicate the distance between each document
to its closest document.
In every cluster the connected documents are
identified with a different color. The process gives
different weights to the distances inside each cluster
according to their connected component (each
connected component will have the same weight as
the number of its documents).
Figure 4: Representation of the closest document to each
document and the distance between each cluster and its
closest cluster.
The proportion between the clusters compactness
and separation is given by the equation (5):
(5)
Where:
- weighted average of the observed distances to the
nearest document inside each cluster
– distance to the closest cluster.
Then the weighted average of the several clusters
is determined. The weight of each cluster depends
on the proportion of documents which have their
closest document inside the cluster as shown by
equation (6):
∑
∑
(6)
KDIR2013-InternationalConferenceonKnowledgeDiscoveryandInformationRetrieval
164

Where:
– total number of documents on cluster i that have the
nearest document inside the cluster
– number of documents on cluster i
In the example shown on fig. 4, we see that, on
average, the distance between clusters is 13,8 times
superior to the average of distances seen in the
inside of each cluster.
5.1 Revisiting External Evaluation
Measures
Some external evaluation measures are based on a
direct comparison between manual and automatic
groups, such as the purity measure (Feldman and
Sanger, 2007), while other measures are based on
the different relations which may exist in a
collection of documents between the n(n-1)/2 pairs
of documents, such as the F1 measure, precision,
recall e Rand Index (Manning et al., 2009).
Therefore, to calculate these measures it is necessary
to know the various relations possible between the
pairs of documents: True Positives (TP); True
Negatives (TN); False Positives (FP); False
Negatives (FN).
The Purity measure compares the clusters
manually organized with the automatic clusters,
selecting for each manual cluster the most similar
automatic cluster. The percentage of common
documents is given by (7), where L={L
1
,L
2
,…,L
m
}
is the set of classes and C={C
1
,C
2
,…,C
m
} is the set
of clusters.
,
1
|
|
(7)
F
1
measure corresponds to the harmonic mean
between Recall and Precision.
Precision is the percentage of pairs of
documents which are correctly placed in the same
cluster.
(8)
Recall is the percentage of pairs of documents
which are correctly placed in the same cluster
among the pairs of documents that are or should be
in the same cluster.
(9)
Thus, F
1
is computed as shown in equation (10).
2
(10)
Rand Index computes the percentage of correct
decisions, pairs of documents that are correctly
placed in the same cluster and the pairs of
documents that are correctly placed in different
clusters.
2
(11)
6 EXPERIMENTAL RESULTS
In this article we describe 3 case studies where we
used the k-means++ algorithm and the k-C
algorithm, with and without integration of tags. The
tag integration was made using the parameter Social
Slider (SS) for SS=0, SS=5 and SS=30. According
to the documents norm, this parameter provides a
general view of the process from 0 (no tag
integration) to 30 (huge impact on documents
distances).
The datasets (each one with approximately 50
documents) were created using documents from our
personal library and from our University’s Digital
Library. Since this is hierarchically organized
collection, we chose some Faculties and then picked
papers from specific scientific areas. Each dataset
has documents from six different areas as shown in
Table 1 and we considered as tags the key-words
given by the authors of each scientific paper.
The evaluation was made using internal measure
proposed in this paper and the external measures
described in the same section.
Table 1: Manual classes of each data set.
Dataset Classes
D
1
Clustering, statistics, Mathematics, History,
Sport and Biology
D
2
Clustering, statistics, Health, Sport, Biology
and Mathematics
D
3
Clustering, usability, Health, Sport, Biology
and Mathematics
6.1 Internal Evaluation
As seen in Table 2, the k-C algorithm obtains better
results than the k-means++ algorithm in almost
every performed test. The only case where the k-
means++ algorithm had better results was on dataset
D2 with SS=5, even though the difference isn’t
particularly significant.
We may also see that as the SS parameter
increases it also increases the average distance to the
nearest cluster, in comparison to the distances
ClusteringandClassifyingTextDocuments-ARevisittoTaggingIntegrationMethods
165
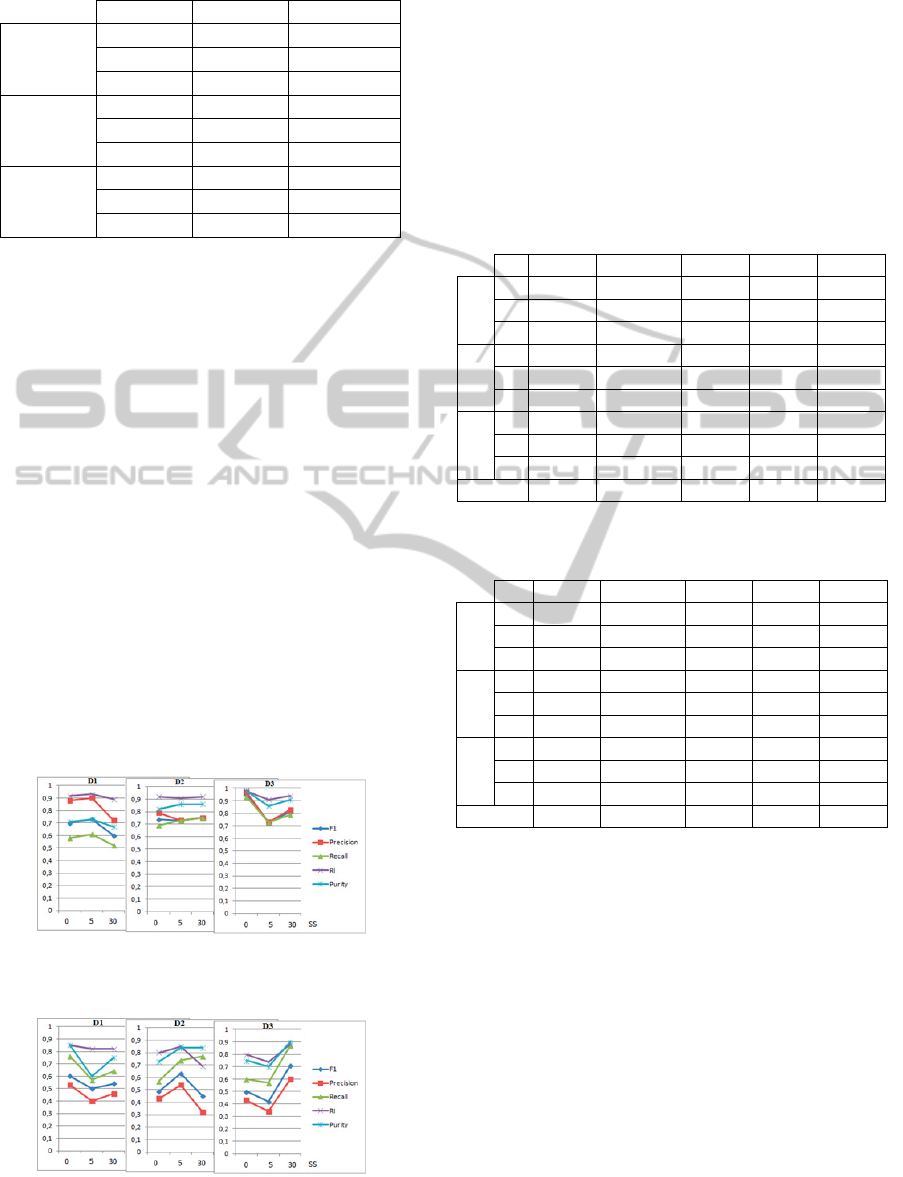
Table 2: MCI results.
SS k-C k-means++
D1
0 13.746 3.731
5 74.923 8.589
30 400.047 80.630
D2
0 4.359 1.701
5 13.621 14.521
30 181.874 101.966
D3
0 19.673 5.189
5 157.450 3.993
30 1354.626 148.494
observed to the nearest document inside each
cluster. This confirms that using cosine similarity
and tag integration approaches the documents
sharing the same tags are set apart from those who
do not have those tags.
6.2 External Evaluation
Comparing the external evaluation measures to the
k-C and the k-means++ algorithms (fig. 5 and fig.
6), we found out that if in the k-C algorithm the
results vary between 0.5 and 1, on the k-means++
algorithm they vary between 0.3 and 0.9. This means
there is a greater dispersion on the k-means++
algorithm.
It shows that tag integration has a greater impact
on the k-means++ algorithm, more specifically on
datasets D2 and D3 where parameter SS=5 and
parameter SS=30 provide better results than when
tags are not used.
In the k-C algorithm we only find better results
on dataset D1 when using parameter SS=5.
Figure 5: External measures results for data sets D1, D2
and D3 using the k-C algorithm.
Figure 6: External measures results for data sets D1, D2
and D3 using the k-means++ algorithm.
Observing the Table 3 and Table 4 we can confirm
that, even though the integration of tags, using
parameter SS, has a small impact when using the k-
C algorithm, it still produces, on average, better
results when comparing to the k-means++ algorithm.
Increasing SS we end up forcing the approach of
documents which share tags and were not initially
near, as well as set apart the documents that do not
share tags. This sometimes results in forming
clusters further apart than those manually created.
Table 3: External evaluation results for k-C algorithm.
SS F
1
Precision Recall RI Purity
D
1
0
0.70 0.88 0.58 0.92 0.71
5
0.73 0.90 0.61 0.93 0.73
30
0.60 0.72 0.52 0.89 0.67
D
2
0
0.74 0.79 0.69 0.92 0.82
5
0.73 0.73 0.73 0.91 0.86
30
0.75 0.75 0.75 0.92 0.86
D
3
0
0.95 0.97 0.93 0.98 0.98
5
0.73 0.73 0.73 0.91 0.86
30
0.81 0.83 0.79 0.94 0.91
Average
0.75 0.81 0.7 0.92 0.82
Table 4: External evaluation results for k-means++
algorithm.
SS F
1
Precision Recall RI Purity
D
1
0
0.60 0.53 0.76 0.85 0.85
5
0.50 0.40 0.57 0.82 0.60
30
0.54 0.46 0.64 0.82 0.75
D
2
0
0.49 0.43 0.57 0.80 0.73
5
0.63 0.54 0.74 0.85 0.84
30
0.45 0.32 0.77 0.69 0.84
D
3
0
0.50 0.43 0.60 0.80 0.75
5
0.42 0.34 0.57 0.74 0.70
30
0.71 0.60 0.87 0.88 0.90
Average
0.54 0.45 0.68 0.81 0.77
The average Recall value shows that both
algorithms have a close percentage of pairs of
documents that belong to different clusters and that
should be part of the same cluster. However, the
average Precision value, indicates that the k-C
algorithm presents an improvement of 36% in
comparison with the k-means algorithm. Therefore,
the k-C algorithm presents a greater number of pairs
of documents that are correctly classified in the
same cluster. Hence, the F
1
measure, which is the
harmonic mean between Recall and Precision,
indicates that the k-C algorithm is the one that
presents better results, 75% versus 54%.
The Rand Index shows that the k-C algorithm
has in average more 11% of correct decision (True
Positives and True Negatives) when compared to the
KDIR2013-InternationalConferenceonKnowledgeDiscoveryandInformationRetrieval
166

k-means++ algorithm.
Finally, the average purity also shows better
results for the k-C algorithm, indicating that these
clusters are more similar to those that are manually
organized.
Comparing the results of these external
evaluation measures with the results of the internal
evaluation measures we can conclude that even
when the Maximum Cosine Index indicates an
improvement with the increase of the SS
parameter, it does not necessarily means there is a
corresponding improvement in grouping
effectiveness.
7 CONCLUSIONS
In this paper we compared two methods of tag
integration to perform the effectiveness of the
automatic clustering.
Having the k-means as the base algorithm for
both approaches, the first method builds on giving
weights to tags according to their relevance in the
documents' content through a parameter called
Social Slider. To implement this method we
constructed a model to predict the clustering results
according to the selected similarity measure,
showing that the use of the cosine similarity
leveraged the approximation of documents with
common tags, as well as the separation of documents
with no common tags.
The second method uses the information
provided by tags to select the seeds, originating a
clustering algorithm called k-C algorithm, similar to
the k-means algorithm but with a different method to
find the centroids in each iteration.
To assess the results we used internal and
external measures for the k-means and k-C
clustering algorithms.
The integration of tags through the Social Slider
Parameter shows that the distance between
documents with common tags is reduced and the
distance between those that do not share tags is
increased. Note that, as the SS increased, the
distance between clusters became bigger when
compared to the distances between documents inside
the clusters (regarding the distance between the
documents and their closest documents).
The results of the internal measure also show that
the k-C algorithm provides better results than the k-
means++ algorithm. However, the effectiveness of
the formed clusters is not proportional to the
increase of the SS parameter.
The external measures show some improvements for
the k-means++ algorithm but sometimes for SS=5
and others to the parameter SS=30. The same
happens with the k-C algorithm but with a smaller
impact. Even though, generically the k-C algorithm
provided better results. Therefore, using the
information provided by tags to select the initial
seeds (second method) seems to produce better
results.
ACKNOWLEDGEMENTS
This work is funded by the Portuguese Government
through FCT — Fundação para a Ciência e a
Tecnologia. Reference: SFRH/BD/46616/2008.
REFERENCES
Arthur, D. & Vassilvitskii, S. 2007. k-means++: the
advantages of careful seeding. Proceedings of the
eighteenth annual ACM-SIAM symposium on Discrete
algorithms. New Orleans, Louisiana: Society for
Industrial and Applied Mathematics.
Cunha, E. & Figueira, Á. 2012. Automatic Clustering
Assessment through a Social Tagging System. In: The
15th IEEE International Conference on
Computational Science and Engineering, 5-7 Dec.
2012 Paphos, Cyprus. 74-81.
Cunha, E., Figueira, Á. & MEALHA, O. 2013. Clustering
Documents Using Tagging Communities and
Semantic Proximity In: 8th Iberian Conference on
Information Systems and Technologies (CISTI), in
press.
Davies, D. L. & Bouldin, D. W. 1979. A Cluster
Separation Measure. Pattern Analysis and Machine
Intelligence, IEEE Transactions on, PAMI-1, 224-227.
Dunn, J. C. 1974. Well separated clusters and optimal
fuzzy-partitions Journal of Cybernetics, Vol. 4 pp. 95-
104.
Dye, J. 2006. Folksonomy: A game of high-tech (and
high-stakes) tag, Wilton, CT, ETATS-UNIS, Online.
Feldman, R. & Sanger, J. 2007. The Text Mining
Handbook Advanced Approaches in Analyzing
Unstructured Data, Cambridge University Press.
Lee, C. S., Goh, D. H.-L., Razikin, K. & Chua, A. Y. K.
2009. Tagging, Sharing and the Influence of Personal
Experience.
Macqueen, J. 1967. Some Methods for Classification and
Analysis of MultiVariate. Proceedings of the fifth
Berkeley Symposium on Mathematical Statistics and
Probability. University of California Press.
Manning, C., Raghavan, P. & Schütze, H. 2009. An
Introduction to Information Retrieval, Cambridge
University Press. Cambridge, England.
ClusteringandClassifyingTextDocuments-ARevisittoTaggingIntegrationMethods
167

SnuderL, K. 2008. Tagging: Can user – generated content
improve our service? Statiscal Jounal of the IAOS 25,
125-132.
Springer, M., Dulabahn, B., Michel, P., Natanson, B.,
Reser, D., Woodward, D. & Zinkham, H. 2008. For
The Common Good: The Library of Congreess. Flichr
Pilot Project – Report Summary.
Theodoridis, S. & Koutroumbas, K. 2009. Pattern
Recognition, Fourth Edition, Academic Press.
Trant, J. 2008. Tagging, Folksonomy and Art Museums:
Results of Steve museum’s research [Online].
Available:http://verne.steve.museum/SteveResearchRe
port2008.pdf [Accessed 2011].
Trant, J. 2009. Studying Social Tagging and Folksonomy:
A Review and Framework.
Wal, V. 2007. Folksonomy Coinage and Definition
[Online].Available:http://vanderwal.net/folksonomy.ht
ml [Accessed 2011].
Wu, X., Kumar, V., Quinlan, J. R., Ghosh, J., Yang, Q.,
Motoda, H., 2007. Top 10 algorithms in data mining.
Knowl. Inf. Syst., 14, 1-37.
KDIR2013-InternationalConferenceonKnowledgeDiscoveryandInformationRetrieval
168
