
Improving the Performance of Speaker Verification Systems under
Noisy Conditions using Low Level Features and Score Level Fusion
Nassim Asbai
1,2
, Messaoud Bengherabi
1
, Farid Harizi
1
and Abderrahmane Amrouche
2
1
Centre for Development of Advanced Technologies, Algiers, Algeria
2
Speech Com. & Signal Proc. Lab., Faculty of Electronics and Computer Sciences, USTHB,
Bab Ezzouar, 16 111, Algeria
Keywords: MFCCs, LFCCs, Asymmetric Tapers, Score Fusion, NOISEX-92, TIMIT Corpus.
Abstract: This paper provides an overview of low-level features for speaker recognition, with an emphasis on the
recently proposed MFCC variant based on asymmetric tapers (MFCC asymmetric from now on); which has
proven high noise robustness in the context of speaker verification. Using the TIMIT corpus the
performance of the MFCC-asymmetric is compared with: the standard Mel-Frequency Cepstral Coefficients
(MFCC) and The Linear Frequency Cepstral Coefficients (LFCC) under clean and noisy environments. To
simulate real world conditions, the verification phase was tested with two noises (babble and factory) at
different Signal-to-Noise Ratios (SNR) issued from NOISEX-92 database. The experimental results showed
that MFCCs-asymmetric tapers (k=4) outperform other features in noisy condition. Finally, we have
investigated the impact of consolidating evidences from different features by score level fusion. Preliminary
results show promising improvement on verification rate with score fusion.
1 INTRODUCTION
In the last five decades people have come forward to
investigate various aspects of speech such as
mechanical realization of speech signal (Fry, 1959),
human machine interaction (Teeni et al., 2007),
speech and speaker recognition (identification and
verification) (Sambur, 1972). In this context, a
speech signal is usually the bearer of a message to
another person. The word can contain a lot of
information such as the language spoken by the
speaker or even indications of age or speaker’s
identity. However, speaker verification is one
biometric system that uses speech as a tool for
detecting the identity of the person who produced it.
Speaker verification systems typically use
acoustic parameters calculated from short-term
spectrum characteristics of the signal and the
envelope of the spectrum. In this paper, the
performance of MFCC-asymmetric (Alam et al.,
2012);
(Juan et al., 2011) is compared with: the
standard Mel-Frequency Cepstral Coefficients
(MFCC) (Harris, 1978) and the Linear Frequency
Cepstral Coefficients (LFCC) (Xing et al., 2009)
under clean and noisy environments. The focus of
this work is to evaluate the effect of front-end on the
performance of our speaker verification system
based on gaussian mixture model- universal
background model (GMM-UBM) as a baseline
classifier under clean and noisy environments. The
Gaussian mixture model (GMM) with universal
background model UBM, has proven to be
extremely efficient for characterizing speaker
identity at the acoustic level (Xing et al., 2009). In
this approach, speaker models are obtained from the
normalization of a universal background model
(UBM) (Reynolds et al., 2000). The UBM is usually
trained by means of the Expectation-Maximization
(EM) algorithm from a background dataset, which
includes a wide range of speakers, languages (for
Multilanguage application), communication
channels, recording devices, and environments. The
GMM-UBM (Reynolds et al., 2000) becomes a
standard technique for text-independent speaker
verification due to its reliable performance,
especially after the introduction of the maximum a
posteriori adaptation coupling the client and the
UBM model.
The contribution of this paper is twofold. First,
presenting a comparative study of the classical and
recently proposed short-term features. Second,
investigating the possibility of improving the
performance of speaker verification systems by
33
Asbai N., Bengherabi M., Harizi F. and Amrouche A..
Improving the Performance of Speaker Verification Systems under Noisy Conditions using Low Level Features and Score Level Fusion.
DOI: 10.5220/0004525500330038
In Proceedings of the 10th International Conference on Signal Processing and Multimedia Applications and 10th International Conference on Wireless
Information Networks and Systems (SIGMAP-2013), pages 33-38
ISBN: 978-989-8565-74-7
Copyright
c
2013 SCITEPRESS (Science and Technology Publications, Lda.)

score level fusion on different features.
The outline of paper is as follows. In sections 2,
we describe the different feature vectors used in this
work. At section 3, we give the experimental
protocol adopted and the results that found at section
4. Finally, a conclusion is given in Section 5.
2 FEATURE EXTRACTION
OVERVIEW
The speech signal continuously changes due to
articulatory movements and therefore, the signal
must be analyzed within short frames of about 20–
30 ms duration. Within this interval, the signal is
assumed to remain stationary and a spectral feature
vector is provided for each frame.
2.1 Mel-Frequency Cepstral
Coefficients (MFCCs)
and Linear Frequency Cepstral
Coefficients (LFCCs)
The mel-frequency cepstral coefficients (MFCCs)
(Harris, 1978) were introduced in early 1980s for
speech recognition applications and since then have
also been adopted for speaker identification
applications. A sample of speech signal is first
extracted through a window. Typically, two
parameters are important for the windowing
procedure: the duration of the window (ranges from
20–30 ms) and the shift between two consecutive
windows (ranges from 10–15 ms) (Harris, 1978) The
values correspond to the average duration for which
the speech signal can be assumed to be stationary or
its statistical and spectral information does not
change significantly. The speech samples are then
weighed by a suitable windowing function, such as,
Hamming or Hanning window (Harris, 1978), that
are extensively used in speaker verification. The
weighing reduces the artifacts (such as side lobes and
signal leakage) due to the use of a finite duration
window size for analysis. The magnitude spectrum of
the speech sample is then computed using a fast
Fourier transform (FFT). For a discrete signal {x[n]}
with 0 <n <N, where N is the number of samples of
an analysis window, is the sampling frequency, the
discrete Fourier transform (DFT) is used and is given
by equation bellow:
2
1
0
/2
)()()(
N
t
Ntfi
etxtwfS
(1)
Where
1i
is the imaginary unit and
1,...,1,0
Nf
denotes the discrete frequency
index. Here,
T
Nwww )]1()...0([ is a time-
domain window function which usually is
symmetric and decreases towards the frame
boundaries. Then,
)( fS
is processed by a bank of
band-pass filters. The filters that are generally used
in MFCC computation are triangular filters (Moore,
1995), and their center frequencies are chosen
according a logarithmic frequency scale, also known
as Mel-frequency scale. The filter bank is then used
to transform the frequency bins to Mel-scale bins by
the following equations:
2
fSfwbm
f
by
(2)
where
b
w
is the
th
b Mel-scale filter’s weight for
the frequency
f
and
fS
is the FFT of the
windowed speech signal. The rationale for choosing
a logarithmic frequency scale conforms to the
response observed in the human auditory system that
has been validated through several biophysical
experiments (Moore, 1995). The Mel-frequency
weighted magnitude spectrum is processed by a
compressive non-linearity (typically a logarithmic
function) which also models the observed response
in a human auditory system. The last step in MFCC
computation is a discrete cosine transform (DCT)
which is used to de-correlate the Mel-scale filter
outputs. A subset of the DCT coefficients are chosen
(typically the first and the last few coefficients are
ignored) and represent the MFCC features used in
the enrollment and the verification phases. The
Linear Frequency Cepstral Coefficients (LFCCs)
(Xing et al., 2009) are similar to MFCCs, with a
difference in the structure of the Mel filter bank. In
the high frequency region, the Mel filters was
replaced by a linear filter bank in order to capture
more spectral details in this region.
2.2 MFCCs based on Asymmetric
Tapers
Usually, speaker/speech recognition systems for
short-time analysis of a speech signal use standard
symmetric- tapers such as Hamming, Hann, etc.
These tapers have a poor magnitude response under
mismatched conditions and a larger time delay
(Alam et al., 2012). One elegant technique for
reducing the time delay and enhancing the
magnitude response under noisy conditions is to
SIGMAP2013-InternationalConferenceonSignalProcessingandMultimediaApplications
34
replace symmetric tapers by asymmetric tapers (Juan
et al., 2011). The method based on asymmetric
tapers is an extension of the conventional windowed
using symmetric tapers. From a symmetric
taper
)(nw
s
of length N, the instantaneous phase
)(n
computed by applying a Hilbert transform to
the symmetric taper. Then, the asymmetric taper is
)(nw
at
obtained as:
)(
)()(
nk
sat
encwnw
,
10 Nn
(3)
where
n
is the time index, )(nw
s
is the symmetric
taper of length N,
)(nk
e
is an asymmetric function,
k
is a parameter that controls the degree of
asymmetry, and
c
is the normalizing constant given
by
))(max(
))(max(
)(nk
s
s
enw
nw
c
,
10 Nn
(4)
(a)
0 20 40 60 80 100 120 140
0
0.2
0.4
0.6
0.8
1
1.2
1.4
1.6
1.8
2
Amplitude
Samples
(b)
0 20 40 60 80 100 120 140
0
0.2
0.4
0.6
0.8
1
1.2
1.4
1.6
1.8
2
Amplitude
Samples
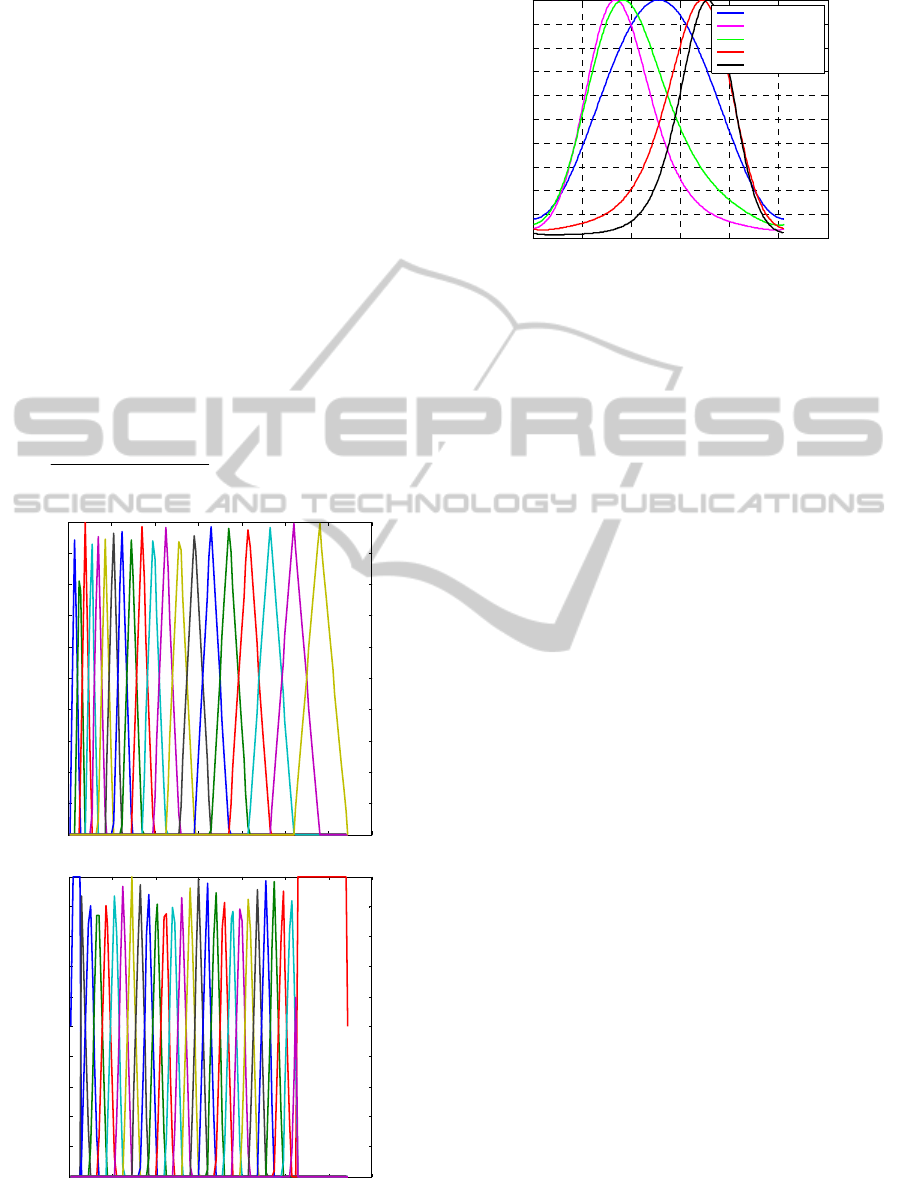
Figure 1: a) Mel filterbanks, b) Linear filterbanks.
0 50 100 150 200 250 300
0
0.1
0.2
0.3
0.4
0.5
0.6
0.7
0.8
0.9
1
Samples
Amplitude
Baseline taper
Asy-taper(k=-1.41)
Asy-taper(k=-2.21)
Asy-taper(k=2.31)
Asy-taper(k=4)
Figure 2: Comparison between symmetric Hamming and
asymmetric tapers.
3 SPEAKER VERIFICATION
PROTOCOL
Speaker verification experiments are carried out on
the TIMIT corpus which consists of read speech
sampled at 16 kHz. It involves 168 speakers with
168 client scores and 28056 impostor scores. For
each target speaker, approximately 15seconds of
training data is available whereas duration of the test
utterances is 9 seconds. Gaussian mixture model
with the universal background model (GMM-UBM)
(Reynolds et al., 2000) is used as the classifier.
Otherwise, for each enrolment utterance, a GMM
with 32 components (Reynolds et al, 2000) is trained
with the extracted spectral features, using
Expectation Maximization algorithm (EM)
(Kinnunen et al., 2009). We normalized the client
GMM likelihood by
the universal background model
(UBM) likelihood, which is widely used in speaker
verification. Our UBM is a GMM with 128
components trained via EM algorithm using speech
from a large number of speakers (42 min). In
parameterization phase, we specified the feature
space used. Indeed, as the speech signal is dynamic
and variable, we presented the observation
sequences of various sizes by vectors of fixed size.
Each vector is given by the coefficients Mel
Cepstrum MFCC (23 coefficients), extracted from
the middle window every 10 ms. In Asymmetric
taper MFCCs features (23 coefficients), we used
different values of the parameter k (k=-2.21, -1.41,
2.31 and 4) .And in LFCCs parameterization, the
feature vectors dimensionality is the same as MFCC
vectors. Hence, we have conducted verification tests
with added noises (Babble-speech and factory)
extracted from the database Noisex-92 (NATO: AC
243/RSG 10) at different level of SNR (0, 5, 10 and
15 dB).
ImprovingthePerformanceofSpeakerVerificationSystemsunderNoisyConditionsusingLowLevelFeaturesandScore
LevelFusion
35
4 EXPERIMENTAL RESULTS
4.1 Speaker Verification in Quite
Environment
In this section, we compare the performance of
MFCCs, LFCCs and Asymmetric taper MFCC in
term of EER in clean environment (SNR ≥ 40 dB).
0 5 10 15 20 25 30 35 40
0
5
10
15
20
25
30
35
40
False Acceptation Rate (%)
False Reject Rate (%)
DET curve
MFCC: EER=1.19% .
TASTA-LFCC: EER=10.78% .
Asy-taper (k=-2.21): EER=4.5% .
Asy-taper (k=-1.41): EER=2.97% .
Asy-taper (k=2.31): EER=4.16% .
Asy-taper (k=4): EER=1.73% .
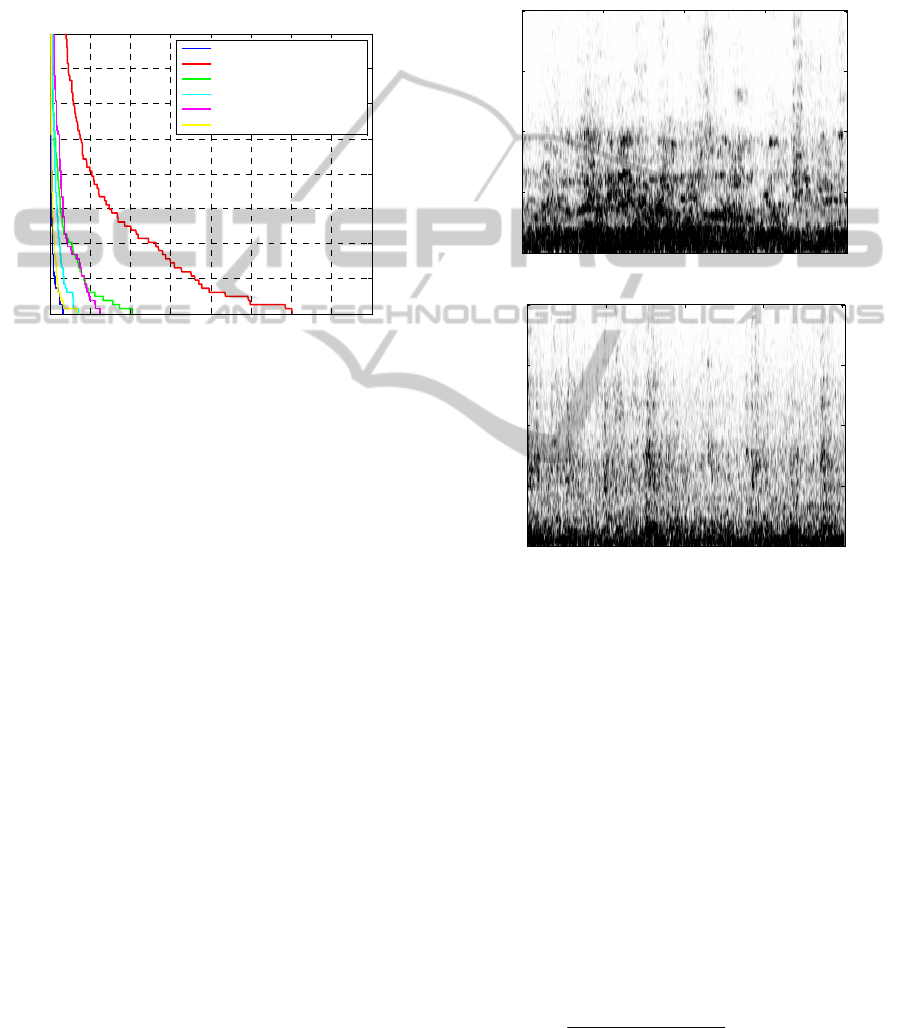
Figure 3: DET curves.
As shown in Figure 3, we find that, MFCC
(EER=1.19%) and MFCC based on asymmetric
tapers (EER=1.73%) outperform RAST-LFCC
(EER=10.78%). This can be caused by the fact that
LFCCs have more filterbanks in high frequency
region, which differs from the mechanism of
perception of the human ear at this region.
4.2 Speaker Verification in Noisy
Environment
To test the performances of all feature methods with
real noise, we used some of the noise samples
babble-speech and factory extracted from the
NOISEX-92 database shown by Figure 4. These
noises were added to test speech data after being
scaled.
From the
Table 1, it is observed that, despite a drops
accuracy of all methods as SNR decreases, we find
that asymmetric tapers appear robust in noisy
conditions than other features extraction methods.
Also, It is observed from the same table that the
asymmetric tapers performed better than the
symmetric Hamming taper in the most of the noisy
conditions (babble and factory) in term of ERR.
Compared to the baseline Hamming taper,
asymwind with k=4 provides an improvement in
term of EER of 30.35%, 14.88% under babble noise
at SNR = 0dB, 5 dB, 40.72%, 32.73 % under factory
noise at SNR = 0dB, 5dB.In LFCC method, the
spectrum energy in the high frequency region of
speech is weak and it is more susceptible to noise
corruption. As Linear Frequency Cepstral
Coefficients has more filterbanks in this region (high
frequency), so it is less robust in the noises that
characterized by high frequency than MFCC and
asymmetric tapers in term of EER.
(a)
Time (msecs)
Freq. (KHz)
0 500 1000 1500 200
0
0
2
4
6
8
(b)
Time (msecs)
Freq. (KHz)
0 500 1000 1500 200
0
0
2
4
6
8
Figure 4: Spectrograms of a) Babble noise, b) Factory
noise.
4.3 Score Fusion
A further step toward improving of the performance
of speaker verification system is investigating a
possible complimentarily between different features.
For this aim, several techniques of fusion (simple
sum, max, min and SVM bi-class based on RBF
kernel) have been applied to the scores of different
systems using different parameters. Also, in order to
evaluate the performance of our scores fusion
approaches in terms of EER, we calculated the
relative improvement between EER of each method
of scores fusion and best EER given by best taper in
Table 1.
fusion best taper
best taper
EER EER
RI 100
EER
(5)
SIGMAP2013-InternationalConferenceonSignalProcessingandMultimediaApplications
36
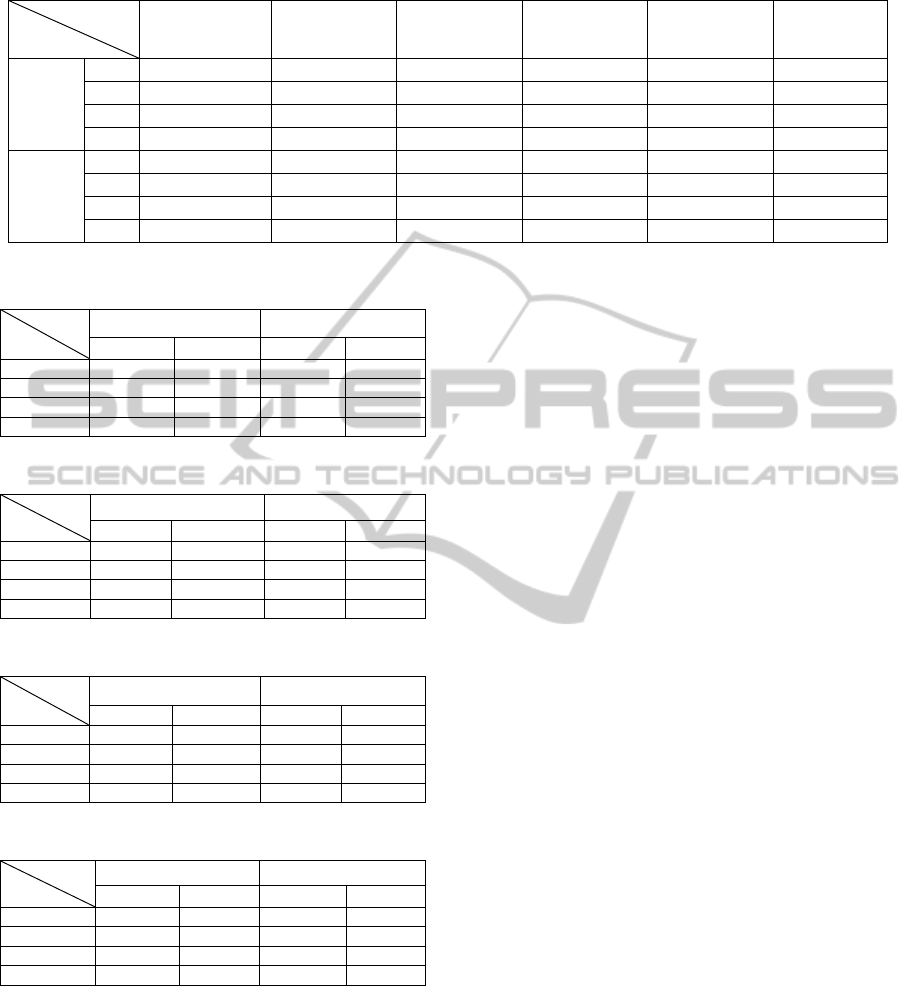
Table 1: Equal Error Rate (EER%) of all methods under noisy environment.
Features
SNR
Baseline
(MFCC)
RASTA-LFCC
MFCC-ASY
K=-1.41
MFCC-ASY
K=-2.21
MFCC-ASY
K=2.31
MFCC-ASY
K=4
Babble
15
8.16 23.44 6.10 3.81 4.59 2.38
10
18.09 28.92 13.81 8.29 10.98 5.96
5
25.52 33.70 25.28 21.71 22.62 14.88
0
34.20 39.01 35.76 32.90 33.37 30.35
Factory
15
12.89 19.46 9.59 10.47 9.71 7.14
10
23.49 24.28 24.28 23.21 22.77 18.45
5
35.36 35.16 37.41 35.60 35.71 32.73
0
44.70 42.33 44.48 43.65 42.26 40.72
Table 2: Equal Error Rate (EER) of sum fusion.
Noise
SNR
Babble Factory
EER(%) RI(%) EER(%) RI(%)
0 30.37 0.07 37.70 -7.42
5 19.64 31.99 28.21 -13.81
10 7.74 29.87 13.79 -28.51
15 1.86 -21.85 5.52 -22.69
Table 3: Equal Error Rate (EER) of min fusion.
Noise
SNR
Babble Factory
EER(%) RI(%) EER(%) RI(%)
0 34.84 14.79 34.86 -14.39
5 26.58 78.63 29.76 -9.07
10 16.83 82.38 19.80 7.32
15 8.92 74.79 11.90 66.67
Table 4: Equal Error Rate (EER) of max fusion.
Noise
SNR
Babble Factory
EER(%) RI(%) EER(%) RI(%)
0 31.54 3.62 44.64 9.63
5 17.44 17.20 37.50 14.57
10 5.38 -9.73 13.76 -25.42
15 2.38 0 8.40 17.65
Table 5: Equal Error Rate (EER) of svm fusion.
Noise
SNR
Babble Factory
EER(%) RI(%) EER(%) RI(%)
0 19.04 -37.27 24.40 -40.08
5 13.08 -12.10 19.64 -39.99
10 7.74 29.87 18.34 -0.60
15 2.97 24.79 11.31 58.40
As shown in Table 1, 2, 3 and 4 there is an
improvement in terms of ERR when a scores fusion
is applied to the different feature vectors (MFCCs,
RASTA-LFCCs and asymmetric MFCCs), this
validates our assumption about the complimentarily
existing between these parameters. Also it is
observed that, at level SNR = 10 dB and 15 dB, the
simples methods (for example fusion with sum:
Babble noise: EER = 7.74% at 10dB and EER =
1.86% at 15 dB. Factory noise: EER = 13.79% at
10dB and EER = 5.52% at15 dB) provide better
results compared to SVM. By cons, in situations
where the environment is very noisy (SNR = 0 dB
and 5 dB), we see that, the SVM provides a
significant improvement in term of ERR (Babble
noise: EER = 19.04% at 0dB and EER = 13.08% at
5 dB. Factory noise: EER = 24.40% at 0dB and EER
= 19.64% at 5 dB). This can be explained by the fact
that in low-noisy environments (SNR> = 10dB), the
scores issued from different classifiers are linearly
separable therefore a simple linear fusion can do the
trick (good results). By cons, when environment
becomes very noisy (SNR <10 dB), data (scores)
become non-linearly separable (overlapping data),
so here SVM appears better than simple methods.
5 CONCLUSIONS
In this paper, different feature extraction methods
were studied for speaker verification system based
on GMM-UBM classifier in clean and noisy
conditions. MFCC outperformed LFCC and MFCC
based on asymmetric tapers in calm conditions.
However, under two different additive noise types,
factory and babble noises, MFCC based on
asymmetric tapers (k=4) gave the best performances
than other. When a fusion score have applied on our
features, we observed that this fusion brings an
important amelioration in performance of GMM-
UBM model. The focus of our work, was to find the
features which provide a good speaker verification
performances in term of equal error rate, especially
under real world in goal to use them in our future
works.
ImprovingthePerformanceofSpeakerVerificationSystemsunderNoisyConditionsusingLowLevelFeaturesandScore
LevelFusion
37

REFERENCES
Alam, J., Kenny, P., and O Shaughnessy, D., EUSIPCO,
2012. Robust Speech Recognition under Noisy
Environments using Asymmetric Tapers Proc.
Alam. J., Kenny, P., and O Shaughnessy, D., June 2012.
On the Use of Asymmetric-shaped Tapers for Speaker
Verification using I-Vectors Proc. Odyssey Speaker
and Language Recognition Workshop, Singapore.
Ambikairajah, E., 2007. Emerging features for speaker
recognition. In: Proc. Sixth Internat. IEEE Conf. on
Information, Communications & Signal Processing,
Singapore, pp. 1–7.
Chaudhari, U., Navratil, J., Maes, S., 2003. Multigrained
modeling with pattern specific maximum likelihood
transformations for text-independent speaker
recognition. IEEE Trans. Speech Audio Process. 11
(1), 61–69.
Fry, D. B., 1959. Theoritical Aspects of Mechanical
speech Recognition. Universtiy College London,
J.British Inst. Radio Engr., 19:4,211-299.
Harris, F. (1978). On the use of windows for harmonic
analysis with the discrete Fourier transform.
Proceedings of the IEEE, 66(1), 51-84.
Juan, A., Morales-Cordovilla, Victoria Sánchez, Antonio
Peinado, M., and Ángel Gómez, M., September,
2011.On the use of asymmetric windows for robust
speech recognition. Circuits, Systems and Signal
Processing (Springer).
Kinnunen T., Li, H., August 2009. An overview of text
independent speaker recognition: From features to
supervectors. Speech Communication 52, 12–40,
ScienceDirect.
Moore, B., (1995). Hearing. Academic Press, Inc., ISBN
0-12-505626-5.
Rabiner,L., Juang, B. H., 1993. Fundamentals of Speech
Recognition. Englewood Cliffs, NJ: Prentice-Hall.
Reynolds, D. A., Quatieri, T. F. and Dunn, R. B. Jan.
2000. Speaker verification using adapted Gaussian
mixture models. Dig Sig. Proc., vol. 10, no. 1, pp. 19–
41.
Rozman, R., Kodek, D. M., Jan 2007.Using asymmetric
windows in automatic speech recognition. Speech
Comm., vol. 49, pp. 268-276.
Sambur, M. R., 1972. Speaker recognition and verification
using linear prediction analysis. Ph. D. Dissert, M.I.T.
Teeni, D., Carey, J. and Zhang, P., Hoboken (2007).
Human Computer Interaction: Developing Effective
Organizational Information Systems, John Wiley &
Sons.
Xing Fan and John H. L. Hansen, ICASSP 2009.Speaker
Identification with Whispered Speech based on
modified LFCC Parameters and Feature Mapping.
Taipei, Taiwan.
SIGMAP2013-InternationalConferenceonSignalProcessingandMultimediaApplications
38
