
CQE
An Approach to Automatically Estimate the Code Quality using an Objective Metric
From an Empirical Study
Saima Arif, Miao Wang, Philip Perry and John Murphy
School of Computer Science and Informatics, University College Dublin, Dublin, Ireland
Keywords:
Static Analysis, Code Quality, Process Metrics.
Abstract:
Bugs in a project, at any stage of Software life cycle development are costly and difficult to find and fix.
Moreover, the later a bug is found, the more expensive it is to fix. There are static analysis tools to ease the
process of finding bugs, but their results are not easy to filter out critical errors and is time consuming to
analyze. To solve this problem we used two steps: first to enhance the bugs severity and second is to estimate
the code quality, by Weighted Error Code Density metric. Our experiment on 10 widely used open-source Java
applications automatically shows their code quality estimated using our objective metric. We also enhance the
error ranking of FindBugs, and provide a clear view on the critical errors to fix as well as low priority ones to
potentially ignore.
1 INTRODUCTION
Generally, the software development process includes
the development phase followed by testing phase. The
software development lifecycle (SDLC) often goes
through a number of iterations from the development
to testing phase. In this case the interface offer oppor-
tunities to reduce time taken for entire SDLC to en-
hance the quality of software. Software quality is im-
portant as it leads to significant cost (testing) saving
in SDLC (Boehm et al., 1976). Assessing the qual-
ity of software is largely subjective. In this paper,
we explore the possibility to assess software quality
by using an objective metric. Metric that can pro-
vide short interval feedback to improve a process is
well known in the field of project management. It is
highlighted in the software domain by T.DeMarco’s
expression “You can’t control what you can’t mea-
sure” (Daniel, 2004). The quality metric presented in
this paper enables developers and testers to introduce
a feedback loop in the system. The advantage of their
feedback loop is to reduce the time taken to develop a
product and the cost of overall system development.
Code quality should be investigated carefully to
uncover potential errors/bugs, before handing over
software to testing teams. There are different static
analysis approaches/tools like PMD, glint and Find-
Bugs to ensure the quality of code. The goal of static
analysis is to uncover and remove coding problems.
These coding problems might produce run-time errors
for example dereferencing a null pointer and array
overflows (Ayewah and Pugh, 2009). However, due to
many variations in coding styles and logic flows de-
tecting code errors with 100% accuracy is not always
possible. Here, we focus on bug report generated by
FindBugs (FB)
1
. In such cases, reports produced by
static code analysis tools (such as FB) might contain
a large number of false positives (FP). The generated
report needs to be further assessed manually by expe-
rienced developers (Shen et al., 2011).
The scope of this paper is use of an objective met-
ric, ranking of FB reports and tailor them according
to company requirements. Code quality can be cal-
culated automatically and is useful in providing feed-
back to developers and testers. It is advantageous to
know the code quality prior to any performance eval-
uation. This metric can have applications in terms of
comparing the code developed by individuals or par-
ticular teams. This approach will enable project man-
agers to assemble teams that are known to produce
good quality codes.
The research work mentioned in this paper primar-
ily focuses on code quality estimation based on soft-
ware bugs. Inefficient coding style and knowledge in-
troduces bugs during the development process. Com-
panies are trying to find and fix bugs in early phase of
1
http://findbugs.sourceforge.net/findbugs2.html
198
Arif S., Wang M., Perry P. and Murphy J..
CQE - An Approach to Automatically Estimate the Code Quality using an Objective Metric From an Empirical Study.
DOI: 10.5220/0004492901980205
In Proceedings of the 8th International Joint Conference on Software Technologies (ICSOFT-EA-2013), pages 198-205
ISBN: 978-989-8565-68-6
Copyright
c
2013 SCITEPRESS (Science and Technology Publications, Lda.)

SDLC, as bugs that are found late are difficult to fix.
1.1 Novel Approach
In this paper, we present the Code Quality Estima-
tor (CQE), which is built on top of the FB technique.
It offers more detailed error ranking strategy to auto-
matically estimate the code quality for efficient deci-
sion making process. CQE approach is a three-step
process, which consists of: a) surveying experienced
developers with a large number of FB reports to cre-
ate a knowledge base with a list of multi-categorized
bugs. b) applying the knowledge base to enhance the
FB report of a given JAR. c) calculating the quality
metric to automatically estimate the code quality.
The final output of our approach is the measure-
ment of “Error code density” (ECD) of given JAR. To
estimate the code quality, project managers can then
compare the value of ECD against their pre-defined
thresholds. ECD can vary between different organi-
zations or even different teams within the same or-
ganization. The contribution of our work is listed as
following:
• Providing a clear breakdown of a list of bugs with
more detailed categories than FB. It allows user to
effectively identify the most and the least critical
errors to reduce the bug fixing task.
• Automatically calculating the quality metric of a
given JAR, using a static knowledge base on an
initial survey process.
• Easing the decision making process to determine
the code quality in a timely manner. It helps to
avoid unnecessary time spent on selecting exter-
nal JARs as well as analyzing the quality of inter-
nal JARs.
The structure of rest of paper is organized as fol-
low: in Section 2 we present the background knowl-
edge for the FB and its general issues. In Section 3
quality metrics are explained. In Section 4 the CQE
methodology will be detailed. Section 5 will show
our experiment results. In Section 6 a number of re-
lated works will be discussed and conclusion and fu-
ture work will be drawn in Section 7.
2 BACKGROUND KNOWLEDGE
OF FINDBUGS
FB is a static analysis tool used to obtain informa-
tion about bug patterns. This bug patterns are possi-
ble errors in java code. The overwhelming number of
700,000 downloads (Shen et al., 2011) is an indicator
of its popularity in industrial and research projects.
It was also an essential analyzer in developing Java
programs in Google (Ayewah et al., 2007). It uses
different set of bug detectors for detecting bug pat-
terns. There are seven categories and 400 bug pat-
terns associated with these categories. Categories are:
bad practice, correctness, malicious code vulnerabil-
ity, multithreaded correctness, performance, security
and dodgy code.
It generates report with the priority of errors as
“High” and “Medium”. Priorities are hard-coded by
tool developers. It is possible that high priority errors
are of high FP rates, as the priority is set by devel-
opers according to their experiences (Kim and Ernst,
2007). The problem with FB report is that it does not
provide information about the frequency of particu-
lar error categories as well as their patterns. It does
not provide any statistical results. Statistical measure
saves developer’s time to go through only those cate-
gories and their patterns which they want to fix with
priority. Currently, FB does not provide any real qual-
ity metric or mechanism to quickly address these is-
sues. Lack of quality estimation makes it difficult to
be used to pre-justify code quality. It is quite hard
to judge code quality by just looking at reports with-
out any indication of the frequency of particular error
report.
There is a need for an additional assistive system
to enhance the reports generated by FB and provide
quantitative measures. Some mechanisms need to
be established where programmer can assign weights
to different categories of errors in accordance to the
requirements of their applications. Critical errors
should be given higher ranks, as it is important to go
through higher rank errors and improve the code by
quality metric.
3 QUALITY METRICS
Quality is an important aspect of the software devel-
opment process. Especially for software maintenance
and management, where the availability of a qual-
ity metric could provide an important measurement
to support high-level decision making. In the early
stages of SDLC, quality metrics have been rarely
used. Software quality metrics can help to measure
the deviation of actual functionality (quality), time
frame and budget planning for a prospective system
development process. These metrics have been used
for comparison between predicted and actual outcome
of a systems quality (Daniel, 2004).
Software process quality metrics are classified as
error density and severity. Different types of metrics
CQE-AnApproachtoAutomaticallyEstimatetheCodeQualityusinganObjectiveMetricFromanEmpiricalStudy
199
are used to evaluate error density. Weight assignment
on the basis of error severity helps to classify errors.
A weighted metric could provide accurate evaluation
of the error situation. It is obtained by multiplying
the number of errors found in each severity class with
the appropriate relative severity weight and then sum-
ming up all error weights. The Weighted Code Error
Density (WCED) metric works as a better indicator
of adverse error situations than a simple Code Error
Density (CED) metric (Daniel, 2004).
In this paper, we are using an error density metric.
CED is defined as:
CED = NCE/KLOC (1)
where NCE = number of code errors, KLOC =
thousands of lines of code
WCED =
∑
WCE/KLOC (2)
Equation (2) is a standard way to calculate
WCED, calculated by the sum of weights given to
code errors divided by KLOC, but it does not say how
to give weights to errors, according to specific needs.
To provide a flexible method of calculating WCED,
we propose the use of a non-linear function.
WCE
i
is a weight of code error given to particular
rank and is calculated as:
WCE
i
= NCE
i
∗W
i
α
(3)
where NCE
i
is the number of code errors of spe-
cific rank, W
i
=(1,2,3,4,5) is the weight given to rank
(R1-R5) assigned on the basis of severity of error,
where R5 is the highest rank. α = exponent value,
to show the importance of severe error.
This ranking system (1-5) has been used to ex-
tensively as a Mean Opinion Score to evaluate user
perceived quality in both Voice and Video (Muntean
et al., 2007).
From these metrics, the Code Quality Estimation
(CQE) of a JAR can be calculated as:
CQE =
5
∑
i=1
WCE
i
/KLOC (4)
Similarly FB quality (FBQ) is calculated by sum-
ming up weights of high and medium priority bugs di-
vided by KLOC. W
i
=(3,5) where (WCE
M
i=3, WCE
H
i=5)
FBQ =
∑
i=3,5
WCE
i
/KLOC (5)
Finally, in Equation (4) the CQE of a JAR is cal-
culated by summing all error weights divided by its
KLOC. For example, if one JAR has an error of R5
and another JAR has 5 errors of R1, NCE for both
JARs comes out to be 5. This undermines the im-
portance of critical error in the first JAR. However,
the use of non-linear emphasizes the importance of
error. Our metric will work for any exponent value
>1. Equation (2) shows that if WCED is high, the
quality of the JAR is not acceptable.
4 MODEL OF CQE
This paper presents an approach to enhance the error
ranking of FB by a once-off survey and provides a
mechanism to automatically estimate the code quality
using CQE.
As part of our training process, a reasonable num-
ber of JARs has been used to cover various application
domains in addition to the survey template. In our ex-
periments, we have used open source JARs obtained
from a repository
2
for the training process. This ap-
proach requires a number of experienced developers
to participate in our survey. The aim of our process
is to make sure that reports generated based on such a
training dataset will contain objective results for a list
of ranked errors. This list has used as the knowledge
base for further statistical calculations. Once the sur-
vey work has completed, the CQE model can be used
to automatically estimate the code quality.
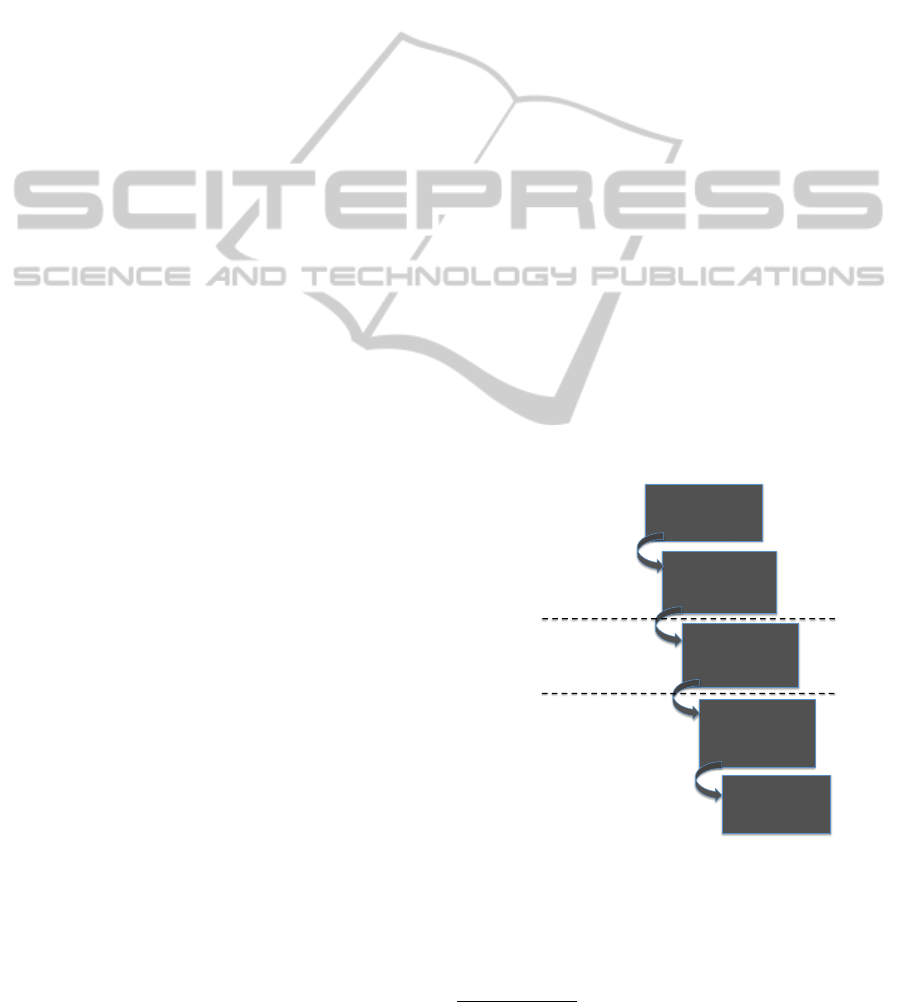
Our quality assessment model for better code
quality is shown in Figure.1. A detailed description
has also been given in subsequent sub-sections.
!"#$%&'()'*+,-.%'
/01*''
23)45"6*'#%-(#7'(8'
9%*7'/01*''
:);+)<%4'%##(#'
#+)=3)6'(8'7%*7'/01*'
>(4%'?"+.37&'
@+7+A+*%'(8'#+)=%4'
%##(#*'
B%)%#+7%*'
0--.3%*''
C#(4"<%'
:*D,+7%*'
E)<%'(F'<+-7"#%'
:G-%#7'=)(H.%46%''
0"7(,+D<'0--.&3)6'
:G-%#7'=)(H.%46%''
Figure 1: CQE Model.
4.1 Survey
Reports generated by FB are stored in excel sheet and
are given to developers.
2
http://search.maven.org/browse—47
ICSOFT2013-8thInternationalJointConferenceonSoftwareTechnologies
200
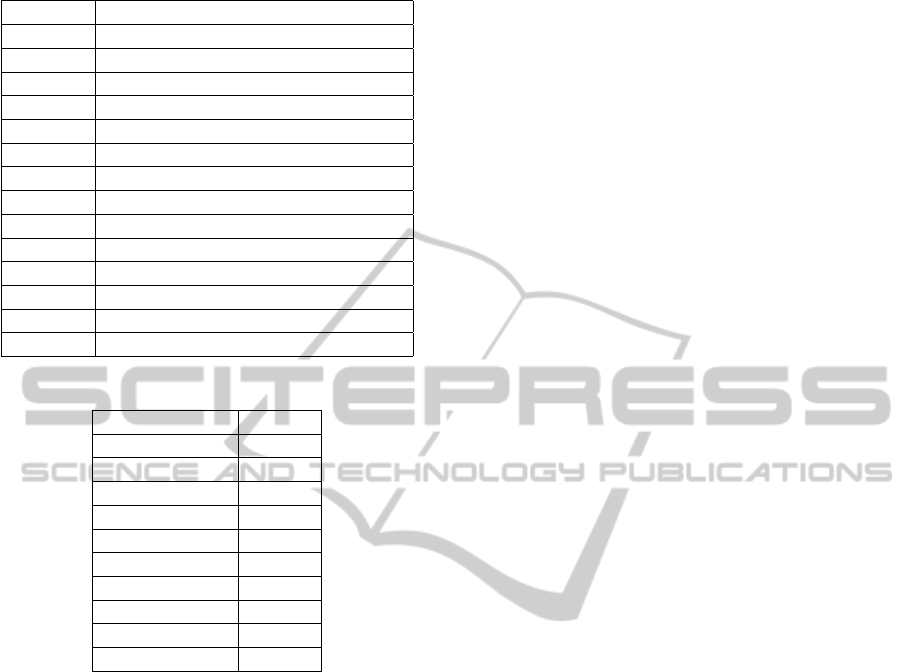
Table 1: High rank errors.
Error Error description
H C RV new IllegalException not thrown
H C BIT Bitwise add of signed byte value
H C FS illegal format string
M V MS Y should be package protected In Y
H C HE Y doesn’t define a hashCode method
H C NP Null passed for nonnull parameter
H C SA Self assignment of field Y in Y
H C EC Using pointer equality to compare
H C IL There is an apparent infinite loop
H M Ru Y explicitly invokes run on a thread
H M VO Increment of volatile field Y in Y
H B ES Comparison of String parameter
M B NP Y may return null
H D ST Write to static field Y from instance
Table 2: Test JARs.
JAR LOC
Asm-4.0 13672
Aspectj-1.6.5 122321
Axis-10.3 133708
BCastle-1.4.6 161021
Cglib-2.2.2 19412
Derby-10.8.1.2 642704
JBoss-5.1 162431
Jline-2.7 8998
Jnpserver-5.0.5 7412
Tomcat-7.0.8 147179
Survey was conducted on 80 open source projects
by giving ranks to the FB reports on excel sheet. Eight
experienced developers gave ranks to reports from 1-
5 based on their severity. All of them had experience
of using FB. These ranks are described as follows:
• R5 is a rank given to “must fix” error.
• R4 is assigned to “should fix” errors.
• R3 is given to “have a look” error.
• R2 is assigned to “harmless” errors.
• R1 is given to “unreal bugs” or false error mes-
sages.
Analysis of error ranking gives a generalized view
of critical errors of JARs. Table 1 shows a list of im-
portant categories of errors that are classified as R5.
Table 1 shows the correctness category of errors
with some of its patterns are highly ranked like “H C
RV” , where “H” is the high priority, “C” is the cor-
rectness category, “RV” is random value pattern and
description of the error. Next important category af-
ter correctness is multithreaded correctness and a few
patterns of bad practice. The survey shows that some
medium priority errors like “M V MS” with their cat-
egories like experimental and malicious code vulner-
ability and their specific patterns have been classified
as severity rank 5 by sample of developers.
This is because different categories of errors are
important for different applications. A bug that is im-
portant to web frontend developer may not be impor-
tant to backend developer. In survey more importance
is given to the category and pattern of error message
rather than the priority of error.
4.2 Database
After receiving feedback, we have created a simple
database of errors based on five ranks by combining
all error reports in an excel spread sheet. The rank
assigned to each error is calculated by taking average
of similar reports. From the survey, the unique error
patterns are obtained in the database. The database
cover almost 40% of all possible FB error categories
and their patterns.
On average, 80% of errors in test JARs are covered
by database. Errors that are not covered by database
are ranked by giving FB rank. We have given rank 3
for medium priority and rank 5 for high priority er-
rors. The database created from our survey is a once-
off process to capture domain expert knowledge of
developers. To apply our CQE approach to differ-
ent organizations or development environments sur-
vey should always be carried out.
4.3 Enhanced Error Ranking
The purpose of our research work is to enhance the
performance of FB tool by focusing on two aspects
to classify the most and least severe errors based on
user’s designation and automatically assign new error
ranks to FB reports by error matching with the survey
database. Usability scenario of our approach is that a
jar is used as an input file, and it will automatically
rank FB report (of jar) by matching the errors with
the database. After ranking it also calculate the CQE
metric. User interface to access the quality of a jar is
from command line.
4.4 Code Quality
Depending on the rank designation of errors, the CQE
metric is calculated using Equation 4. The weight
of an error is calculated by using Equation (3). If a
project has less severe errors then overall weight of
code errors will also be less and the code quality is
acceptable and vice-versa. In (Binkley, 2007), there
are different applications of source code analysis. In
CQE-AnApproachtoAutomaticallyEstimatetheCodeQualityusinganObjectiveMetricFromanEmpiricalStudy
201

our work, two of them (Schulmeyer and McManus,
1999) (Yang and Ward, 2003) have been used for the
purpose of software quality assessment and program
evaluation respectively.
From the outcome of CQE approach, developers
can easily find to:
• Rank errors of their code.
• Decide higher priority errors to fix first.
• Extract information about priorities, categories
and patterns of bugs along with the frequency of
each rank of errors.
5 EXPERIMENTS AND RESULTS
In our work, 80 recent JARs have been randomly se-
lected from maven repository. After having survey
on those jars from experienced developers and creat-
ing database of ranked errors, we compare JAR report
with the database to give ranks. Ranks are assigned
automatically to the JAR errors by comparing it with
rules/classification of ranks in database. Program-
mers can check severe errors with high ranks (R5, R4)
and less important with low ranks (R3, R2). Test JARs
and LOC are as shown in Table 2.
5.1 Error Enhancing
When test JARs are processed by FB, reports only
give high and medium priority of errors. They do not
provide much information. While checking the qual-
ity of code by FB, the tester has to go through all error
messages to see the critical errors of the application,
which is time consuming.
Figure 2 shows detailed classification of errors (H
and M) of all ranks (R1-R5) for each JAR report. As
shown in Figure 2, there are high number of medium
errors in our ranking and only a small number of high
rank error. For example in Axis JAR has 15 R2M and
1 R2H, similarly 63 R3M and only 3 R3H, where as
R5H are 15 and 7 errors of R5M. Similarly for most
of jars number of RM (medium rank) is higher than
RH (high rank). Hence CQE shows a clear and more
detailed picture of error ranking. It will be quite con-
venient for programmers to fix only high ranked er-
rors and improve their code quality quickly.
From the survey, 152 unique error patterns are ob-
tained in the database, which covers around 40% of
FB error categories and patterns. The number of er-
rors belong to R5 are 24, R4 are 52, R3 are 46, R2 are
23 and R1 are 9. Important features of the CQE are as
follows:
• It can automatically rank the errors according to
the knowledge base.
• It highlights critical errors to be fixed at first pri-
ority.
• It saves time for developers to only go through
high rank errors.
5.2 CQE Calculation
The code quality of JAR is estimated by CQE metric.
Results are shown in Table 3.
Table 3 shows the contributions of different
weights (W1-W5) of errors. For FB, high priority
weight is denoted by WH and medium priority weight
is WM. To compare the W
i
for FB and CQE metric,
we took a worst case scenario and mapped FB’s high
priority to a rank of 5 and 3 for medium. Weights are
calculated from Equation (3) assigned on the basis of
error ranking and exponent value of 1.5, this value is
empirically investigated and is optimal for our jars. To
find a suitable value for the exponent, we have seen in
our survey that sometimes developers overestimate or
underestimate the importance of a bug. We observed
some positive and some negative differences between
the values calculated for FBQ and CQE for different
exponent values. From empirical investigation expo-
nent value of 1.5 is used as final as it shows optimized
results comparable with FB. Our experiments shows
that an error of R5 is 11 times more severe than R1,
which seems reasonable.
Table 3 shows that R3 and R4 errors contribute
most to the overall quality depredation. This is to be
expected as there are many more errors ranked R3 and
R4 as compare to R5 as shown in Figure 2. The CQE
and FBQ is calculated from Eq. 4 using their weights.
Results in the Table 3 shows Derby is the best
quality JAR with a small number of errors, and high
KLOC. JBoss is a next good quality JAR with large
KLOC. Jline and Jnpserver have high CQE, as they
have less LOC, hence have a higher error density. WH
of Aspectj is 88 where as W5 is 22.36 which shows
that the CQE approach highlights a smaller number of
critical bugs. Similarly WH of BC is 254.31 where as
W5 is only 122.98. So in this case we should only
give importance to W5 as compare to WH. There-
fore from Table 3 CQE based method gives better and
clear picture of error ranking instead of just having
only two priorities of errors. In Table 3 the overall
quality is presented using an approach (CQE) and the
FB report categorization (FBQ).
In Figure 3, JAR with higher CQE value, have
lower quality code. A project manager can define a
threshold for good quality code in terms of having no
ICSOFT2013-8thInternationalJointConferenceonSoftwareTechnologies
202
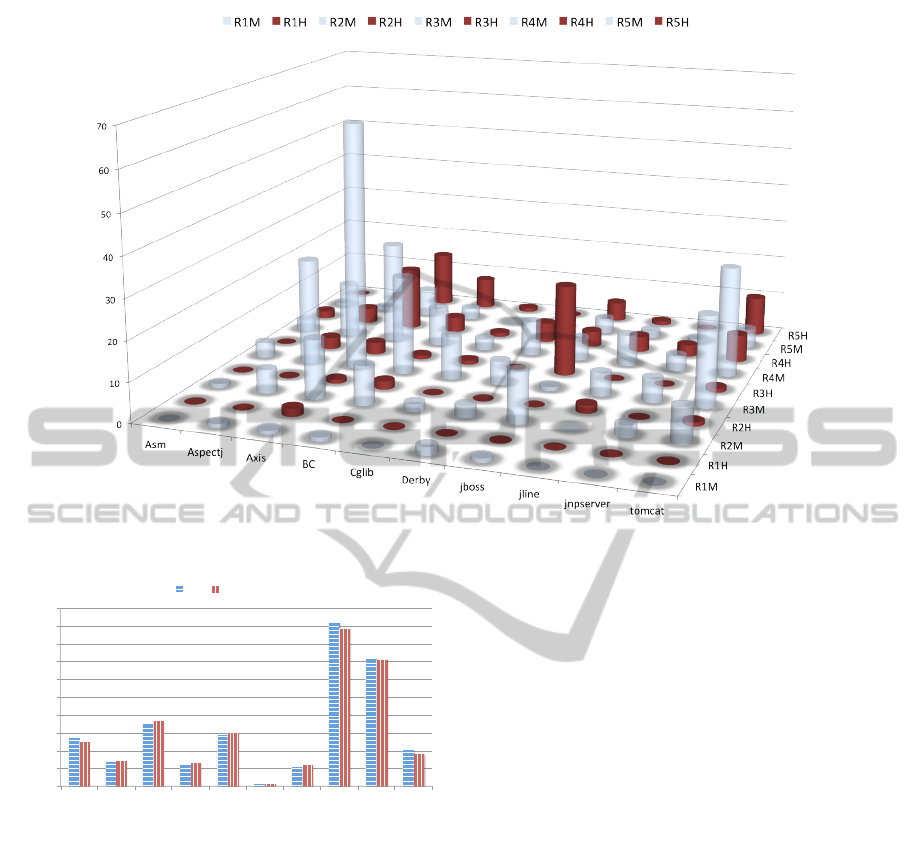
Figure 2: Survey ranking with H and M.
0.00#
2.00#
4.00#
6.00#
8.00#
10.00#
12.00#
14.00#
16.00#
18.00#
20.00#
Asm#
Aspectj#
Axis#
BC#
Cglib#
Derby#
jboss#
jline#
jnpserver#
tomcat#
CQE$
Test$JARs$
CQE# FB#Quality##
Figure 3: CQE and FBQ.
severe error for a particular project. If the code qual-
ity is above the threshold, it will be marked as a bad
quality JAR.
5.3 Discussion
Our approach could be used on any static analysis
tools like PMD and jlint output, by making the output
more precise and easy to understand to save time for
developers and managers for improved code quality.
FBQ metric could also be used to access the qual-
ity of code but there are some limitations: firstly, the
categorization is based on the opinions of the devel-
opers surveyed by the people who developed FB this
means they are in some way general and you have no
mechanism to tailor the FBQ metric to the require-
ments of your own companys opinions Secondly, the
CQE technique also gives a ranked list of the bugs
with a higher granularity than the raw FB list. This
allows the development team to priorities the bug fix-
ing process.
Our methadology could also be used for checking:
• Team quality: Within a team of developers, we
should see a higher correlation between the team
members in ranking of errors. This could be used
to appraise the output of individual developers or
different groups. For example when developer A
works with B they tend to produce high quality
code. When A works with C, they tend to produce
poor quality code. So when a manager is organiz-
ing a team, he/she will know what combinations
work best.
• Education: An individual can rank the bugs. It can
also be used to monitor the code that they write
through out their studies, the quality will improve
over time. It also allows them to compare other
people code to what they personally consider to
be good code.
5.4 Threats to Validity
Survey is a knowledge base; it is subjective and is
mandatory. Survey is specific to a company and a
project. If we dont have a good number of surveys and
CQE-AnApproachtoAutomaticallyEstimatetheCodeQualityusinganObjectiveMetricFromanEmpiricalStudy
203
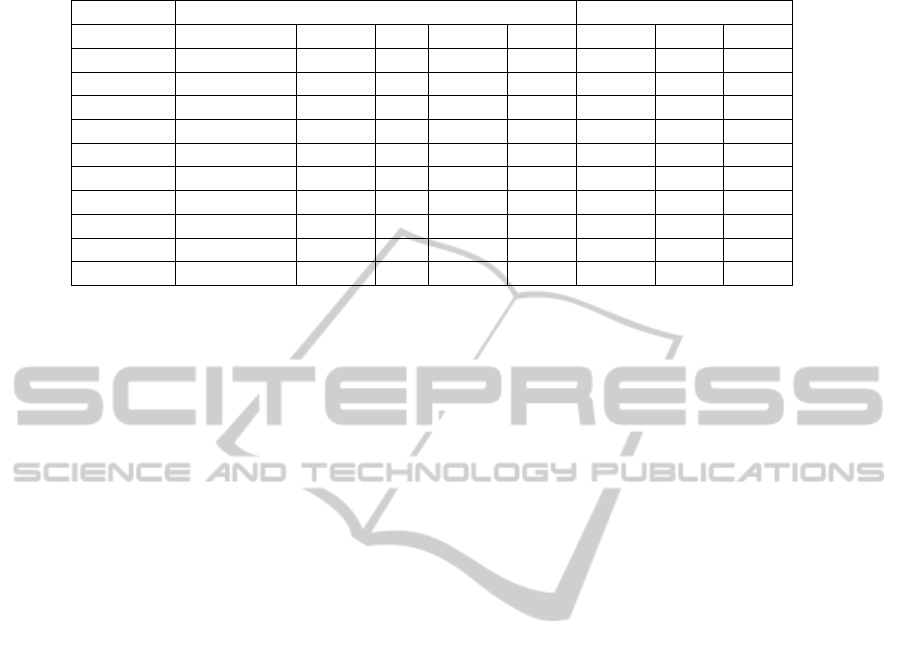
Table 3: Enhanced error ranking with CQE and FBQ.
CQE FB
Test JARs W1 W2 W3 W4 W5 CQE WM WH FBQ
Asm 0 2.83 20.78 40 11.18 5.47 46.77 22.36 5.06
Aspectj 1 16.97 155.88 144 22.36 2.78 254.31 88 2.80
Axis 3 45.25 342.95 336 234.79 7.19 576.09 407 7.35
BC 1 33.94 135.10 112 122.98 2.51 254.31 165 2.60
Cglib 0 5.66 62.35 32 11.18 5.73 83.04 33 5.98
Derby 2 8.49 31.18 104 33.54 0.28 114.18 55 0.26
Jboss 1 36.77 124.71 80 100.62 2.11 243.93 110 2.40
Jline 0 5.66 31.18 96 33.54 18.49 83.04 77 17.79
Jnpserver 0 8.49 31.18 56 11.18 14.41 72.66 33 14.26
Tomcat 0 28.28 124.71 280 167.71 4.08 337.35 209 3.71
experienced developers its a threat to validity. As the
the given ranking is important for calculating CQE, if
ranking is not given carefully there will be problem
to estimate the code quality. Our ranking may not be
generalize for other projects as all projects have dif-
ferent functionalities/requirements.
6 RELATED WORK
In this section we discuss some related work in the
area of improving code quality by enhancing error
ranking of static analysis tools.
Error ranking of only correctness category was
improved by (Shen et al., 2011). Shen et al. ranked
error reports by user designation and then gave rank-
ing on defect likelihood of bugs patterns to be an error
or FP. The comparison of results illustrated that Effec-
tive FB is an effective tool for error ranking in large
Java applications. But limited patterns of errors were
discovered in their approach.
Ayewah et al. (Ayewah et al., 2008) and (Ayewah
et al., 2007) evaluated bug warnings on production
software like Google, IBM web sphere, JBoss and Or-
acle containers for java. They analyzed error reports
of FB, and classified each issue as impossible, trivial
or a defect. Google deployed FB as a part of their
project. They addressed and improved real defects in
code by analyzing static errors, but only checked the
correctness warnings.
In (Ayewah and Pugh, 2009) did a user study to
check the list of important errors. They checked their
user study with expert participants, and found strong
responses for real bugs and weak responses for fake
warnings. Different user studies were conducted to
review the static analysis warnings of FB but different
users have a different understanding for looking at the
bug reports. They got more responses reported for
Null pointer checking than Redundant checking for
null.
(Kim and Ernst, 2007) used the History Warning
Prioritization algorithm for checking the severe bugs
as important ones. They classified important bugs as
those, that are fixed in their next release by mining
the change history of project are considered to be real
errors. They applied their warning ranking method on
FB, jlint and PMD. But their algorithm will not work
if new project is tested. A new version of software
will have new features and new errors will be detected
that are not present in their real errors list.
Coding standards also play an important role in
maintaining good quality of code (Fang, 2001). But
for that purpose programmers should be an expert to
maintain coding standards. Furthermore it is difficult
to maintain the coding standards because of the dead-
lines of projects.
Software quality factors were mapped by static
analysis tools like FB, PMD and Metrics. The most
covered quality factor from these tools was reliabil-
ity. Chirila et al. (Chirila et al., ) assessed the qual-
ity model based on the mapping of quality factors of
project with the tools coverage. But static analyzers
have a high number of false positives, so it is difficult
to assign the actual quality of a project.
Static analysis tools were used as early indicators
of pre release defect density. In (Nagappan and Ball,
2005) Nagappan used PREfix and PREfast tools for
checking the pre-release defect density of Windows
Server 2003. They found the defect density correlated
with other pre-release defects extracted from testing,
integration, build results etc. Again sorting out of im-
portant errors of static tools is manual and time con-
suming. So static analysis is helpful in identifying
fault and not fault prone components of system.
These studies have used different methods to iden-
tify errors by static tools. Our approach is different
and novel as we identify important errors of a system
in an efficient and automatic way to assess code qual-
ity by the CQE approach.
ICSOFT2013-8thInternationalJointConferenceonSoftwareTechnologies
204

7 CONCLUSIONS AND FUTURE
WORK
In this paper, we presented our approach – CQE to
support efficient code quality estimation by enhanc-
ing the current FB tool. The CQE is a three-step ap-
proach that make use of FB, surveying developers,
and calculating quality metrics. During the experi-
ment, we have used 80 JARs to train our knowledge
base after assessing FB reports with 8 experienced de-
velopers. The survey template contains 3 more sever-
ity categories than what FB provides (2 priorities: M,
H) in the bug report. By evaluating 10 testing JARs,
we have seen that these extra severity categories can
cause the code quality metric to slightly vary com-
paring to FB. CQE approach provides an automatic
and efficient way to estimate and improve code qual-
ity with the help of statistics (classification) of errors
provided by our approach. Furthermore by maintain-
ing a knowledge base obtained from initial surveys,
the subsequent code quality estimation processes can
be fully automated. This automatic process will sup-
port project managers with efficient decision making.
In future we will use other quality metrics like
Weighted Code Errors per Function point (WCEF) to
identify quality factors other than weighted error den-
sity. We also like to focus on specific application (like
web based or database) based severe errors. We also
like to integrate our approach into FB to give clear
picture of severity of error and code quality estimated
by CQE metric.
In summary, our approach is useful for checking
the quality at different levels like:
• Global Quality: Expert knowledge could be taken
from a wide range of developers. This would cre-
ate a huge sample size, as large variation in opin-
ions would be expected.
• Corporate Quality: Use experts across company
and use that knowledge to estimate the code qual-
ity according to corporate norms. This could be
useful to assess in house teams or the quality of
software that comes from outsourced third par-
ties. Third parties could use this tool to assess the
client’s code quality.
ACKNOWLEDGEMENTS
This work was supported, in part, by Science
Foundation Ireland grant 10/CE/I1855 to Lero -
the Irish Software Engineering Research Centre
(www.lero.ie).
REFERENCES
Ayewah, N., Hovemeyer, D., Morgenthaler, J., Penix, J.,
and Pugh, W. (2008). Using static analysis to find
bugs. Software, IEEE, 25(5):22 –29.
Ayewah, N. and Pugh, W. (2009). Using checklists to re-
view static analysis warnings. DEFECTS ’09, pages
11–15, New York, NY, USA. ACM.
Ayewah, N., Pugh, W., Morgenthaler, J. D., Penix, J., and
Zhou, Y. (2007). Evaluating static analysis defect
warnings on production software. PASTE ’07, pages
1–8, New York, NY, USA. ACM.
Binkley, D. (2007). Source code analysis: A road map.
In Future of Software Engineering, 2007. FOSE ’07,
pages 104 –119.
Boehm, B. W., Brown, J. R., and Lipow, M. (1976). Quanti-
tative evaluation of software quality. ICSE ’76, pages
592–605, Los Alamitos, CA, USA. IEEE Computer
Society Press.
Chirila, C., Juratoni, D., Tudor, D., and Cretu, V. Towards
a software quality assessment model based on open-
source statical code analyzers. (SACI), 2011, pages
341 –346.
Daniel, G. (2004). Software quality assurance: From theory
to implementation. chapter 21. Pearson Education.
Fang, X. (2001). Using a coding standard to improve pro-
gram quality. In Quality Software, 2001. Proceed-
ings.Second Asia-Pacific Conference on, pages 73 –
78.
Kim, S. and Ernst, M. D. (2007). Which warnings should
i fix first? ESEC-FSE ’07, pages 45–54, New York,
NY, USA. ACM.
Muntean, G.-M., Perry, P., and Murphy, L. (2007). A
comparison-based study of quality-oriented video
on demand. Broadcasting, IEEE Transactions on,
53(1):92 –102.
Nagappan, N. and Ball, T. (ICSE,2005). Static analysis
tools as early indicators of pre-release defect density.
pages 580 – 586.
Rutar, N., Almazan, C., and Foster, J. (2004). A comparison
of bug finding tools for java. pages 245 – 256.
Schulmeyer, G. and McManus, J. (1999). Handbook of soft-
ware quality assurance. Prentice Hall.
Shen, H., Fang, J., and Zhao, J. (ICST,2011). Efindbugs:
Effective error ranking for findbugs. pages 299 –308.
Yang, H. and Ward, M. (2003). Successful Evolution Of
Software Systems. Artech House Computer Library.
Artech House.
CQE-AnApproachtoAutomaticallyEstimatetheCodeQualityusinganObjectiveMetricFromanEmpiricalStudy
205
