
Model-based Inspection for the Control of Quality in Advanced
Manufacturing Environments
Shaniel Davrajh and Glen Bright
University of KwaZulu-Natal, Durban, South Africa
Keywords: Quality Control, Model-based Inspection.
Abstract: Manufacturing processes for markets that involve high levels of customization are inherently exposed to
unpredictable and often inconsistent demands. The use of statistical methods for controlling quality in these
environments is not suitable. The implementation of 100% inspection would guarantee high levels of quality
but involves high inspection costs, whereas 0% inspection is associated with high throughputs without being
able to guarantee the outgoing quality of products. This research used the Expected Value Formula to
provide a model that determined whether an inspection station should be activated or not. The model-
decision depended on specified parameters such as the internal, external and appraisal costs as well as the
significance of the inspected feature. The overall profits and Cost of Quality metric were used to analyse the
system performance and compare the model-based inspection criteria to the 100% and 0% inspection
strategies, using simulations performed in Labview. The model-based inspection showed an overall increase
in profits gained for both low and high customer significance ratings with a minimisation of the Cost of
Quality, and was therefore considered to be more suitable to manufacturing environments which
experienced frequent reconfigurations due to changes in customer requirements.
1 INTRODUCTION
Product markets are becoming highly unpredictable,
specialised and more difficult for manufacturers to
satisfy (Nambiar, 2009). The unpredictable nature of
changes in customer requirements necessitates a
response in product and process design that is able to
encapsulate these changes. At the forefront of the
competitive advantages that a manufacturer must
strive to achieve, is the ability to satisfy a customer
(Pollard et al., 2008). Manufacturers must then focus
on issues pertaining to quality. According to
Goetsch and Davis (2010), quality should not be
considered as a fixed metric, but instead should
timeously change according to customer
requirements. Advanced manufacturing
environments which implement high levels of
customer design must consider the effect of quality
repercussions on overall profit in a highly
competitive market. Current systems are unable to
match the future quality demands that will be placed
on manufacturers.
The manufacturing strategies of Reconfigurable
Manufacturing Systems (Koren et al., 1999) and
Mass Customisation (Da Silviera et al., 2001)
converge onto the common goal of providing high
levels of customisation through production of a
variety of parts within a defined family. These parts
are intended to be configured within boundaries
specified by the manufacturer and use
reconfigurable equipment to accommodate changes
in customer requirements. Research into the
implementation of reconfigurable inspection
equipment is still on-going and rare mention of the
implementation of this inspection equipment has
been made. The strategy of performing 100%
inspection using processes with high reliabilities is
certain to ensure that high levels of quality are
delivered to the customer. The disadvantage of this
inspection strategy is that it negatively impacts on
the profits associated with the manufacture of a
product by increasing manufacturing times and
costs. 0% inspection leads to the admittance of
defective products throughout the line and will lead
to an increase in unsatisfied customers as well as
loss in profits due to compensatory costs.
The research presented in this paper addresses a
solution to the implementation of reconfigurable
inspection equipment, and forms part of a holistic
solution to the management of quality within an
550
Davrajh S. and Bright G..
Model-based Inspection for the Control of Quality in Advanced Manufacturing Environments.
DOI: 10.5220/0004482705500557
In Proceedings of the 10th International Conference on Informatics in Control, Automation and Robotics (ICINCO-2013), pages 550-557
ISBN: 978-989-8565-71-6
Copyright
c
2013 SCITEPRESS (Science and Technology Publications, Lda.)

Advanced Manufacturing Environment. The
consideration of a product as a set of features
allowed for a user to specify the features that were
of most interest to them. The layout of the inspection
equipment was based on the classification of
significant features. A model that incorporated the
customer-rated significant features as well as
process non-conformance rates was then developed
using the Expected Value Formula (statlect, 2013).
This model was used to determine when to perform
inspection at a given inspection station. The
sanctioning of customers to choose the features of a
product that were personally significant allowed for
the maintaining of the dynamism in the quality
delivered to the customer. Labview
(www.ni.com/labview) was used to simulate the
model and quantify and compare the overall profits
and Cost of Quality (CoQ) metric (ASQ, 2013) of
the model-based inspection, 100% inspection and
0% inspection strategies. The results indicated that
the model-based inspection strategy was better
suited to environments in which the significance of
product features varied than the other two inspection
strategies.
2 QUALITY COSTS
It is imperative to maintain high levels of product
quality within a manufacturing environment;
however the process of quality control does not
necessarily change a product and hence does not
directly increase the value of the profit gained.
Quality management is considered to have the dual
objectives of maximizing the quality of conformance
and minimizing the associated costs. The CoQ
approach renders a single metric in reconciling these
two conflicting objectives and therefore allows for a
single metric to be optimized whilst accommodating
a wide range of individual customer needs.
According to Zaklouta (2011), no single definition
of CoQ and its constituent elements exists. Juran
(1951) considered CoQ as all the costs that would
disappear if every process in the lifecycle of a
product had a non-conformance rate of zero. Crosby
(1979) introduced the division of quality costs into
conformance and non-conformance costs. The
Prevention-Appraisal-Failure (PAF) model was the
most commonly accepted CoQ model since its
adoption, as discussed by Zaklouta (2011).
Prevention costs refer to the costs involved with the
reduction in frequency of non-conforming products.
Such costs include supplier audits, process
adjustment, calibration and maintenance, and can be
held constant in a defined manufacturing
environment according to (Zaklouta, 2011).
Appraisal costs are the costs associated with the
detection of the non-conformance of a product.
Inspection and testing are the two types of appraisal
costs. Failure costs are divided into the costs
associated with internal failures and external failures
respectively. Scrapping and reworking fall under
internal failures whilst complaint adjustment and
product recalls are external failure costs. The basic
Lundvall-Juran curve, shown in Figure 1 was
represented by Foster (1996) and depicted the
Economic Quality Level (EQL). This level is
depicted by the point at which the cost of quality is a
minimum and hence provides a numerical goal that
should be achieved for a given system. The graph
indicates that the Appraisal and prevention costs
(C1) increase, whilst failure costs (C2) decrease, as
quality levels increase. The total quality costs are
determined by the summation of C1 and C2.
Figure 1: Lundvall-Juran curve (Foster, 1996).
The EQL approach was criticised by Crosby (1979)
as it implied the acceptance of defective parts
reaching the customer. This research was based on
satisfying the quality requirements of customers as
well as minimizing the costs associated with
inspection. The possibility of defective products
reaching customers through non-inspection was
considered acceptable, if and only if it was
financially feasible.
3 DEVELOPMENT
OF THE INSPECTION MODEL
A product family, as described in (Tseng and Du,
1998), was considered to be a set of components
wherein each component contributed both
individually and holistically to the functionality of a
product. This research considered a product as a set
of features which were governed by the selection of
Model-basedInspectionfortheControlofQualityinAdvancedManufacturingEnvironments
551
components from the product family. The
configuration of a product entailed the customer
selecting the modules of choice and then specifying
the values of the features associated with the
selected modules within the specified boundaries.
The customer was required to enter the significance
of the selected modules through specification of a
product rating and Significance Factor (SF), which
were used to determine the external costs associated
with failure of the product or component. The
product rating was defined as the rating that
described the consequences of failure of the product
whilst in use and would be determined by the
manufacturer. An assembly line with parallel lines
feeding into the assembly stations was considered
for the manufacturing of a completed product
configuration. The parallel lines represented the
feeding in of outsourced modules or performing in-
house fabrication of the relevant modules. The
locating of inspection stations throughout the
manufacturing lifecycle of a product has been
described in (Davrajh and Bright, 2012).
There were two options following a
manufacturing process namely inspection and non-
inspection from which the following possibilities
arose:
Inspect a good part
Don’t inspect a good part
Inspect a defective part
Don’t inspect a defective part
The selling price (Sell) of the product was assumed
to be determined through market related research.
The external failure cost was determined using
equation (1)
Sell
SF
SF
ratingoductC
ext
**_Pr
(1)
The cost of manufacture (C
m
) was considered as the
sum of all the manufacturing costs associated with
the product. C
i
was defined as the inspection costs
associated. The stochastic nature of manufacturing
systems forced the introduction of probabilities with
respect to the reliability of the manufacturing and
inspection processes. The probability of a
conforming product feature after going through a
process was modelled as the product of the
reliabilities of the current process and the processes
before it. The conformance rate of the inspection
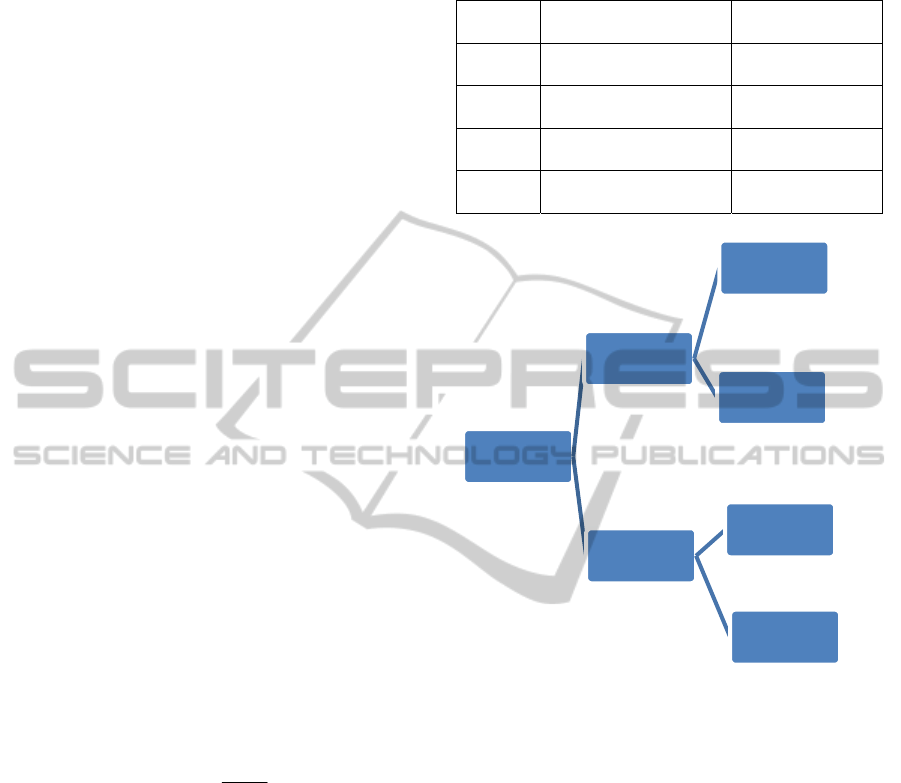
process was also considered in this model. Figure 2
shows the possible paths and profits that a product
may follow after a process. These profits were
quantified with respect to the formulae associated
with each path and are presented in Table 1.
Table 1: Tabulated profits for inspection and non-
inspection of defective and acceptable parts.
Profit
Variable
Description Formulae
PR
IG
Inspection of an
acceptable product
Sell – (Cm+ Ci)
PR
ID
Inspection of a
defective product
– (Cm+ Ci)
PR
DIG
Non-inspection of an
acceptable product
Sell – Cm
PR
DID
Non-inspection of a
defective product
Sell – (Cm+Cext)
Figure 2: Layout of possible Profits following a process
Wherein:
For the path involving inspection, the profit was
considered as a discrete random variable Xi, having
support R
xi
={PR
IG
,PR
ID
}
and a probability mass
function P
xi
(x) as shown below:
otherwise
PRxi
PRxi
p
p
xiXiP
ID
IG
:
:
:
0
1)(
Considering the case of non-inspection, the profit
was modelled as a discrete random variable Xdi
with
support R
xdi
= {PR
DIG
,PR
DID
} and a probability mass
function P
xdi
presented as:
otherwise
PRxdi
PRxdi
p
p
xdiXdiP
DID
DIG
:
:
:
0
1)(
The expected value for each case was represented by
equations (2) and (3) respectively:
Manufactuing
Process
Inspect
Good
Defective
Dontinspect
Defective
Good
PR
IG
PR
ID
PR
DIG
PR
DID
ICINCO2013-10thInternationalConferenceonInformaticsinControl,AutomationandRobotics
552
[] *() * (1 )
xi
I
GID
xi R
E
Xi xi P xi p PR p PR
(2)
[] *() * (1)
xdi
D
IG DID
xdi R
EXdi xdi Pxdi p PR pPR
(3)
The decision to inspect was then executed when the
following condition was satisfied
1
][
][
XdiE
XiE
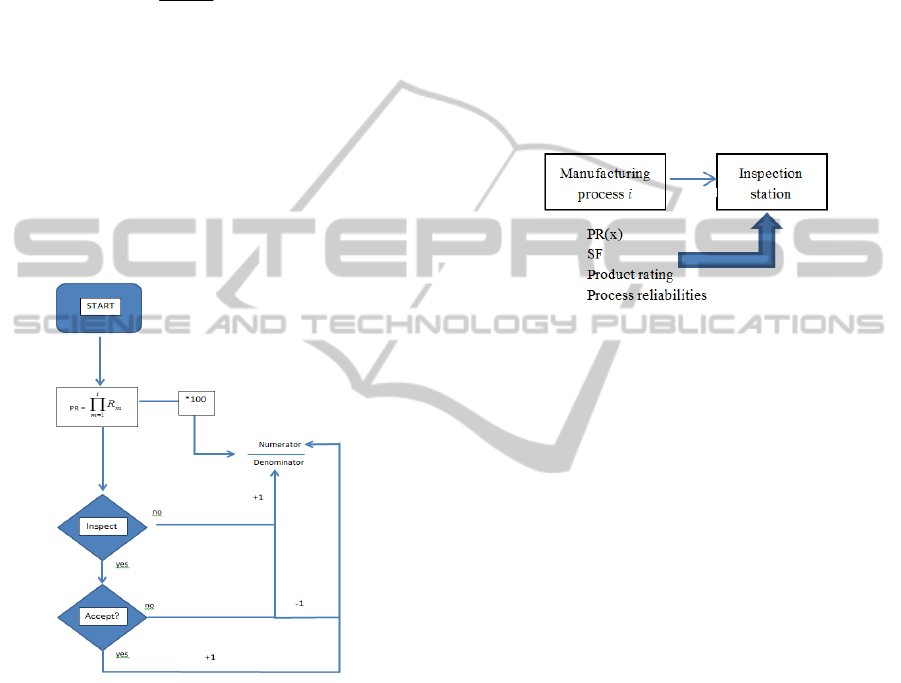
The value of p was determined using the reliabilities
of the manufacturing processes. The initial
reliabilities as specified by the operator were
considered for the first run. Thereafter they were
updated based on the volume of products produced.
Figure 3 illustrates the process flow. For example, if
a reliability was 99% that meant that 99 out of 100
were successful. If one more passed through it and
was successful, it would have a reliability of 100 out
of 101.
Figure 3: Flowchart describing the updating of the
probabilities of the inspection criteria
Assuming that the prevention costs are constant, the
quality costs associated with the three different
appraisal and failure costs were determined as
follows:
COQ
100%
= Appraisal + Internal Failure (4)
COQ
0%
= External failure (5)
COQ
model
= Appraisal + internal failure
+ external failure
(6)
4 SIMULATION RESULTS
AND DISCUSSION
Figure 4 illustrates the manufacturing layout that
was simulated in Labview to compare the model-
based inspection criteria to 100% inspection and 0%
inspection frequencies. This layout depicted any
manufacturing process that was considered
significant in the product manufacturing cycle, as
discussed previously, with the possibility of an
inspection station following the process. The
simulation was based on the inspection of a single
feature passing through the station.
Figure 4: Simulated inspection station layout.
The manufacturing and inspection process
reliabilities were assumed to be constant whilst the
batch sizes, supplier reliability, processing costs,
product rating and SF were varied. The external
failure costs were modelled using equation 2 which
depended on the replacement costs to the customer.
The value of SF divided by the total sum of SFs was
used to determine the relative significance of the
feature in the context of the entire part. For this
simulation, this factor was considered to be 1. The
reason for this was that only a single feature
inspection was performed. This factor would change
when considering more features. Table 2 lists the
categorisation of the product rating and its influence
on the external failure costs. The use of two values
in the same category accounted for the upper and
lower extremes of relevant categories.
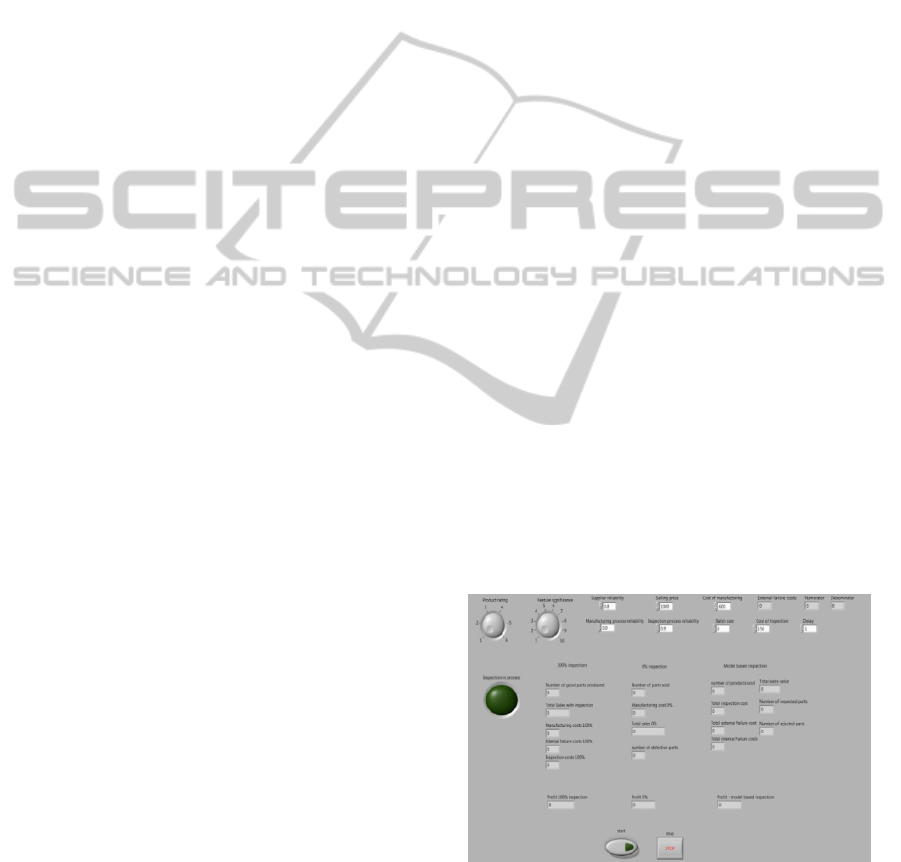
The inspection simulation interface and
numerical results are shown in Figure A1, in the
appendix. Twenty trials were performed; however
the results of only nineteen tests were plotted for
scaling reasons. The supplier rating was varied
between 0.7 and 0.95 to simulate the differences in
the reliability chain that would occur when
producing batches of custom products that would
require changes in process configurations. These
supplier ratings were inputs to the discrete random
generator using the Bernoulli probability function to
generate acceptable or defective parts randomly. The
tabulated results of the simulations are placed in the
Model-basedInspectionfortheControlofQualityinAdvancedManufacturingEnvironments
553
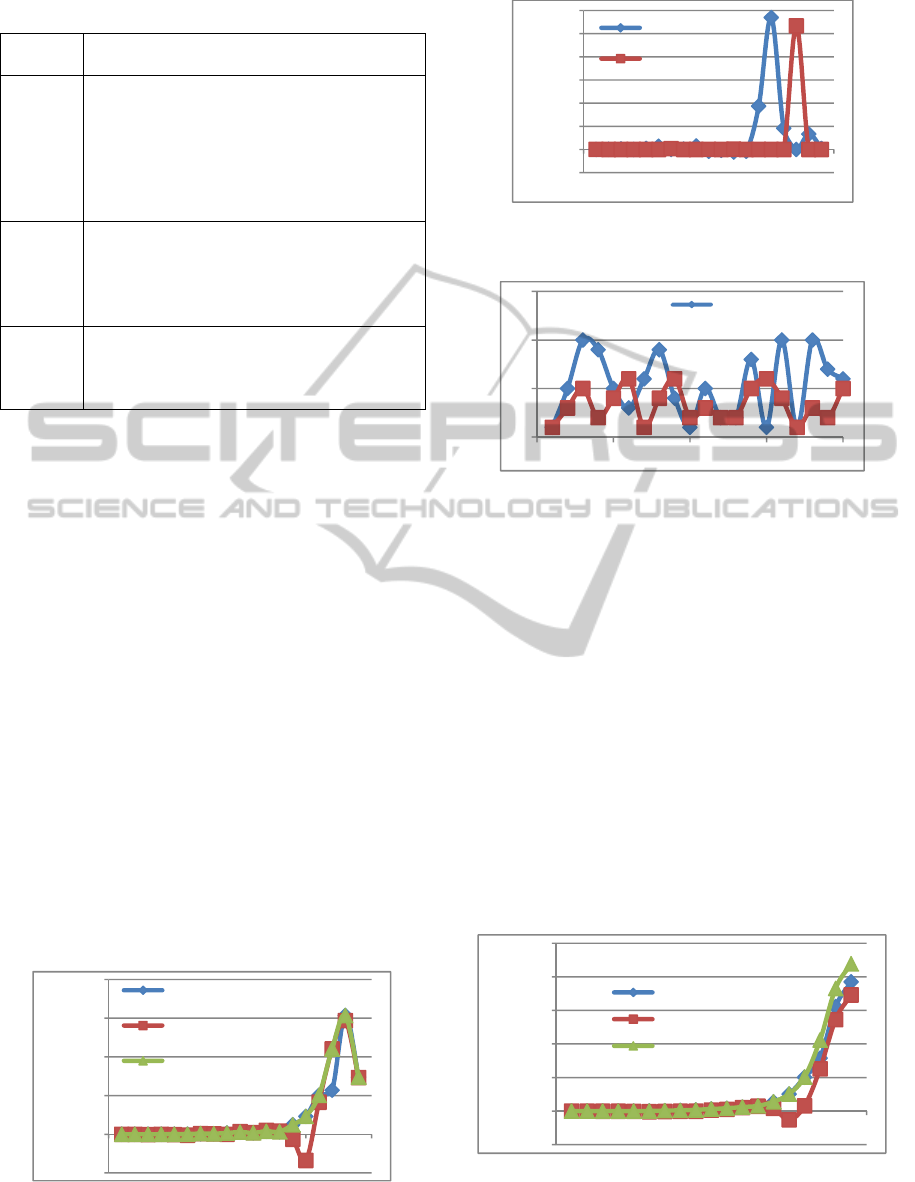
Table 2: Product rating list.
Product
rating
Description
1- 2
Low: These values indicate that the failure
of the product of component produced has
little repercussions and can be
accommodate by the replacement of a
defective component/product. A customised
cellular phone cover would be a typical
product with this rating
3- 4
Moderate: Used when failure of the
component/product is significant but not
critical. The incorrect spelling of a
customers’ name on a product label is an
example of this rating
5-6
Critical: Failure of a product with this type
of rating could lead to serious injury of a
person. A brake pad is an example of such a
product.
Appendix (Table A). Figure 5 (a) illustrates the
overall profits of all three inspection strategies
displayed on the same axes (y-axis being profit and
x-axis being trial number). The results indicated that
the model based inspection behaved similar to the
0% inspection strategy for low product ratings and
significant feature values. The response of the
model-based inspection converged onto the
behaviour of the 100% inspection strategy for higher
product ratings and significant feature values. The
greatest difference between the results of the model
and 0% inspection strategies occurred when the
product was rated moderate or critical (3-6). The
greatest difference between the model and 100%
inspection was seen when the product rating was
low. The SF directly affects the external costs but
due to there being only one feature, this factor did
not influence the overall inspection operation as seen
in Figures 5 (b) and (c). Negative profits were
recorded in some trials. These negative values were
a result of the combination of supplier and process
reliabilities, along with the product rating and
production costs.
Figure 5(a): Plot of the profits for the three inspection
strategies vs the inspection trial number.
Figure 5(b): Differences in profit between the Model-
based inspection and the 0% and 100% strategies.
Figure 5(c): Corresponding product rating and SF values
for the trials.
The cumulative profits for the 19 trials were plotted,
shown in Figure 6(a) to determine the overall
difference in performance of the inspection
strategies. The plot shows that all the inspection
strategies had the potential for profit with the 0%
inspection strategy being the most prone to loss in
profits for products rated moderate or critical. The
model responded like the other two inspection
strategies at their optimum when the conditions
dictated. This allowed for the model based
inspection strategy to have the highest overall profits
consistently. Figure 6(b) shows that the overall
profits obtained by the model-based inspection were
approximately 14% higher than the 100% inspection
strategy and 27% higher than the 0% inspection
strategy.
Figure 6(a): Plot of the cumulative profits of each type of
inspection strategy.
-10000000
0
10000000
20000000
30000000
40000000
0 5 10 15 20
100%
0%
Model
-2000000
0
2000000
4000000
6000000
8000000
10000000
12000000
0 5 10 15 20
M0%
M100%
0
5
10
15
0 5 10 15 20
Significance
Factor
-20000000
0
20000000
40000000
60000000
80000000
100000000
0 5 10 15 20
100%
0%
Model
ICINCO2013-10thInternationalConferenceonInformaticsinControl,AutomationandRobotics
554
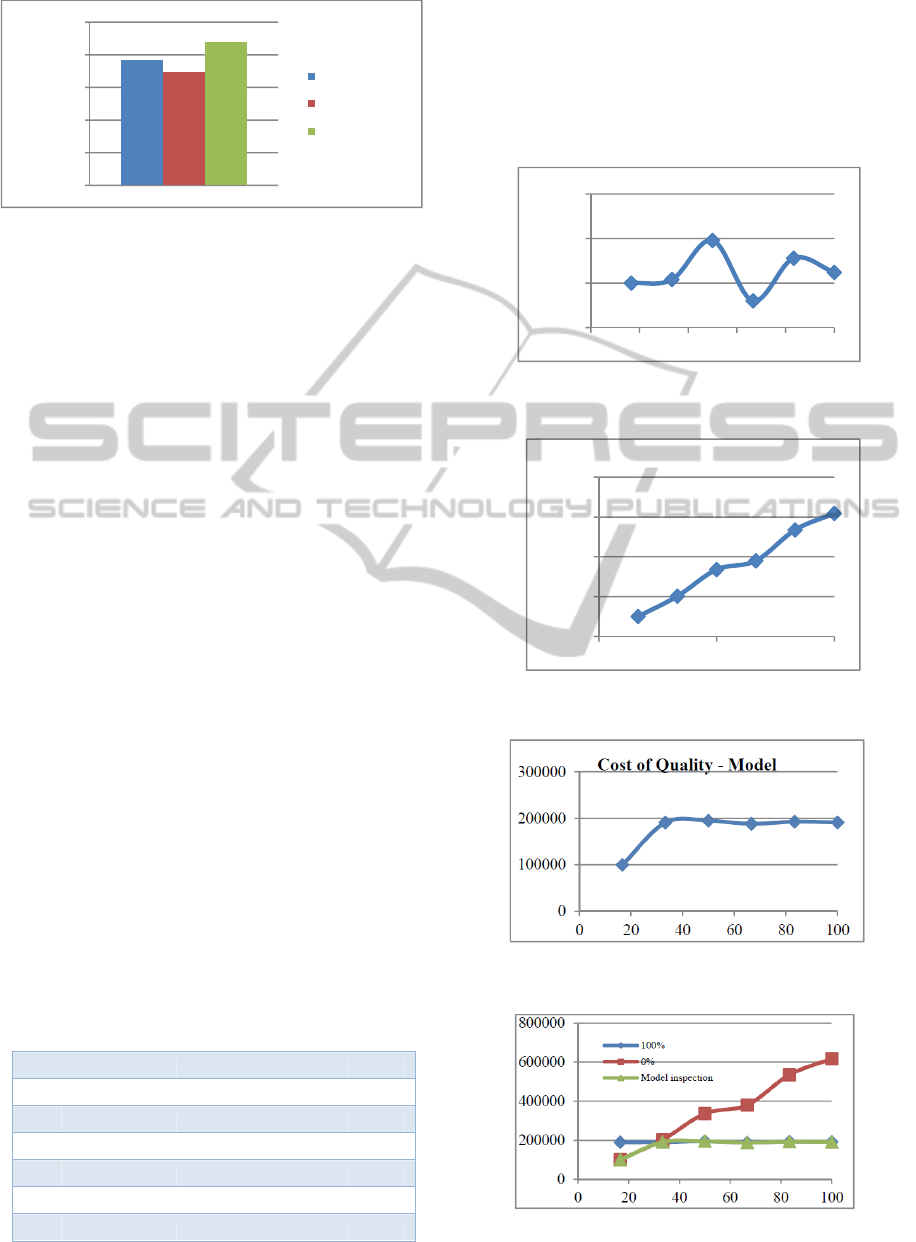
Figure 6(b): Comparison of the total profits for the trials.
The COQ results for each type of inspection were
plotted using the results from Table 2. Six
simulations were performed with the only variable
being the product rating. The relative product rating
was divided by the maximum product rating (to
quantify conformance quality) and was then plotted
against the quality costs associated with each type of
inspection (preventative costs being kept constant
for each inspection type). Figure 7(a) shows a
fluctuation in the cost of quality for the 100%
inspection strategy. The appraisal costs for this
strategy were constant for the simulation, hence the
only factor influencing the plot were the internal
failure costs. These internal failures were based on
the random values generated during the simulation
and the graph shows a relatively low difference
between the maximum and minimum costs as
expected. Figure 7(b) indicates an increasing cost
due to the external failure costs increasing in
accordance with the product rating and equation. A
larger product rating significantly increases the
external failure costs and hence quality costs
associated with this inspection strategy. Figure 7(c)
show the results of the COQ associated with the
model-based simulation. The model was seen to
have a minimum COQ when the product rating was
low and a stabilisation onto a single cost as the
product rating increased. The increase in product
rating would have increased the external failure
costs and forced an increase in inspection frequency.
The only factor influencing this COQ at moderate
and critical product ratings were the internal failure
Table 3: Cost of quality values.
Quality of conformance 100% 0% Model
1 17% 190000 100000 100000
2 33% 190400 202000 190750
3 50% 194800 336000 194800
4 67% 188000 380000 188000
5 83% 192800 535000 192800
6 100% 191200 618000 191200
costs. Figure 7(d) illustrates the differences in COQ
of all three inspection strategies. It can be seen that
the model based inspection strategy always
maintains a low COQ which is required for
minimizing associated production costs and
maximising outgoing quality levels in accordance
with the customer requirements.
Figure 7(a): Plot of the costs associated with the relative
product ratings for the 100% inspection strategy.
Figure 7(b): Plot of the costs associated with the relative
product ratings for the 0% inspection strategy.
Figure 7(c): Plot of the costs associated with the relative
product ratings for the model-based inspection strategy.
Figure 7(d): Comparison of the costs of quality plotted on
the same set of axes.
0
20000000
40000000
60000000
80000000
100000000
Profit 100%
Profit 0%
Profit - Model
0
200000
400000
600000
800000
0 50 100
Cost of Quality 0%
185000
190000
195000
200000
0 20406080100
Cost of Quality 100%
Model-basedInspectionfortheControlofQualityinAdvancedManufacturingEnvironments
555
The twentieth trial involved a batch size of 100 000.
Due to the high product rating, the difference in
profit between the 100% and 0% inspection
strategies was extreme. The model was however
able to obtain the same profit a with the 100 %
inspection.
5 CONCLUSIONS
Advanced manufacturing environments involve
frequent changes in product design and process
configuration in accordance with changes in
customer requirements. The supply chain for such an
environment would also have to be dynamic to
accommodate these changes. A model to determine
the frequency of inspection at a strategically located
inspection station was developed using the expected
value formula. The inspection criteria considered
were the costs associated with the product, the
significance of the product to the customer as well as
the supplier and process reliabilities. Twenty trials
were performed whilst varying the inspection
criteria parameters to obtain an overall average
performance of the system. The results from the
simulation were compared to results of simulations
performed to quantify the performance of 100% and
0% inspection process strategies. The 0% inspection
strategy was best suited to processes involving high
reliabilities and low customer significance ratings.
The 100% inspection strategy was best suited to
high customer significance ratings. The model-
based inspection showed an overall increase in
profits gained, for both low and high customer
significance ratings, with a minimisation of the COQ
and was therefore considered to be more suitable to
manufacturing environments which experienced
frequent reconfigurations due to changes in
customer requirements. Further research into
reconfigurable manufacturing systems is currently
being performed globally. A fully functional
manufacturing environment is currently being
implemented at the University of KwaZulu-Natal
manufacturing laboratory. On completion, further
results will be generated and obtained for simulation
of industrial applications.
REFERENCES
Crosby, P. B., Quality is Free. 1979, New York, N. Y.:
McGraw-Hill.
Da Silveira, G., Borenstein, D., & Fogliatto, F. S., 2001.
Mass customization: Literature review and research
directions, International Journal of Production
Economics, 72, (1).
Davrajh, S., Bright, G., 2012. Implementation of
Commercial Products for Reconfigurable Quality
Inspection, M2VIP, NZ
Foster, S. T., 1996 An examination of the relationship
between conformance and quality-related costs,
International Journal of Quality & Reliability
Management, Vol. 13 Iss: 4, pp.50 - 63
Goetsch, D. L., Davis, S. B., 2010. Quality Management
for Organizational Excellence: Introduction to Total
Quality, Pearson, N. J.
ASQ, http://asq.org/learn-about-quality/cost-of-quality/
overview/overview.html, 2013
http://www.statlect.com/expval1.htm, 2013
Juran, J. M., 1951. Quality Control Handbook. 1st ed.,
New York, NY: McGraw-Hill.
Koren, Y., Heisel, U., Jovane, F., Moriwaki, T.,
Pritschow, G., Ulsoy, G., and Van Brussel, H.:
‘Reconfigurable Manufacturing Systems’, CIRP
Annals - Manufacturing Technology, 1999, 48, (2),
pp. 527-540
Nambiar, A. N.: ‘Mass customization : where do we go
from here?’,World Congress on Engineering , WCE
2009, 2009, pp. 687
Pollard, D., Chuo, S., Lee, B., 2008. Strategies For Mass
Customization, In Journal of Business & Economics
Research, 6, (7)
Tseng, M. M., and Du, X., 1998. Design by Customers for
Mass Customization Product, CIRP Annals -
Manufacturing Technology, 47, (1), pp. 103-106
www.ni.com/labview, 2013
Zaklouta, H., 2011. Cost of quality tradeoffs in
manufacturing process and inspection strategy
selection,MSc Thesis, MIT
APPENDIX
Figure A1: GUI for the inspection simulation.
ICINCO2013-10thInternationalConferenceonInformaticsinControl,AutomationandRobotics
556
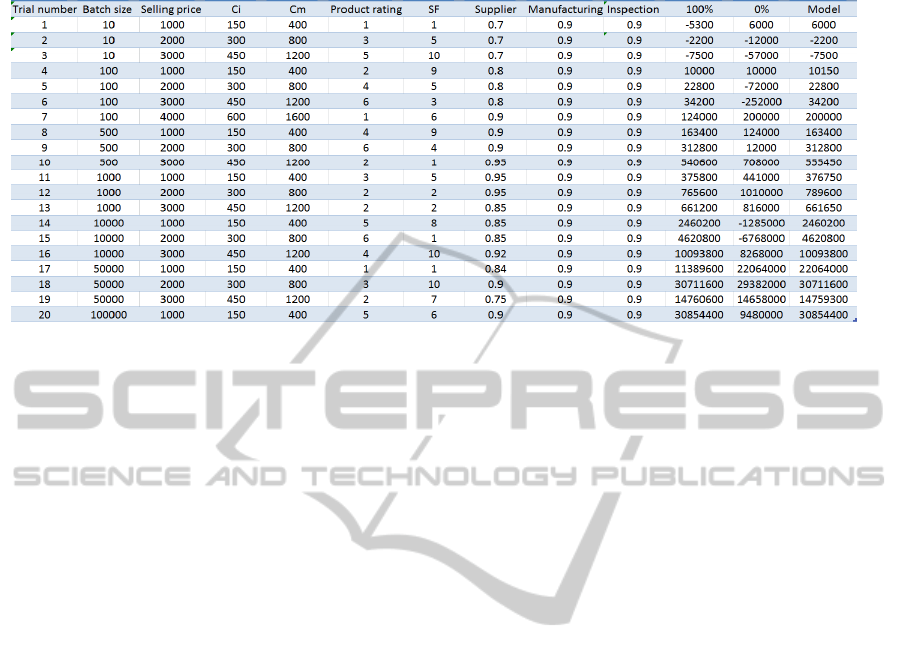
Table A: Tabulated results from the inspection trials.
Model-basedInspectionfortheControlofQualityinAdvancedManufacturingEnvironments
557
