
Memorability Experiment Vs. Expert Method in Websites Usability
Evaluation
Marek Miłosz, Magdalena Borys and Maciej Laskowski
Institute of Computer Science, Lublin University of Technology, Lublin, Poland
Keywords: Memorability, Web Usability, Expert Analysis, Experimental Method, Website Usability Evaluation.
Abstract: The quantitation of website usability is possible by using experimental method with a group of users and
experts. In this paper an experiment of determining the short memorability is presented, along with using its
results for the comparative assessment of usability of Polish public administration websites. The expert
review was conducted on the same websites using the authors’ list of control questions and method for
determining the complex assessment of website usability. The degree of correlation of both methods is
presented and discussed.
1 INTRODUCTION
In the early 1990s usability becomes a key issue in
software industry and lots of methods testing and
assuring usability have been developed since then.
The usability is often a purely economic matter
(Rajanen and Jokela, 2004). However, it has to be
noticed that usability issues do not only appertain to
the commercial software – they do apply to all of the
software services, also those public or non-
commercial (Lee and Koubek, 2012); (Topaloglu et
al., 2012).
Adjusting the software and its interface in order
to meet the needs of its users is not only essential
due to economic causes. It may also be an important
legal matter because the legislation in many
countries and EU, focused on providing universal
access to the information published online to all of
their citizens, have been introduced (Laskowski and
Szymczyk, 2010).
The main focus in the field of usability is laid on
the relative effectiveness of empirical usability
studies in opposition to other, less costly, methods.
The expert based methods held the promise of
usability results that kept cost low by relying on
expert review or analysis of interfaces rather than
observing actual user behavior (Hollingsed and
Novick, 2007). The experiment presented in the
paper shows the correlation between expert based
evaluation method and actual user performance.
2 USABILITY OF WEBSITES
The idea of usability, although intuitively easy to
explain, is indeed a very complex concept
(Landauer, 1996). It generally applies to user
interface, although is influenced by other factors,
such as ontology and information architecture of the
service (Lee et al., 2011); (Seffah et al., 2006).
The growth of the Internet and Web technologies
resulted in the development of Web usability as part
of usability as general. Huge variety of users,
meaning a variety of abilities, needs, used software
and hardware also imprints the Web usability
(Landauer, 1996); (Lee et al., 2011)
Classically, usability is defined by five different
components of websites (Nielsen, 1993):
Learnability, meaning the user’s ability to work
with the website while using it for the first time.
Use efficiency, meaning the productivity of user
while working with the website.
Memorability, also referred as retainability (e.g.
Montero et al. 2008), meaning the user’s ability
to reach the efficiency in working with website
after a long period of not using it. This property
is especially important for websites, which are
used only occasionally.
Errors, which are usually connected with the
approach how users handle errors and how the
web application supports this process. This
mainly applies to errors in human-computer
interactions.
151
Miłosz M., Borys M. and Laskowski M..
Memorability Experiment Vs. Expert Method in Websites Usability Evaluation.
DOI: 10.5220/0004453801510157
In Proceedings of the 15th International Conference on Enterprise Information Systems (ICEIS-2013), pages 151-157
ISBN: 978-989-8565-61-7
Copyright
c
2013 SCITEPRESS (Science and Technology Publications, Lda.)
Satisfaction – this property strongly influences
on the rate of user return in case of websites used
occasionally.
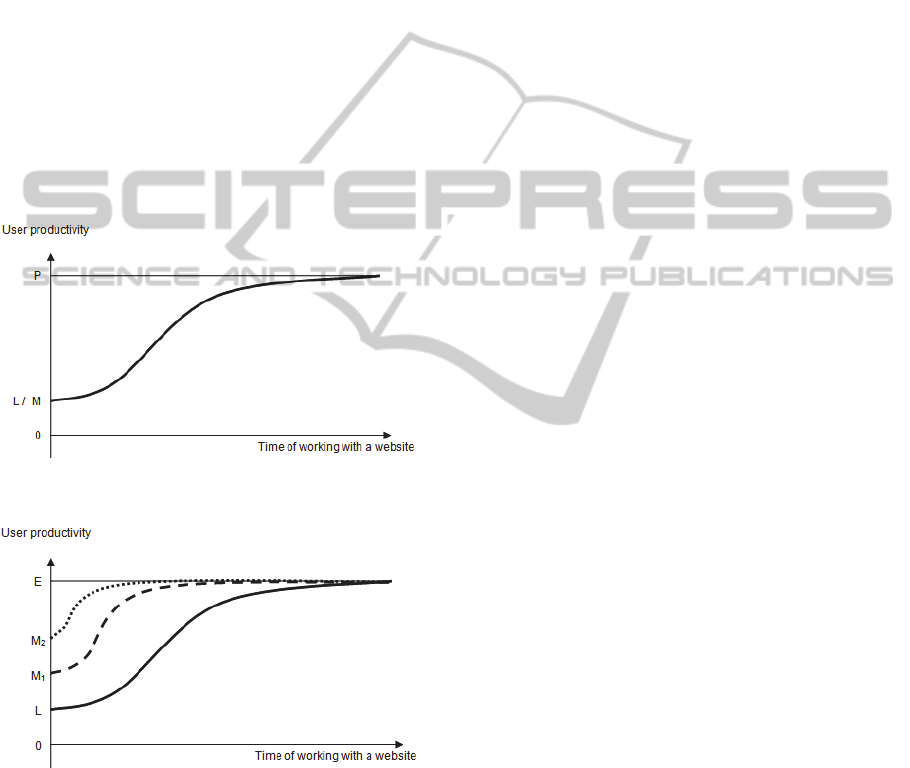
The first properties listed by Nielsen are connected
to the web application learning curve (Figure 1),
meaning the change of user productivity as his
experience grows. In classical applications the initial
productivity (meaning the productivity measured
during the very first contact with the application –
marked in Figure 1 as L/M) is negative in many
cases. A user is learning how to work with the
application by involving other users in this process
and – as a consequence – decreasing their
productivity (Göransson et al., 2003).
In case of web applications this point can be
close to 0 (low usability) or to the point of maximum
productivity (perfect usability). Of course higher
productivity (marked in Figure 1 as P) means higher
usability of the discussed web application.
Figure 1: Learning curve.
Figure 2: The initial and renewed learning curve.
The position of L/M point and the curve slope in
Figure 1 during the first contact is a measure for the
ease of learning and – in case of the second contact
after a break – the memorability (Figure 2).
Figure 2 presents the comparison of the learning
curves during the first contact with web application,
the second (after a break) and another one. L, M
1
and M
2
points show the initial user productivity
during the first and subsequent contacts with the
web application. Due to memorability, we should
observe the relation between the values: L< M
1
< M
2
<... . It means that the initial productivity increases
from one to next using of a web application.
The same approach can be also seen in many
different definitions of usability presented in
literature (e.g. Montero et al., 2008). Despite the fact
that memorability (also referred as Ease to be
remembered or Learning-time) is listed as one of
important factors of usability, there is not many
research focus on it. The economic model of
memorability was discussed recently (Miłosz and
Lujan-Mora, 2013). The other research concentrate
rather on software elements such as mobile service
notifications (Garzonis et al., 2009), information
charts (Bateman et al., 2010), visualization graphs
(Ghani and Elmqvist, 2011) and so on. On the other
hand the usability testing of web applications was
proposed as a part of developing cycle in agile
methods (Lujan-Mora and Masri, 2012)
3 MEASURING USABILITY
Due to its complexity, the usability cannot be
measured directly (Cakir and Oztaysi, 2009).
Through operationalization of the usability
construct, the specified variables defining usability
(product attributes) were introduced in usability
analysis (see: (Palmer, 2002); (Hornbaek, 2006)).
There are many different methods for evaluating
usability as well as many metrics to measure of the
usability level.
3.1 Usability Evaluation Methods
Classification
In recent years, many Usability Evaluation Methods
(UEMs) have been employed to assess websites
(Palmer, 2002); (Cakir and Oztaysi, 2009);
(Pressman and Lowe, 2009).
Regarding to type of evaluation performed,
UEMs can be classified into one of following
categories (Fernandez et al., 2011): automated or
manual.
On the other hand, the following group of UEMs
can be defined taking into consideration the type of
UEMs used in analysis (Petrie and Bevan, 2009):
automated checking of guidelines and standards
conformance,
expert evaluation,
evaluation with users or potential users,
ICEIS2013-15thInternationalConferenceonEnterpriseInformationSystems
152

evaluation using models and simulations,
evaluation of collected data during (evaluated)
system usage.
Among presented UEMs groups, the evaluation
carried out by experts is the most frequently used. It
usually used as an independent analysis or in
combination with methods from other groups.
An expert-based evaluation is performed by
a usability expert, domain expert or double expert,
who has expertise both in usability and in particular
type of interface being evaluated, to identify defects
in the interface. There are following expert-based
usability evaluation methods:
Expert review.
Cognitive walkthrough.
Pluralistic walkthrough.
Heuristic evaluation.
Heuristic walkthrough.
Guidelines inspection.
The methods referred as reviews or inspections do
not use task scenarios, in opposite to task-based
evaluations are referred as walkthroughs.
3.2 Usability Metrics Overview
UEMs measure product attributes using different
metrics (Palmer, 2002). A metric relates a defined
evaluation approach and a measurement scale.
Thereby, the decision which metric of usability use
is the consequence of selected UEM.
Moreover, the selection of metrics demands the
understanding of the relation between different
measures of usability as well as limitations of
employed usability metrics.
There are few types of usability metrics that can
be used during a usability evaluation. The simple
classification of usability metrics is the following
(Tullis and Albert, 2008):
performance metrics,
issue-based metrics,
self-reported metrics,
behavioural and physiological metrics.
Many examples of the usability metrics usage can be
found in mentioned book (Tullis and Albert, 2008).
3.3 Used Approach
In the presented research, two new metrics for
quantitative assessment of the websites usability
have been used.
The first metric uses the results of memorability
experiment and can be called as a Memorability
Level metric. The Memorability Level (ML) is
calculated as:
f
f
T
TT
ML
(1)
where:
f
T - the average (arithmetic mean) execution time
of performing tasks for the first time by
inexperienced users;
T - the average execution time of performing
tasks for n-time by experienced users
(
n
).
The value of ML is calculated as an average time in
the group or users, working with website or web
application. According to (Woolrych and Cockton,
2001) the number of users in an experiment may be
small – from ten to fifteen participants are enough
for the properly experiment conducting. Higher
value of ML means the website is easier to
remember between visits, thus it can be conclude
that the quality of UI is higher (better).
The second metric applies to quantitative
assessment of the website interface usability is the
Web Usability Points (WUP).
4 WEB USABILITY POINTS
In order to obtain the best results in evaluating
usability of websites, the mix of an expert review
and a short cognitive walkthrough method was
proposed. The proposed method covers the
following areas:
Application interface.
Navigation and data structure.
Feedback, system messages, user help.
Content (e.g. of a website).
Data input.
Table 1 shows the detailed list of areas and subareas
(tentatively called “LUT list”) with questions
assigned to each point. Accordingly, Table 2
presents the grading scale used to assess each tested
area.
The results of proposed evaluation approach can
be used to calculate Web Usability Points as a
complex factor (rate) of the usability of websites
GUI. WUP metric uses grades (Table 2) granted by
experts to each question from the LUT list (Table 1).
MemorabilityExperimentVs.ExpertMethodinWebsitesUsabilityEvaluation
153
WUP for websites can be calculated as:
ij
ia
q
k
ijk
s
j
ij
n
i
ia
p
qsn
WUP
11
111
(2)
where:
a
n - number of areas,
i
s - number of subareas in i-area,
ij
q - number of questions in i-area and j-subarea,
ijk
p - grade value (points) granted to k-question in
j-subarea in i-area.
The value of WUP varies from 1 to 5. The higher
value indicates better usability of the interface.
Table 1: LUT list of predefined testing areas with
questions assigned.
Web application interface
Layout
Is the layout readable?
Is it adjusted to different resolutions?
Is it adjusted to mobile devices?
Is it consistent?
Does it support task implementation?
Color scheme
Is there proper contrast between text and
background ?
Is the color scheme readable for people with
color vision disorders?
Is the color scheme readable on various
kinds of displays?
Navigation and data structure
Ease of use
Is the access to all sections of a web
application easy and intuitive?
Is the access to all functions of a web
application easy and intuitive?
Information
hierarchy
Isn’t the information hierarchy too
complicated?
Information
structure
Is the information structure understandable
for users?
Is it consistent?
Is it well planned?
Screen
elements
Do they support the navigation?
Feedback, system messages, user help
System
messages
(general)
Do they provide enough information on the
status of actions performed by user?
System
messages
(errors)
Do they contain hints on problem solution?
Feedback and
user help
Does the information appear in places,
where it may be needed?
Is the provided information understandable
for an average user?
Is the provided information accessible for an
average user?
Is it possible for an average user to perform
actions suggested by system help in order to
solve the encountered problem?
Table 1: LUT list of predefined testing areas with
questions assigned. (cont.)
Content
Labels
Do the labels used in the interface provide
enough information?
Do all the interface elements have necessary
labels?
Naming
Is the interface naming understandable for
its users?
Is the interface naming consistent?
Page text Is it understandable for users?
Data input
Data
Is the data validated by the form elements?
Do the forms have elements acting as hints
for the input data (e.g. on format or data
range)?
Can average user fill in the form easily?
Forms
Are they designed in a readable way?
Are they adjusted to the mobile devices?
Do they allow user to input all of the
necessary data?
Table 2: Grading scale applied to LUT list.
Grade Description
1
Critical GUI errors were observed, preventing
normal usage or discouraging user from using the
web application.
2
Serious GUI issues were encountered, which may
prevent most users from task realization.
3
Minor usability GUI issues were observed, which if
accumulated may have negative impact on user
performance.
4
Single minor GUI issue was observed, which may
have negative impact on user work quality (e.g.
poor readability).
5
No GUI issues influencing either user performance
or work quality were identified.
5 EXPERIMENT AND RESULTS
5.1 Research Question
The goal of our study is to examine the
memorability experiment usefulness from the point
of view of the following research question:
”Whether the memorability experiment provides
comparable results in the usability evaluation to
other methods”. Since the research question is broad,
it has been decomposed into two sub-questions to be
addressed. These research sub-questions are the
following:
1. Does memorability experiment provide the
usability assessment in rating scale?
2. Are the Memorability Level and Web Usability
Points metrics comparable?
ICEIS2013-15thInternationalConferenceonEnterpriseInformationSystems
154
5.2 Research Hypotheses
To examine the research question following research
hypotheses were formulated:
1. Memorability experiment provides usability
assessment in rating scale.
2. Results of evaluations provided by memorability
experiment and expert review method are
comparable.
5.3 Research Methodology
The research hypotheses were verified by
experimental works. The experiments were
conducted on three websites of public administration
offices in following cities: Warsaw, Lublin and
Chełm. All websites contains the same features and
were created based on the same law and principles to
access to public information in Poland named Public
Information Bulletin (in Polish: BIP).
Research methodology consisted of the
following phases:
1. The assessment of WUP for each website using
proposed method with LUT list.
2. Experimental determination of ML value for
each website tracking the performance of group
of participants using special scenario for short
term memorability analysis.
3. The analysis of obtained data to verify the
research hypothesis.
The first phase involved the described method of
expert review and short cognitive walkthrough using
LUT list (Table 1), proposed grading scale (Table 2)
and formula (2).
The second phase was a regular experiment with
group of 15 participants (13 males and 2 females)
performing the same task for three websites. All
participants were Bachelor’s Degree students of
Computer Science at the Faculty of Electrical
Engineering and Computer Science of Lublin
University of Technology. The task was repeated
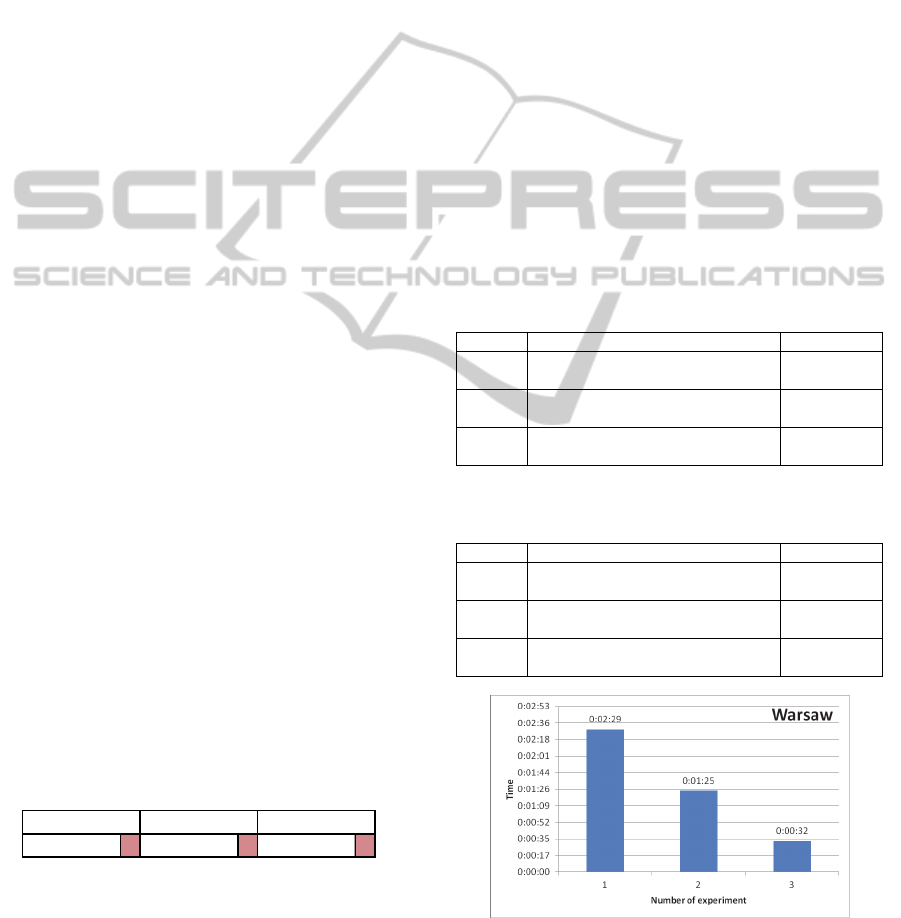
each 30 minutes. Figure 3 shows the experiment
schema.
Experiment 1 Experiment 2 Experiment 3
30 min 30 min 30 min
Figure 3: Time planning of the short memorability
experiment.
Between the sequences of carried out tasks, the
participants performed other activities with
computers. Those other activities were not
connected with the research. The tasks were simple
and short-term. The web browser had the browsing
history option disabled and the participants were
allowed to use only the tools provided by the
assessed websites. In addition, the participants
changed the workstations between each task
sequence. The results (duration of the task
performance) were recorded and averaged for the
entire group.
The third phase involved the analysis of data
obtained, performing the calculations, creating the
charts and examining the correlation between WUP
and ML in the group of websites. As a measure of
the degree of correlation, the Pearson correlation
coefficient was used.
5.4 Results
The results of expert review of tested websites are
shown in Table 3. WUP was calculated using the
formula (2). Table 4 and Figures 4-6 present the
memorability experiment results.
Table 3: Results of expert review - websites WUPs.
No Name of the website WUPs
1
Public Information Bulletin of
Warsaw (BIP Warsaw, 2013)
4.2
2
Public Information Bulletin of
Lublin (BIP Lublin, 2013)
5.0
3
Public Information Bulletin of
Chełm (BIP Chełm, 2013)
3.4
Table 4: Results of memorability experiment –
memorability levels of websites.
No Name of the website ML
1
Public Information Bulletin of
Warsaw (BIP Warsaw, 2013)
78.3%
2
Public Information Bulletin of
Lublin (BIP Lublin, 2013)
71.2%
3
Public Information Bulletin of
Chełm (BIP Chełm, 2013)
81.5%
Figure 4: Results of memorability experiment for BIP
Warsaw.
MemorabilityExperimentVs.ExpertMethodinWebsitesUsabilityEvaluation
155
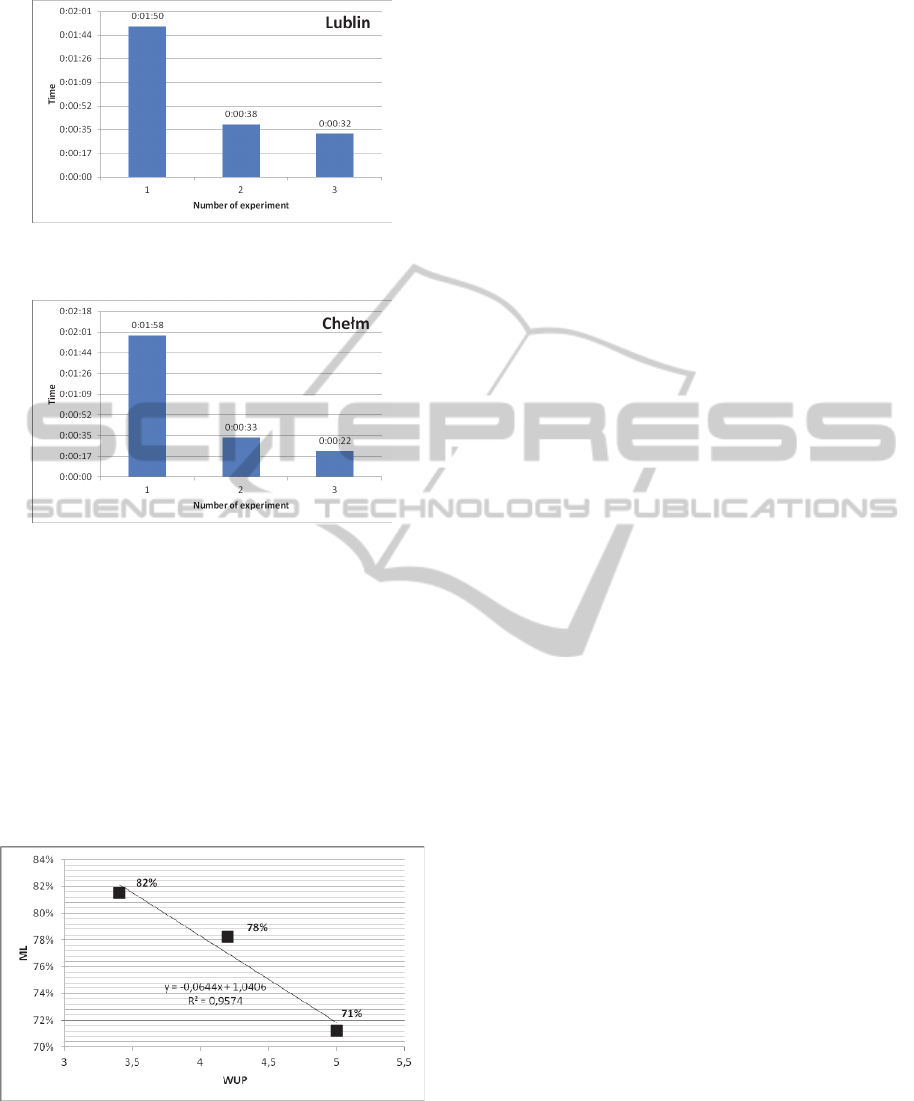
Figure 5: Results of memorability experiment for BIP
Lublin.
Figure 6: Results of memorability experiment for BIP
Chełm.
The analysis of correlation between the values of
two measures of websites usability shows that there
is a strong negative correlation (Figure 7). Pearson's
coefficient for the experiments is: -0.97. The result
is rather surprising: better GUI usability rate the
lower memorability level. This may be explained by
the fact that a good interface does not force user to
remember website structure and navigation,
therefore user performs task each time with the same
efficiency.
Figure 7: Correlation between WUP and ML.
6 CONCLUSIONS
The main purpose of this research was to investigate
if the memorability experiment provides comparable
results in the GUI usability evaluation to other
evaluation methods, such as the expert review.
The analysis of results for Hypothesis 1 showed
that memorability experiment can provide data to
assessment of websites usability in a rating scale.
The Memorability Level metric is proposed in this
paper.
The main result of the study is to identify the
existence of possible correlation between the
assessment of website interface usability provided
by the expert and Memorability Level which is
determined during the experiment with the real
website users. Website interface usability can be
measured in Websites Usability Points, proposed in
this paper.
Moreover, in the paper the relationship between
ML and WUP was studied, based on examination of
three websites with similar features and purpose.
Hypothesis 2 (Comparability of expert and
memorability methods) has been fully confirmed.
During the research the statistical correlation
between the two indicators: WUP and ML of
website has been found. Correlation is negative
(which is unexpected) – the higher usability of
website GUI measured in WUP causes the lower
memorability level.
Discovered relationship can be used to examine
GUI usability through memorability testing.
However, the statistical indicators (Pearson
coefficient) were determined for relatively small
population of websites. Therefore, the results should
be verified in more extensive study, which will
include a larger number of websites and their greater
diversity. It is also possible to introduce an
additional dimension to the experiment to reflect
user experience. Therefore the research can be
extended to include different groups of Internet
users.
ACKNOWLEDGEMENTS
Authors would like to thank all students who took
part in the experiment for their contribution to this
paper.
REFERENCES
Bateman S., Mandryk R. L., Gutwin C., Genest A.,
McDine D., Brooks Ch., 2010. Useful Junk? The
Effects of Visual Embellishment on Comprehension
and Memorability of Charts. In CHI '10 Proceedings
ICEIS2013-15thInternationalConferenceonEnterpriseInformationSystems
156

of the SIGCHI Conference on Human Factors in
Computing Systems, NY, pp. 2573-2582.
BIP Chełm, Public Information Bulletin of Chełm, http://
chelm.bip-gov.info.pl/bip/
BIP Lublin, Public Information Bulletin of Lublin, http://
bip.lublin.eu
BIP Warsaw, Public Information Bulletin of Warsaw,
http:// bip.warszawa.pl.
Cakir C. B.; Oztaysi B., 2009. A model proposal for
usability scoring of websites. In International
Conference on Computers & Industrial Engineering,
CIE 2009, 6-9 July 2009, pp.1418-1422.
Fernandez A., Insfrán E., Abrahão S., 2011. Usability
evaluation methods for the web: A systematic
mapping study. In Information & Software Technology
53(8), pp. 789-817.
Garzonis S., Jones S., Jay T. and O’neill E., 2009.
Auditory icon and earcon mobile service notifications:
intuitiveness, learnability, memorability and
preference. In CHI '09 Proceedings of the SIGCHI
Conference on Human Factors in Computing Systems,
NY, pp. 1513-1522.
Ghani S., Elmqvist N., 2011. Improving revisitation in
graphs through static spatial features. In GI '11
Proceedings of Graphics Interface 2011. Waterloo,
Canada, pp. 175-182.
Göransson, B., Gulliksen, J., Boivie, I., 2003. The
usability design process – integrating user-centered
systems design in the software development process.
In Software Process: Improvement and Practice, Vol.
8, Issue 2, pp. 111–131.
Hollingsed T., Novick D. G., 2007. Usability Inspection
Methods after 15 Years of Research and Practice. In
SIGDOC '07 Proceedings of the 25th annual ACM
international conference on Design of communication,
NY, pp. 249-255.
Hornbaek K., 2006. Current Practice in Measuring
Usability: Challenges to Usability Studies and
Research, In International Journal of Human-
Computer Studies, Volume 64, Issue 2 , February
2006, pp. 79-102.
Landauer Th. K., 1996. The Trouble with Computers:
Usefulness, Usability, and Productivity. MIT Press.
Laskowski M., Szymczyk T., 2010. Economic and legal
aspects of adjusting online advertisements for visually
impaired, In: Actual Problems of Economics, No. 6
(108), pp. 301-308
Lee K. I., Jin B. S., Ji Y. G., 2011. The scenario-based
usability checklist development for home appliance
design: A case study. In Human Factors and
Ergonomics in Manufacturing & Service Industries,
January/February 2011, Vol. 21, Issue 1, pp. 67–81.
Lee S., Koubek R. J., 2012. The effects of usability and
web design attributes on user preference for e-
commerce web sites. In Computers in Industry,
Vol. 61, Issue 4, May 2010, pp. 329–341.
Lujan-Mora, S., Masri, F., 2012. Integration of Web
Accessibility into Agile Methods. In Proceedings of
ICEIS 2012 Conference, pp. 123-127.
Miłosz M., Lujan-Mora S., 2013. Economical Aspect of
Website Memorability. In Actual Problems of
Economics, Issue 4 (142) (in press)
Montero F., Lozano M. D., Gonzales P., 2008. Usability-
Oriented Quality Model Based on Ergonomic Criteria.
In: Muñoz C. C., Moraga A., Piattini M. (2008)
Handbook of Research on Web Information Systems
Quality, IGI Global, NY, pp. 220-233.
Nielsen J., 1993. Usability Engineering. Morgan
Kaufmann, San Francisco.
Palmer J. W., 2002. Web site usability, design, and
performance metrics. In Information Systems
Research, 13(2), pp. 151-167.
Petrie H., Bevan N., 2009. The evaluation of accessibility,
usability and user experience. In The Universal Access
Handbook. CRC Press.
Pressman R. S., Lowe D., 2009. Web Engineering:
a Practitioner's Approach. McGraw-Hill, NY.
Rajanen M., Jokela T., 2004. Analysis of Usability Cost-
Benefit Models. In Proceedings of the Twelfth
European Conference on Information Systems (Leino
T, Saarinen T, Klein S. eds.), Turku School of
Economics and Business Administration, Turku,
pp. 1535-1545.
Seffah A., Donyaee M., Kline R. B., Padda H. K., 2006.
Usability measurement and metrics: A consolidated
model. In Software Quality Control, Vol. 14, Issue 2,
pp. 159–178.
Topaloglu, H., Gumussoy, C. A., Bayraktaroglu, A. E. and
Calisir, F., 2012. The relative importance of usability
and functionality factors for e-health web sites. In
Human Factors and Ergonomics in Manufacturing &
Service Industries.
Tullis T., Albert W., 2008. Measuring the User
Experience: Collecting, Analyzing, and Presenting
Usability Metrics. Morgan Kaufmann, 1
st
edition.
Woolrych, A., Cockton, G., 2001. Why and When Five
Test Users aren't Enough. In Proceedings IHM-HCI
Conference, Volume 2, pp. 105-108.
MemorabilityExperimentVs.ExpertMethodinWebsitesUsabilityEvaluation
157
