
Pervasive Information Systems to Intensive Care Medicine
Technology Acceptance Model
Jorge Aguiar
1
, Filipe Portela
1
, Manuel Filipe Santos
1
, José Machado
2
, António Abelha
2
Álvaro Silva
3
, Fernando Rua
3
and Filipe Pinto
4
1
Algoritmi Centre, University of Minho, Azurém, Guimarães, Portugal
2
CCTC, University of Minho, Braga, Guimarães, Portugal
3
Serviço de Cuidados Intensivos, Centro Hospitalar do Porto, Porto, Portugal
4
Escola Superior de Tecnologia e Gestão, Instituto Politécnico de Leiria, Leiria, Portugal
Keywords: Information Systems, Technology Acceptance Model, Delphi, Intensive Care.
Abstract: The usability of information systems in critical environments like Intensive Care Units (ICU) is far than the
expected and desirable. Typically, ICUs have a set of not integrated information silos and a high number of
data recorded in paper. Whenever ICU professionals need to make a decision they have to deal with a high
number of data sources containing useful information. Unfortunately, they can't use those sources due to the
difficulty of evaluating them in a correct time. Pervasive Intelligent Decision Support Systems (PIDSS),
operating automatically and in real-time, can be used to improve the decision making if they are suited to
the requirements of the ICU. In this work a PIDSS have been assessed in terms of quality and user
acceptance making use of Technology Acceptance Model (TAM). TAM proved to be very useful when
combined with Delphi method features to involve the professionals and to make the system usable.
1 INTRODUCTION
Nowadays, intensive care professionals face
important obstacles to take decisions in a short time.
Intensive Care Units (ICU) are recognized as a place
where there are, a high number of electronic devices
to collect the patient data, a high number of
information silos and a high number of information
in paper. This situation contributes to increase the
number of data available in the moment of the
decision. However, to a human it is very difficult
access to all the information in a correct time
without technology help. To give support to ICU
professionals in the Decision Making process, a
research project called INTCare was developed. The
first goal of the project was to develop an Intelligent
Decision Support System (IDSS) to predict organ
failure and patient outcome for the next hour. Later,
a Pervasive IDSS (PIDSS) has been deployed. This
implied a set of modifications in the ICU
information systems (IS). In this context, was
developed an automatic and real-time data
acquisition system and a platform to record /
validate / consult the patient data in real-time. To
assure the success of information systems and
associated technologies it is very important to assess
the system quality and the acceptance level by the
users. In order to assess the technology acceptance
by the users (nurses) was used the Technology
Acceptance Model III combined with some features
of Delphi methodology. This paper provides an
overview of the system, presents the methodologies
used and the results achieved. The present work
allows a better comprehension of the importance that
a PIDSS has to the ICU needs and the respective
technology acceptance by the professionals.
This paper is divided in six sections. The first
one makes an introduction to the subject. The second
section presents some background and related work.
Then the third section presents the questionnaire
elaborated and the relationship with TAM. Fourth
section presents the results at level of TAM III.
Finally, in section five the results are discussed and
in section six some conclusions are done.
177
Aguiar J., Portela F., Santos M., Machado J., Abelha A., Silva Á., Rua F. and Pinto F..
Pervasive Information Systems to Intensive Care Medicine - Technology Acceptance Model.
DOI: 10.5220/0004441001770184
In Proceedings of the 15th International Conference on Enterprise Information Systems (ICEIS-2013), pages 177-184
ISBN: 978-989-8565-59-4
Copyright
c
2013 SCITEPRESS (Science and Technology Publications, Lda.)

2 BACKGROUND
2.1 Pervasive Information System
Over the last three years, some important changes
were made in the ICU Information System (IS):
gathering and processing the data in real-time and
introduction of intelligent agents in order to perform
some tasks automatically, replacing some manual
operations. During the development of the project
the environment also was changed. This system
meets some of pervasive health care (Varshney,
2009) and pervasive computing (Orwat et al., 2008);
(Saha and Mukherjee, 2003) features, namely: health
care for anyone anywhere and anytime, remove
restraints of time and location, increase both the
coverage and the quality of healthcare; scalability,
heterogeneity, integration, invisibility and context
awareness. Now, the IS interoperates with the data
acquisition system to automatically and in real-time
provide a set of data anywhere and anytime.
Currently, the INTCare system performs all tasks
automatically, online and in a real-time.
2.1.1 Architecture
The IS architecture of ICU is divided into two
subsystems: one to collect the data and another to
process and obtain the knowledge. To obtain the
data there are two ways of acquisition: manually and
automatically. To produce the knowledge, a set of
intelligent agents are used in order to automatically
execute some tasks according to the targets (e.g.,
predict organ failure, score ICU measures, and
calculate Critical Events). Now, the data is acquired
online, in real-time and in an electronic format using
automatic or manual procedures. The data is
provided from several data sources (eg. bedside
monitors (vital signs), laboratory results, eletronic
health record (EHR), pharmacy (drugs
prescription)). Then, the data acquired are stored
into the database and made available online through
the Electronic Nursing Record (ENR).
2.1.2 Electronic Nursing Record
Electronic Nursing Record (ENR) is a platform that
was developed with the objective to collect all the
clinical data and make it available to the doctors and
nurses in an hourly-based mode. Now, using ENR,
the ICU professionals can have more information
about the patient, essential to make their decisions.
ENR is a touch and web-based platform. ENR is the
main technology of the ICU and was assessed in
terms of user acceptance. A set of questionnaires
were made having in consideration each component
of the platform. All system features were evaluated.
2.1.3 Decision Making Process
The Decision Making Process (DMP) in ICU is a
crucial process, because the professionals are
dealing with patients in critical condition. The
decision needs to be performed quickly and
assertively. Due to the high number of data sources
present in the ICU it is difficult to have a correct
decision in the right moment. In order to avoid this
problem, INTCare changed the way the data is
presented to the decision makers. Now, taking
advantage from the environment changes and using
an inference engine, new knowledge is provided in
the moment of the decision is made. The utility and
importance of this new knowledge was assessed by
TAM 3. INTCare delivers knowledge essential to
the DMP anywhere and anytime. INTCare can
provide:
Patient Clinical data;
Critical Events tracking;
ICU Medical Scores;
Probability associated to organ failure or death.
2.1.4 Intcare
INTCare (Gago et al., 2006); (Santos et al., 2011) is
an Intelligent Decision Support System (IDSS) to
predict organ failure and patient outcome in real-
time using online-learning. The work deployed
allows for obtaining new types of data electronically
and in real-time (Portela et al., 2010). New
knowledge fundamental to the decision process is
now available automatically and in real-time
(Portela et al., 2011). INTCare uses ENR to acquire
data and present some new knowledge generated in
a pervasive way, i.e., anywhere and anytime.
Intelligent agents are used for processing and
transforming the data automatically, without human
intervention in order to prepare the input variables
for the models.
2.2 Technology Acceptance Model
The evaluation of a certain technology is crucial to
understand its suitability in a specific environment
and also to measure the users’ satisfactoriness level.
One of the most used models in this area is the
Technology Acceptance Method (TAM). The main
purpose of TAM is to present an approach to study
the effects of external variables towards people’s
internal beliefs, attitudes, and intentions
ICEIS2013-15thInternationalConferenceonEnterpriseInformationSystems
178
(Chooprayoon and Fung, 2010). This model is also
important because gives an understanding about the
acceptance of modifications made in the decision
support, and how they can be useful in the course of
ICU professionals’ daily work. More recently,
Venkatesh and Bala set the TAM 2 (Venkatesh and
Bala, 2008) to a model using determinants of the
perceived ease of use(Venkatesh and Davis, 2000)
and developed an integrated model nominated TAM
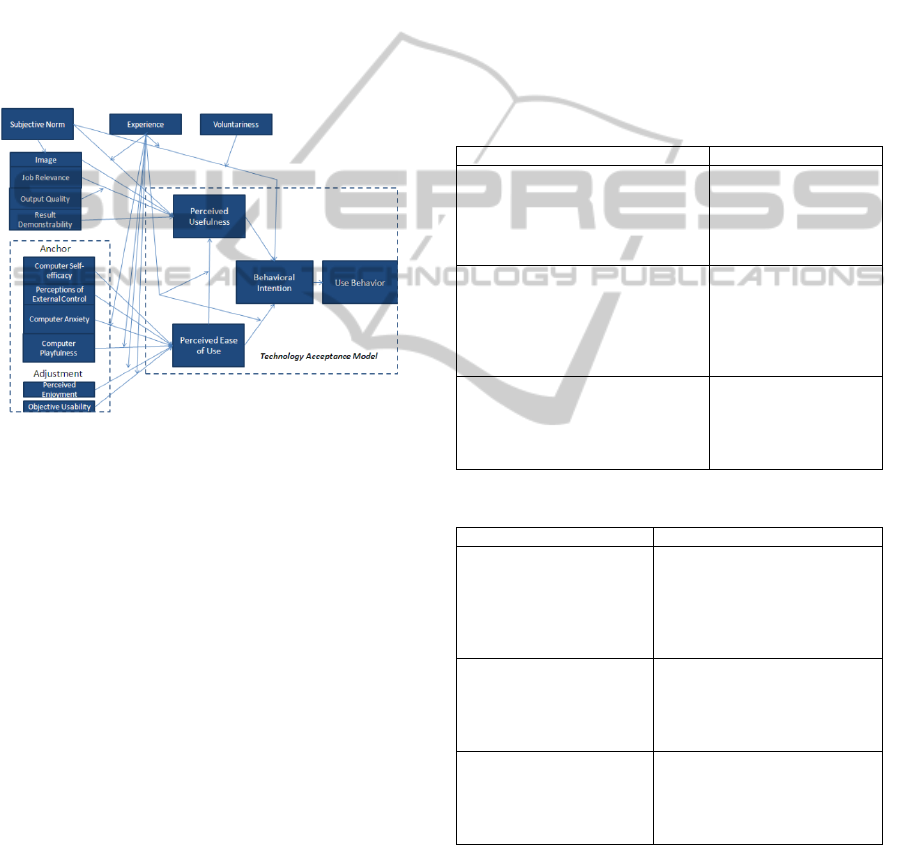
3. TAM 3 is composed by four constructs: Perceived
Ease of USE (PEOU), Perceived Usefulness (PU),
Behaviour Intention (BI) and Use Behaviour (UB)
that are derived from other type of analysis as can be
seen in Figure 2.
Figure 1: Technology Acceptance Model 3 (TAM 3)
(Venkatesh and Bala, 2008).
In order to obtain plausible results in the analysis
of the questionnaires, a program called statistical
data analysis by PAleontological STatistics (PAST)
was used (Hammer et al., 2001). To evaluate the
correlation results was used Kendall’s tau technique.
This technique is a non-parametric correlation
coefficient that can be used to assess and test
correlations between non-intervals scaled ordinal
variables. Kendall’s tau (Bolboaca and Jantschi,
2006) is used as a statistical test to determine if two
variables can be considered as statistically
dependent. The correlation coefficient should deliver
a range of [-1, 1]. If the agreement between the two
evaluations is perfect, the coefficient has a value (1).
If the divergence between the two evaluations is
perfect (inverse of the other), the coefficient has a
value (-1), but if the two evaluations are
independent, the coefficient is nearly zero (Bolboaca
and Jantschi, 2006).
2.3 TAM III and Delphi
The goals of TAM can be achieved by using
methodologies based on questionnaires. As a support
tool it is important to use some aspects/characteristic
of the Delphi method. The basis of the Delphi
method involves the use of questionnaires being one
of its key features (Zackiewicz and Salles Filho,
2010), the preservation of anonymity of the
participants. The questionnaire was prepared by a
coordination team, composed by ICU and IS
professionals, and sent to participants: a group of
experts from the ICU professional team. The
questionnaire was prepared having in account the
constructs of TAM (Venkatesh and Bala, 2008);
(Venkatesh and Davis, 2000) and has as support tool
the Delphi method.
Table 1: TAM advantages and Delphi disadvantages.
Advantages TAM Disadvantages Delphi
- Important not just a technical view,
must also direct attention to the
requirements offered by technology
in order to understand user
behaviour.
- Identification of
specialist to respond to
the questionnaires
- Strand/Slope Quantitative: aims to
understand the social or human
problems from tests of existing
theory, using variables measured
with numbers and analysed with
static procedures
- In many times, the
projections that do, are
wrong or influenced
- It is useful to identify the reason for
non-acceptance of a particular
technology or system by users and
subsequently implement the
appropriate corrections
- Sometimes, they are
ambiguous and divergent
specialists in the same
area
Table 2: Delphi advantages and TAM disadvantages.
Advantages Delphi Disadvantages TAM
- Important that all related
viewpoints are represented
and pay attention to cultural
differences and cognitive
character
- Not evaluated the organizational
context in which the system is
involved, does not evaluated the
situations of centralization,
conflict, hierarchy, stability,
uncertainty of the company
- Defined as an iterative
process designed to combine
opinions of a group of
specialists to achieve a
consensus
- Difficulties in researching the
technology acceptance by the
user with all the variables
involved in its real-time
environment
- necessary to ensure
diversity in the composition
of the group of participants,
so that they cancel each
other
- Many studies use self-report
response type for the verification
of system use
Several authors point to the importance of
combining more than one method or technique on
the methodological framework of an exercise
prospective, to reduce the levels of uncertainty
inherent to type of activity, integrating more
approaches and results. When quantitative methods
(TAM) are combined with qualitative methods
PervasiveInformationSystemstoIntensiveCareMedicine-TechnologyAcceptanceModel
179
(Delphi Method), the explicit knowledge adds up to
tacit knowledge, in seeking complementary or
different views (Santos and Amaral, 2004).
Therefore, the union of the two methods may
involve an improvement in quality and greater
certainty of the results of the evaluation system to
IDSS – INTCare, since the advantages of one
method may mitigate the disadvantages of the other
method. Table 1 and 2 present these points.
3 QUESTIONNAIRES
For this study it was elaborated a questionnaire
based on four constructs of TAM 3: PEOU, PU, BI,
UB. It means that the questionnaire was aggregated
in several groups to represent all the aspects of
TAM. The questionnaire is composed by 96
questions. In this questionnaire was applied the
Likert Scale (Johns, 2010) to evaluate the results. As
a consequence, the chosen scale will follow a range
from one to five, because it gives two values for
each side and at the same time finds a neutrality
point (Johns, 2010). The considered levels were:
1) Not satisfies/in complete disagreement;
2) Satisfies a bit/in some level of disagreement;
3) Satisfies/under some level of agreement;
4) Satisfies a lot/strongly agreement;
5) Satisfies completely/full agreement.
The responses always depend on the goodwill of
each participant by answering in a balanced way to
the questions of a certain group. To avoid wrong
answers it was added three screening questions to
understand the level of the user’s consciousness (ex:
3+2). The nurses scored the questions from 1 (worst)
to 5 (best) points.
4 RESULTS
A preliminary analysis was made after collecting 14
answers (35% of total number of nurses in ICU).
After this, a deeper analysis was done to exclude
invalid or inconsistent answers given by the
participants. Only one participant out of the 14
nurses answered the questionnaire in an inconsistent
way. This situation leads us to consider as valid the
other 13 questionnaires. Table 3 presents the
technology experience of the respondents.
Table 3: Level of experience in information technology
Question Answer %
How much
time do you
spend at the
computer?
Less than 2 hours/day 0%
Between 2 to 4 hours/day 57%
More 4 hours/day 36%
Type of
User?
Full Autonomy 62%
Rarely need technical support 38%
Need regular technical support 0%
Uses
computer
preferably
for?
(multiple)
Application of production staff (email,
text processing, spread sheet)
62%
Handling/Consult administrative info 31%
Handling/Consult clinical info 77%
Handling/Consult management Info 8%
4.1 Analysis
In order to obtain plausible results in the analysis of
the questionnaires, it was necessary to use a program
called statistical data analysis by Paleontological
Statistics (PAST) (Hammer et al., 2001). A
comprehensive analysis has been performed on all
the responses, excepting the text and dispersion
questions (Ex: one + one), as well as an analysis of
the four constructs of TAM 3 by calculating:
Mean, standard deviation (univariate);
Correlation Coefficient (correlation);
Bar Chart (histogram).
Finally, an analysis was performed on the results by
participant, by question, calculating the mean (bars)
and mode values (line).
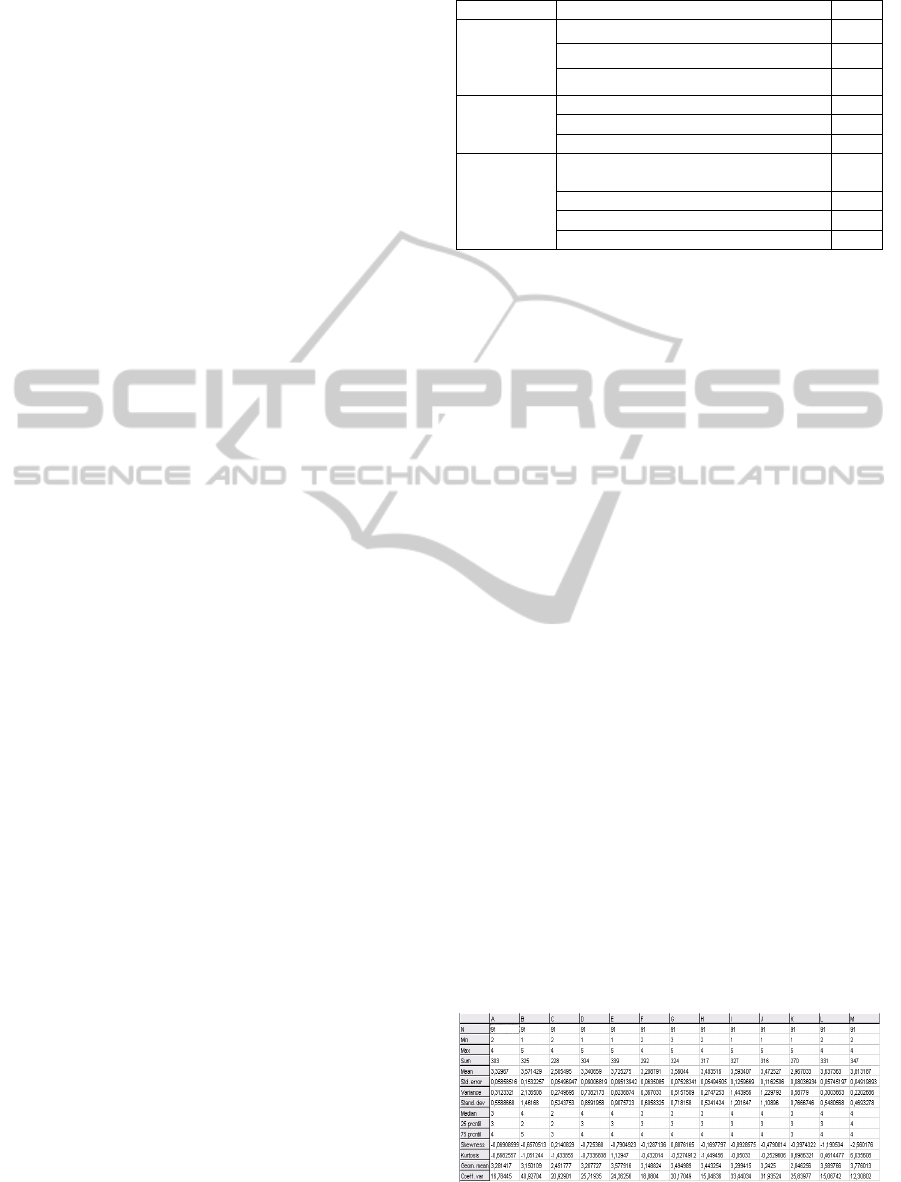
4.1.1 Global Analysis
A Global Analysis of the all responses is presented
in tables 4 and 5. The nurses who participated in the
response to the questionnaires are represented by A
to M.
As can be seen in Table 4 the mean of
responses/evaluations corresponds to level 3.
Standard Deviation (STD) shows a small dispersion,
i.e. the variability in the responses is minimal. The
standard deviation is close to zero, what means that
the respondent maintained a consistency of response
(e.g. nurse (A) showed a deviation of 0, 05858516).
Table 4: Results of univariate analysis global.
The results of the correlation coefficient
ICEIS2013-15thInternationalConferenceonEnterpriseInformationSystems
180
Kendall’s tau are presented in Table 5.
Table 5: Results correlation coefficient Kendall's tau.
In Table 5 nurse G denoted a greater divergence
in the responses (values near to -1). Nurses C and H
showed a good correlation of responses, because
they have a Kendall of 0, 87. This value represents
that between them, the answers were very similar.
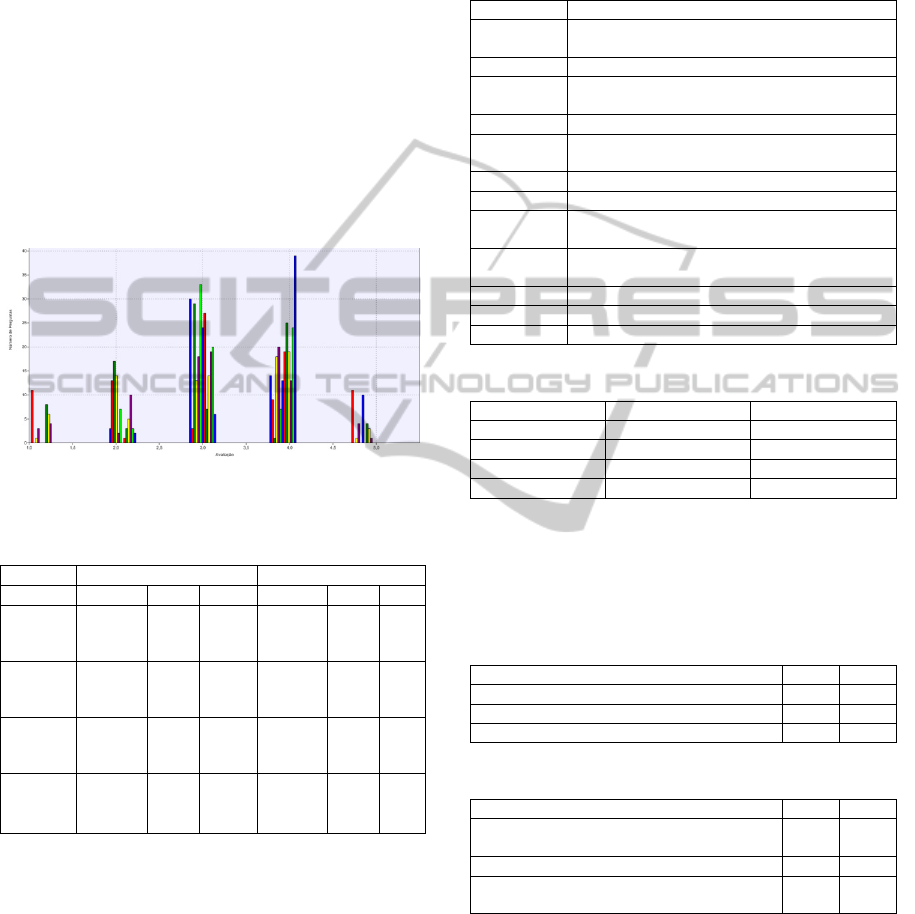
Trough Histogram (Figure 3), it was found that the
vast majority of respondents answered to 91
questions of the questionnaire with a rating between
3 and 4 points.
Figure 2: Global analysis histogram.
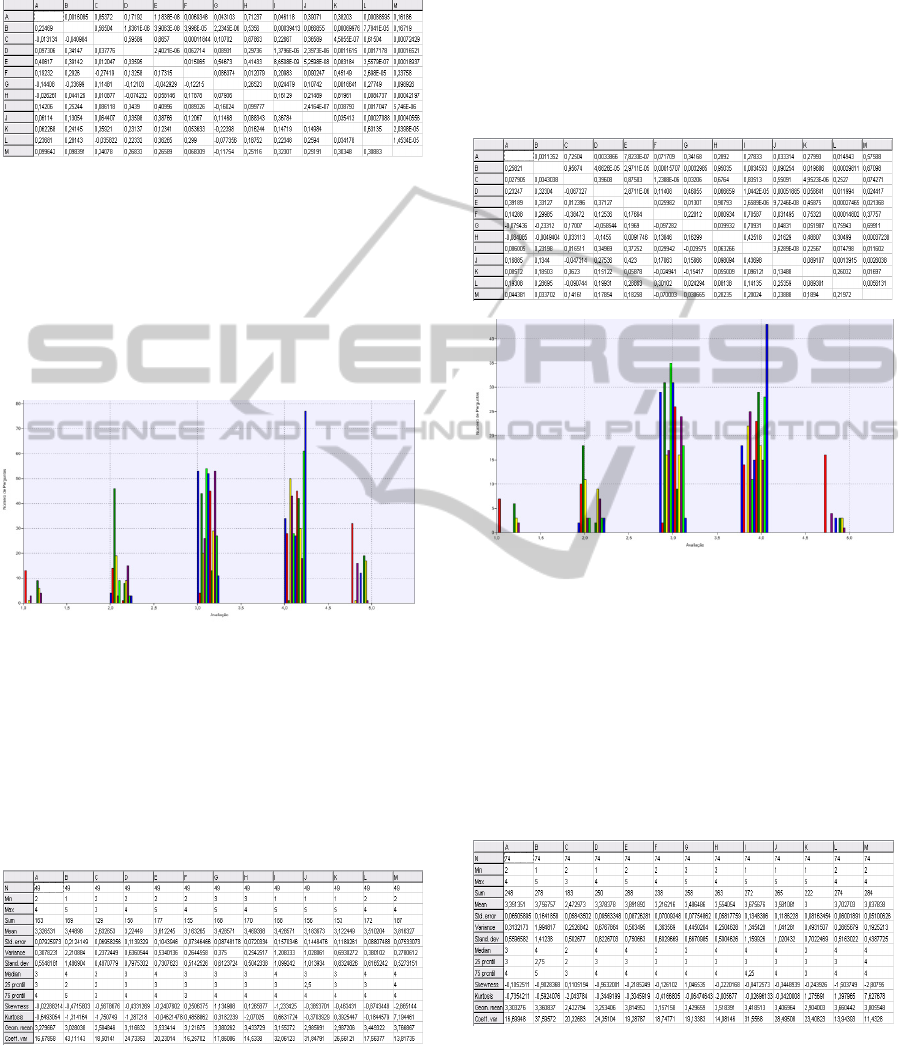
4.1.2 Analysis of the Perceived Usefulness
In order to understand which TAM 3 constructs
achieved better results, an evaluation was made for
each one of them. Table 6 presents the univariate
analysis to perceived usefulness (PU).
Table 6: Results of univariate analysis (PU).
The mean of responses/evaluations was fixed
around the three points. Standard deviation (STD)
denotes a small dispersion. For example, nurse H
maintained consistency of response, showing a
deviation of 0, 0720334. In Table 7 nurse G has a
bigger divergence response, since values were very
close to - 1.While the nurse A showed a lowest
variance with a correlation coefficient nearest to 1.
Based in the histogram of Figure 3 it can be seen
that the most respondents answered 49 questions
related to the construct Perceived Usefulness with an
evaluation positioned between 3 and 4 points.
Table 7: Results correlation coefficient Kendall's tau (PU).
Figure 3: Histogram (PU).
4.1.3 Analysis of Perceived Ease of Use
Through a brief analysis of Table 8, it was found
that the average of responses/evaluations in this
construct was approximately around four points.
Standard deviation (STD error) is not dispersed. It
can be seen that responses are consistent (e.g. Nurse
M had a deviation of 0, 05100626).
Table 8: Results of univariate analysis (PFU).
In Table 9 nurse G showed a bigger divergence
of responses, since values were very close to -1.
However, the nurse E already showed a lower
divergence with a correlation coefficient near to 1.
PervasiveInformationSystemstoIntensiveCareMedicine-TechnologyAcceptanceModel
181
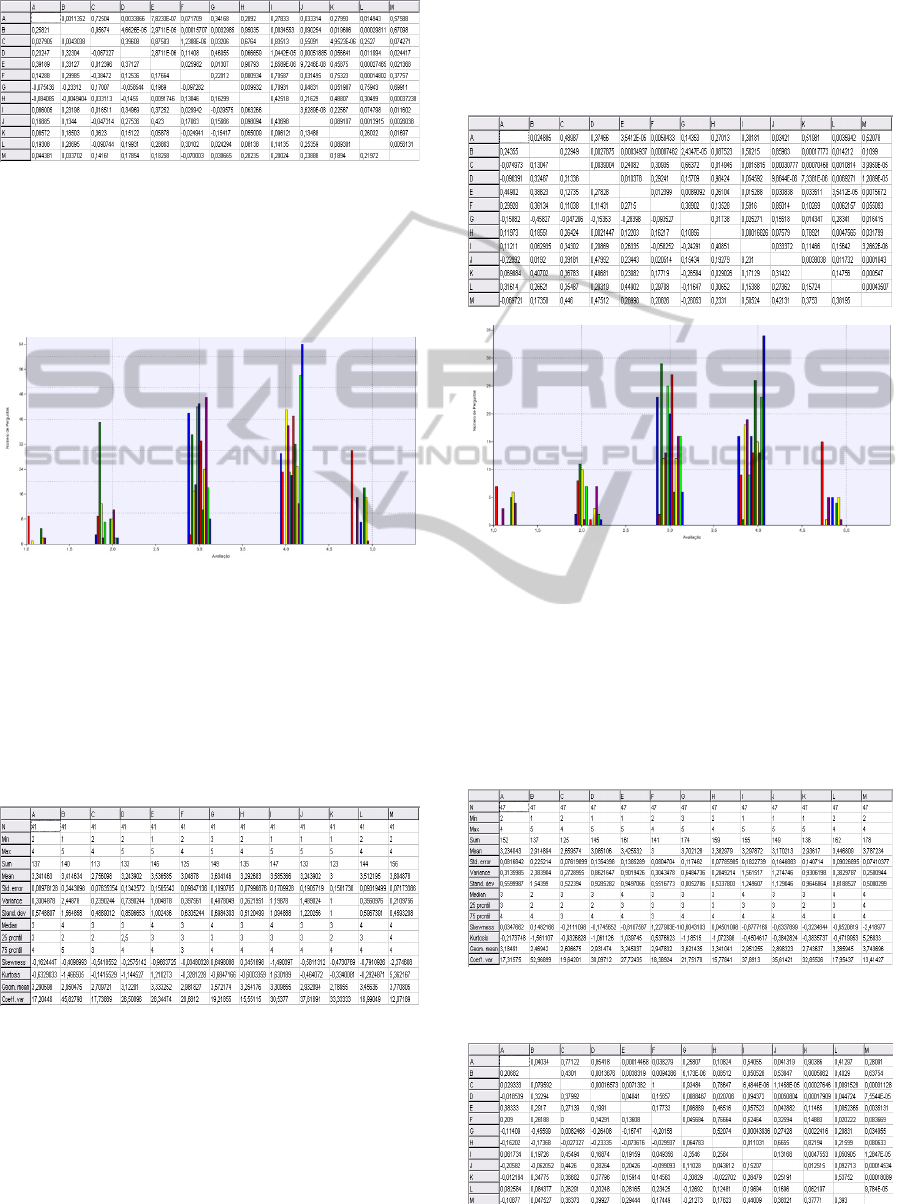
Table 9: Results of the correlation coefficient Kendall's tau
(PFU).
Histogram of Figure 4 indicates that the most
respondents answered 74 questions related to the
construct Perceived Usefulness with an evaluation
located between 3 and 4 points. For example, nurse
M (blue) answered 64% of the questions with 4
points.
Figure 4: Histogram (PFU).
4.1.4 Analysis of Behavioral Intention
Table 10 indicates that only 5 nurses used all point
scales. Standard deviation (STD error) is not
dispersed. For example, nurse M showed a deviation
of 0, 07173386.
Table 10: Results of univariate analysis (BI).
In Table 11 nurse G already showed a bigger
divergence of responses, since values were very
close to -1. However, the nurse B and J showed a
lower divergence with a correlation coefficient near
to 0,86.
Histogram of Figure 5 indicates that the most
respondents answered the 41 questions related to the
construct Behavioural Intention with an evaluation
located between 3 and 4 points. For example, nurse
M (blue) answered 35 % of the questions with 4
points. At same time is possible observe that only
35% of the nurses answered questions with 1 point.
Table 11: Results correlation coefficient Kendall's tau
(BI).
Figure 5: Histogram (BI).
4.1.5 Analysis of Use Behaviour
Through a brief analysis of Table 12, it was found
that the average of responses/evaluations in this
construct was approximately around three points.
Standard deviation (STD error) is not dispersed.
Table 12: Results of univariate analysis (UB).
Table 13: Results of the correlation coefficient Kendall's
tau (UB).
ICEIS2013-15thInternationalConferenceonEnterpriseInformationSystems
182
In Table 13 nurse G and H showed a bigger
divergence of responses, since values were very
close to -1. However, the nurse A showed a lower
divergence with a correlation coefficient near to 1.
Histogram of Figure 6 indicates that the most
respondents answered 47 questions related to the
construct Use Behaviour
5 DISCUSSION
The obtained results show that the respondents are in
accordance with the most of the questions. The
majority of the questions were evaluated with three
or four points.
Figure 6: Histogram (UB).
Table 14: Top 3 questions with the highest and lowest
evaluation.
Highest Evaluation Lowest Evaluation
Construct Question Mode Avg Question Mode Avg
PU
2.11.1
2.11.1.1
2.11.3
4
4
4
4,15
4,15
3,92
2.1.9
2.2.2
2.4.21
3
2
3
2,38
2,46
2,54
PEOU
2.4.1
2.11.1
2.11.1.1
4
4
4
4,08
4,15
4,15
2.1.9
2.4.21
2.4.22
3
3
4
2,38
2,54
2,61
BI
2.11.1
2.11.1.1
2.11.3
4
4
4
4,15
4,15
3,92
2.1.9
2.3.2
2.3.3
3
2
3
2,38
2,31
2,38
UB
2.10.1.2
2.10.1.4
2.11.3
4
4
4
3,77
3,69
3,92
2.1.9
2.2.2
2.3.2
3
2
2
2,38
2,46
2,31
To achieve the objectives originally proposed, a
questionnaire was considered based on the four
constructs (all areas) of TAM 3. The questionnaires
addressed all the components (system features)
exploited by the user in the ICU. The constructs with
the biggest acceptance degree were studied by
question and by each construct. For a better
understanding of the results (Table 14), a selection
was made on the three questions (Table 15)
associated to the higher valuation (best results) and
the three that presented the lowest valuation (worst
results). Table 16 shows that the greater acceptance
was the construct PEOU with an average of 3.45. At
the opposite side is the Using Behaviour with an
average of 3.23.
Table 15: ID and questions.
ID Question
2.1.9
Can help to mitigate situations of an excessive
workload?
2.10.1.2 Utility of GLASGOW CHART?
2.10.1.4
The graphics can help to a better understanding
of the real patient’s condition?
2.11.1 Utility of Information?
2.11.1.1
Utility of consulting information (hourly, daily,
continuous)?
2.11.3 Global evaluation of the vital signs?
2.2.2 Can access to information quickly?
2.3.2
Do you think that other nurses should use the
system as well?
2.3.3
Other professional colleagues think that you
should use the system?
2.4.1 Monitoring of the patient?
2.4.21 The Balance is done correctly?
2.4.22 Evaluation of Performance (speed)?
Table 16: Global Analysis for each construct.
Constructs Mode Average
PU 3 3,34
PEOU 4 3,45
BI 3 3,34
UB 3 3,23
For a best visualization, was also made a global
analysis on all the questions in the questionnaire
(91). The tables 17 and 18 present the three
questions with highest and lowest evaluations.
Table 17: Three questions with the highest evaluation.
Mode Avg
2.4.1 – Monitoring of Patient 4 4,08
2.11.1 – Utility of Information 4 4,15
2.11.1.1 – Utility of Consulting 4 4,15
Table 18: Three questions with the lowest evaluation.
Question Mode Avg
2.1.9 – Can help to mitigate situations of a
n
excessive workload?
3 2,38
2.2.2 – Can access to information quickl
y
2 2,46
2.3.2 – Do you think that other nurses shoul
d
use the system as well?
2 2,31
After an analysis of each construct, it was
performed a global analysis of all the responses
given by all the respondents. The answers presented
an average value of 3.40.
In general, the nurses are satisfied with the ease
of use of the technology. However, an obstacle is
limiting a wider acceptance of the system INTCare:
the operating speed of the user interface. This
PervasiveInformationSystemstoIntensiveCareMedicine-TechnologyAcceptanceModel
183

implies an upgrade of the workstations in terms of
RAM in the UCI. Another problem remains: the
most part of nurses have no time available to operate
with the information system.
6 CONCLUSIONS
The use of Technology Acceptance Model (TAM 3)
combined with Delphi method to evaluate the
acceptance by users, in order to understand their
perceptions and impact on the behaviour of the
system INTCare utility, is totally new. A set of
questionnaires based on the four constructs have
been answered by the nurses. In order to get a good
understand of the technology acceptance by the
users a set of analysis of the results (average, mode,
Kendall, better and worst features) were performed
having in consideration the TAM 3 methodology.
Certain limitations persist in the data access, due to
constant complaints from nurses regarding the speed
of system. The acceptance of the technology by the
nurses was very positive (between 3-4 points) for the
four constructs evaluated (Perceived Usefulness,
Perceived Ease of Use, Behavioural Intention and
Use Behaviour).
In the future, the results will be used to: improve
de system, mitigate some reported problems and add
some new features. Then, will be performed another
round of questionnaires, in order to understand if
there was some improved to the user at level of
TAM constructs.
ACKNOWLEDGEMENTS
This work is supported by FEDER through
Operational Program for Competitiveness Factors –
COMPETE and by national funds though FCT –
Fundação para a Ciência e Tecnologia in the scope
of the project: FCOMP-01-0124-FEDER-022674.
The authors would like to thank FCT
(Foundation of Science and Technology, Portugal)
for the financial support through the contract
PTDC/EIA/72819/ 2006 (INTCare) and PTDC/EEI-
SII/1302/2012 (INTCare II). The work of Filipe
Portela was supported by the grant
SFRH/BD/70156/2010 from FCT.
REFERENCES
Bolboaca, S. D., & Jantschi, L., (2006). Pearson versus
Spearman, Kendall's tau correlation analysis on
structure-activity relationships of biologic active
compounds. Leonardo Journal of Sciences, 5(9), 179-
200.
Chooprayoon, V., & Fung, C. C., (2010). TECTAM: An
Approach to Study Technology Acceptance Model
(TAM) in Gaining Knowledge on the Adoption and
Use of E-Commerce/E-Business Technology among
Small and Medium Enterprises in Thailand.
Gago, P., Santos, M. F., Silva, Á., Cortez, P., Neves, J., &
Gomes, L., (2006). INTCare: a knowledge discovery
based intelligent decision support system for intensive
care medicine. Journal of Decision Systems.
Hammer, Ø., Harper, D. A. T., & Ryan, P. D., (2001).
PAST-Palaeontological statistics. www. uv. es/~
pardomv/pe/2001_1/past/pastprog/past. pdf, acessado
em, 25(07), 2009.
Johns, R., (2010). Likert Items and Scales. Survey
Question Bank: Methods Fact Sheet, 1.
Orwat, C., Graefe, A., & Faulwasser, T., (2008). Towards
pervasive computing in health care - A literature
review. [10.1186/1472-6947-8-26]. BMC Medical
Informatics and Decision Making, 8(1), 26.
Portela, F., Santos, M., Vilas-Boas, M., Rua, F., Silva, Á.,
& Neves, J., (2010). Real-time Intelligent decision
support in intensive medicine. Paper presented at the
KMIS 2010- International Conference on Knowledge
Management and Information Sharing.
Portela, F., Santos, M. F., Silva, Á., Machado, J., &
Abelha, A., (2011). Enabling a Pervasive approach
for Intelligent Decision Support in Critical Health
Care. Paper presented at the HCist 2011 –
International Workshop on Health and Social Care
Information Systems and Technologies.
Saha, D., & Mukherjee, A., (2003). Pervasive computing:
a paradigm for the 21st century.
[10.1109/MC.2003.1185214]. IEEE Computer, 36(3),
25-31.
Santos, L. D. d., & Amaral, L. (2004). Estudos Delphi
com Q-Sort sobre a web: a sua utilização em sistemas
de informação.
Santos, M. F., Portela, F., Vilas-Boas, M., Machado, J.,
Abelha, A., & Neves, J., (2011). INTCARE - Multi-
agent approach for real-time Intelligent Decision
Support in Intensive Medicine. Paper presented at the
3rd International Conference on Agents and Artificial
Intelligence (ICAART), Rome, Italy.
Varshney, U., (2009). Pervasive Healthcare Computing:
EMR/EHR, Wireless and Health Monitoring:
Springer-Verlag New York Inc.
Venkatesh, V., & Bala, H., (2008). Technology acceptance
model 3 and a research agenda on interventions.
Decision Sciences, 39(2), 273-315.
Venkatesh, V., & Davis, F. D., (2000). A theoretical
extension of the technology acceptance model: Four
longitudinal field studies. Management science, 186-
204.
Zackiewicz, M., & Salles Filho, S., (2010). Technological
Foresight–Um instrumento para política científica e
tecnológica. Parcerias estratégicas, 6(10).
ICEIS2013-15thInternationalConferenceonEnterpriseInformationSystems
184
