
Experimental Selection and Verification of Maximum-Heart-Rate
Formulas for Use with Karvonen Formula
∗
Jinhua She
1,4
, Hitoshi Nakamura
1
, Koji Makino
2
, Yasuhiro Ohyama
1
,
Hiroshi Hashimoto
3
and Min Wu
4
1
Graduate School of Bionics, Computer and Media Sciences, Tokyo University of Technology,
1404-1 Katakura, Hachioji, Tokyo 192-0982, Japan
2
Interdisciplinary Graduate School of Medical and Engineering, University of Yamanashi,
4-3-11, Takeda, Kofu 400-8511, Japan
3
Master Program of Innovation for Design and Engineering, Advanced Institute of Industrial Technology,
Shinagawa, Tokyo 140-0011, Japan
4
School of Information Science and Engineering, Central South University, Changsha 410083, China
Keywords:
Borg CR10 Scale, Correlation Analysis, Karvonen Formula, Exercise Intensity, Maximum Heart Rate (MHR),
Measure Of Exercise Intensity, Pedaling, Statistical Analysis.
Abstract:
Maximum heart rate (MHR) is commonly used to estimate exercise intensity with the Karvonen formula, and
there are several methods of calculating it. In this study, we used pedaling experiments on a cycle ergometer to
evaluate methods of determining MHR in order to select the ones most suitable for the Karvonen formula. In
the experiments, 43 subjects rode an aerobike. The results show that, for people in their 20s, two methods are
suitable for estimating exercise intensity with the Karvonen formula. The main physical parameters affecting
exercise intensity were also extracted, based on the experimental results.
1 INTRODUCTION
The Karvonen formula is a common measure of exer-
cise intensity. It is given by (Karvonen et al., 1957;
Hill et al., 2005)
%HRR =
HR− HR
r
HR
max
− HR
r
× 100%, (1)
where HR is the measured heart rate; HR
max
is the
maximum heart rate; HR
r
is the heart rate at rest; and
%HRR is the heart rate reserve, which is used to de-
termine exercise intensity.
Heart rate is easy to measure with a small instru-
ment. This is why the Karvonen formula is widely
used in the fields of rehabilitation and physical train-
ing. One of the variables in the Karvonen formula,
(1), is HR
max
, which is the heart rate a person has
when he pushes his body to the limit. Since directly
measuring HR
max
not only takes a great deal of time,
∗
This work was supported by Health Science Center
Foundation, Japan, JSPS KAKENHI under Grant-in-Aid
for Scientific Research (B) 25280125, and the National Nat-
ural Science Foundation of China under Grant 61210011.
but also imposes a heavy physical burden on the sub-
ject, as a convenience, one way of calculating it is
based on the age of the subject (Robert and Landwehr,
2002):
HR
max
= 220− age. (2)
This is extensively used nowadays (Young-
McCaughan and Arzola, 2007; Shenoy et al.,
2010; Perez-Terzic, 2012).
However, (Robert and Landwehr, 2002) pointed
out that (2) does not always yield the correct HR
max
of
a subject. Although several methods have been pro-
posed to improvethe accuracy, none of them is widely
recognized; and their range and conditions of use are
not clear.
The aim of this study was to select the meth-
ods of calculating the HR
max
of a person pedaling
a cycle ergometer that are suitable for use with the
Karvonen formula. We collected data on subjects’
heart rate while they were pedaling under various
loads, and data on subjects’ rating of perceived exer-
tion (RPE) from questionnaires given before and after
each pedaling experiment. Then, based on a compar-
ison of the data from the experiments and question-
536
She J., Nakamura H., Makino K., Ohyama Y., Hashimoto H. and Wu M..
Experimental Selection and Verification of Maximum-Heart-Rate Formulas for Use with Karvonen Formula.
DOI: 10.5220/0004426905360541
In Proceedings of the 10th International Conference on Informatics in Control, Automation and Robotics (ICINCO-2013), pages 536-541
ISBN: 978-989-8565-71-6
Copyright
c
2013 SCITEPRESS (Science and Technology Publications, Lda.)

0
0.5
1
2 3 4 5
6
7 8
9
10
Nothing at all
Extremely weak
Ve ry weak
Weak
Moderate
Strong
Ve ry strong
Extremely strong
Reinforced training
of athletes
Maintaining/improving
physical strength
Light house
work
Wal king
Seating or
standing
calmly
Figure 1: Borg CR10 scale.
naires, we chose the most appropriate methods of cal-
culating HR
max
. To ensure accuracy, we performed
two kinds of pedaling experiments: an all-in-one-day
(AIOD) experiment that tested all pedaling loads in
one day, and a one-load-per-day (OLPD) experiment
that tested one load per day for several days. Then,
we examined the differences in exercise intensity be-
tween these two kinds of experiments. Finally, based
on the experimental and questionnaire data, we ex-
tracted the physical parameters that have the greatest
impact on exercise intensity.
2 EXERCISE INTENSITY
AND HR
max
Exercise intensity indicates the degree of difficulty of
exercise. The RPE is commonly used to obtain a sub-
ject’s impression of the difficulty, and the Borg CR10
scale (Borg, 1998) (Fig. 1) is used as a measure of
RPE. The value is in the range [0, 10], with larger
values indicating greater intensity.
This study focused on the Karvonen formula, (1),
in which %HRR is in the range [0, 100] and it is pro-
portional to a value on the Borg CR10 scale, B
10
:
HRR = 10× B
10
. (3)
HR
max
in the Karvonen formula is often calcu-
lated using (2). However, questions have arisen con-
cerning the accuracy of the HR
max
given by (2).
Robert and Landwehr verified the original data used
to obtain (2) and pointed out that it was possible that
(2) might not give the correct HR
max
(Robert and
Landwehr, 2002). A large number of studies have
attempted to improve (2). Inbar et al., for example,
had 1424 healthy perform treadmill exercises. They
clarified that HR
max
of a person decreases by 0.685
bpm per year due to aging, and proposed the follow-
ing method of calculating HR
max
(Inbar et al., 1994):
HR
max
= 205.8− 0.685× age. (4)
Miller et al. showed the equation
HR
max
= 217− 0.85 × age (5)
based on exercise by 86 obese and 51 normal-weight
adults (Miller et al., 1993). Tanaka et al. examined
351 samples involving 492 groups and 18712 subjects
and came up with (Tanaka et al., 2001)
HR
max
= 208− 0.7× age. (6)
Gulati et al. speculated that HR
max
should be differ-
ent for men and women. They carried out exercise
tests on 5437 asymptomatic women and came up with
(Gulati et al., 2010)
HR
max
= 206− 0.88 × age. (7)
Londeree and Moeschberge pointed out that (1) does
not account for a person’s physical characteristics
(weight, height, etc.) and thus may not yield the cor-
rect HR
max
. Taking age, sex, load level, and other
factors into consideration in calculating HR
max
, they
obtained
HR
max
= 206.3− 0.711× age (8)
based on data collected from world-class athletes
(Londeree and Moeschberger, 1982).
Although there are many methods of calculating
HR
max
, we need to determine which among them are
suitable for calculating exercise intensity for use in
the Karvonen formula. This study employed a ped-
aling exercise on a cycle ergometer to achieve two
goals:
1) to compare (2) and (4) ∼ (8), and find the ones
most suitable for calculating exercise intensity;
and
2) to select the physical parameters that are strongly
related to exercise intensity.
3 PEDALING EXERCISE
AND ANALYSIS
This section explains the pedaling exercises used in
this study and presents an analysis of the data ob-
tained.
3.1 Experiments
In this study, we used a cycle ergometer (Pro-
grammable Ergometer AFB6008; Alinco, Inc.) for
pedaling experiments and a photoelectric pulsome-
ter (Pulse Coach Neo HR-40; Japan Precision Instru-
ments, Inc.) to record the pulse during the experi-
ments (Fig. 2). Note that a pulse rate is the same as
the heart rate for healthy people. All the experiments
were carried out in our laboratory.
ExperimentalSelectionandVerificationofMaximum-Heart-RateFormulasforUsewithKarvonenFormula
537
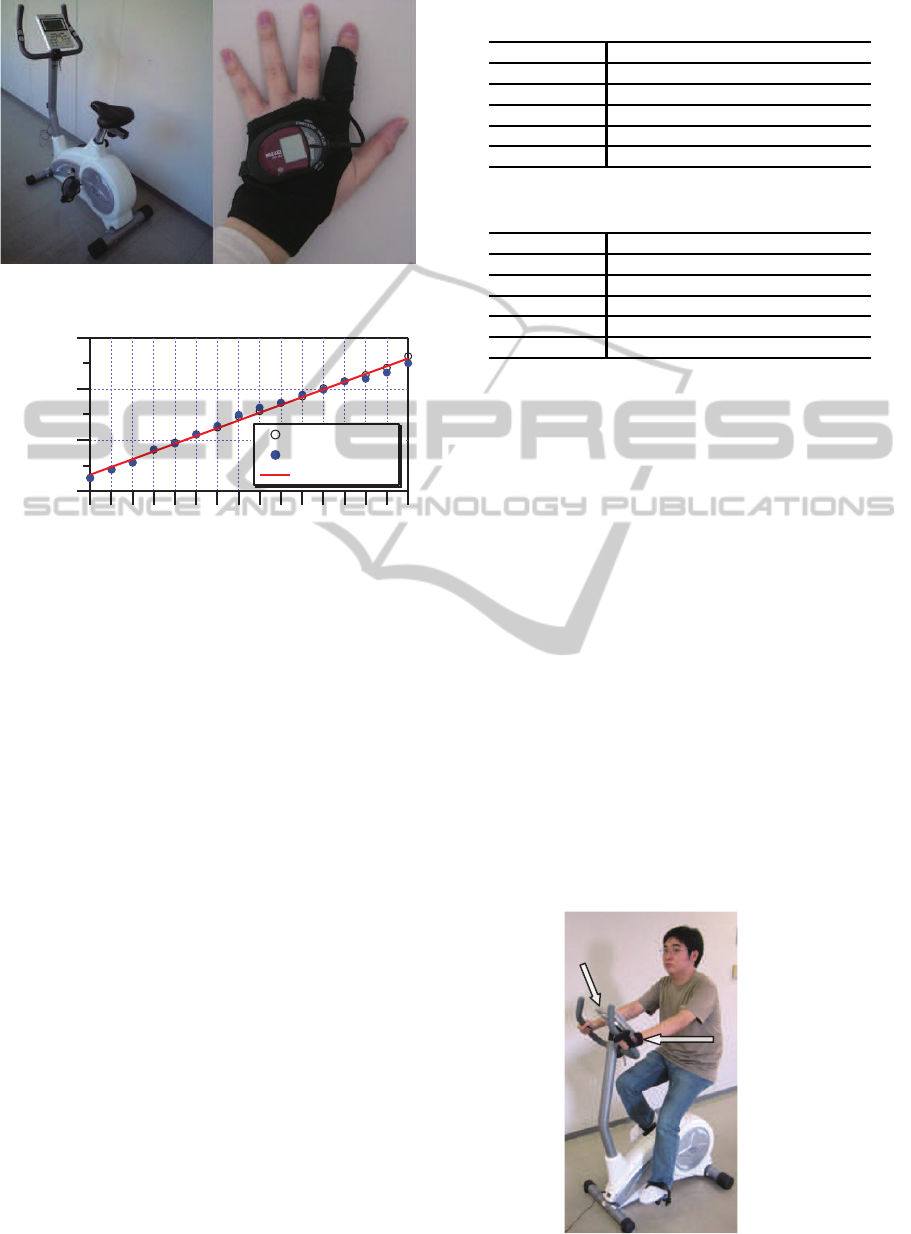
Figure 2: Left: Programmable ergometer, AFB6008. Right:
Photoelectric pulsometer, Pulse Coach Neo HR-40.
300
200
100
0
Work load [W]
16151413121110987654321
Pedaling load
Subject 1
Subject 2
Regression line
Figure 3: Work load vs. pedaling load.
The ergometer can be set to any of 16 pedaling
loads (1 ∼ 16) by pushing up or down buttons. It is
necessary to identify the relationship between pedal-
ing load and actual work load so that readers can un-
derstand what a particular pedaling load means. Thus,
prior to the pedaling experiments, we performed pre-
liminary experiments on pedaling load in which two
subjects (age: 22 years old; sex: male; health: good)
pedaled the ergometer for 5 minutes at a speed of
about 60 rpm. The experimental results (Fig. 3) show
that the work load increases 15 W for every unit in-
crease in pedaling load.
In the main pedaling experiments, due to fatigue
and scheduling considerations, subjects were only
tested at eight of the sixteen load levels: 1, 3, 5, 7,
9, 11, 13, and 15.
Our daily experience tells us that fatigue influ-
ences exercise intensity. We examined this issue
through two kinds of experiments: AIOD and OLPD.
An AIOD experiment tested all eight pedaling loads
in one day, and an OLPD experiment tested one load
per day for eight days. 43 subjects (university stu-
dents; age: 20s; sex: male; health: good) took part in
the AIOD experiment, and 7 of them also took part in
the OLPD experiment. In Tables 1 and 2, SD means
standard deviation.
The procedures for the two types of experiments
are given below.
Table 1: 43 Subjects for AIOD experiment.
Max Min Avg. SD
Age [yrs.] 20.0 29.0 23.5 2.7
Height [cm] 158.0 185.0 172.1 6.0
Weight [kg] 43.0 92.0 66.4 12.1
HR
r
[bpm] 63.8 99.8 79.5 10.4
Health Good Good Good Good
Table 2: 7 Subjects for OLPD experiment.
Max Min Avg. SD
Age [yrs.] 21.0 22.0 21.3 0.5
Height [cm] 158.0 178.0 169.3 8.2
Weight [kg] 49.0 76.0 61.6 11.2
HR
r
[bpm] 66.0 97.6 82.3 11.4
Health Good Good Good Good
AIOD Experiment:
Step 1) Set the sampling time for the measurement
of pulse to 4 s.
Step 2) Before the experiment, give the subject a
questionnaire to collect data on physical charac-
teristics.
Step 3) Measure the pulse at rest for 1 minute and
repeat the measurements 5 times.
Step 4) Set the load of the ergometer to Level 1.
Step 5) Have the subject pedal the ergometer at a
speed of about 60 rpm for 5 minutes, and record
the pulse (Fig. 4).
Step 6) After the experiment ,use a questionnaire to
collect data on perceived exercise intensity (PEI).
Give the subject a 5-min rest and then record the
pulse.
Step 7) Increase the load level by 2 and go to Step 5.
Repeat Steps 5-7 up to the maximum load or until
Pulsometer
Monitor
Figure 4: Photograph of experiment in progress.
ICINCO2013-10thInternationalConferenceonInformaticsinControl,AutomationandRobotics
538
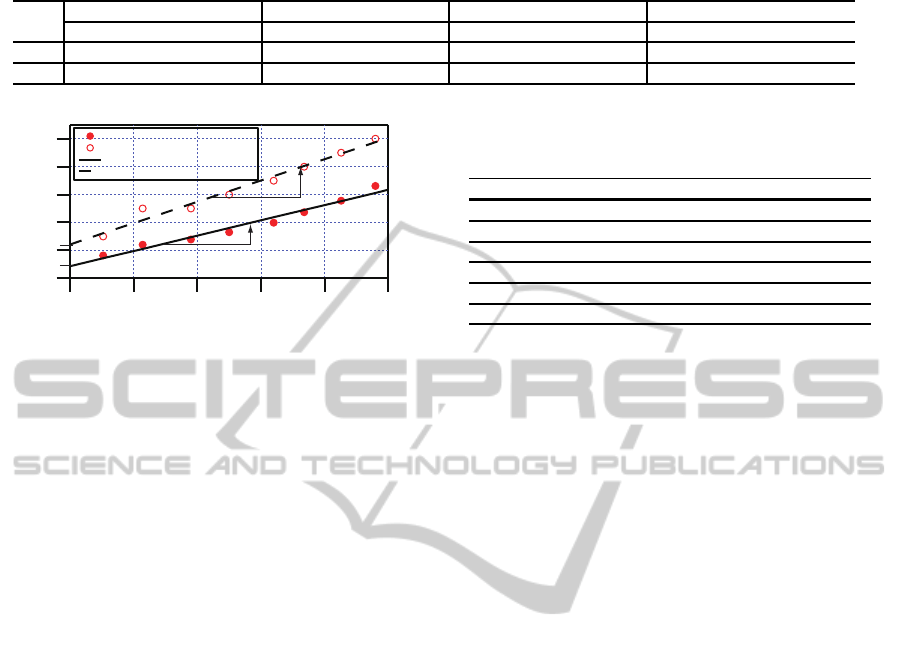
Table 3: Mean and standard deviation of parameters for exercise intensity for AIOD and OLPD experiments.
a
c
b
c
a
s
b
s
AIOD OLPD Diff. AIOD OLPD Diff. AIOD OLPD Diff. AIOD OLPD Diff.
Avg. 0.2971 0.3014 −0.0043 1.3200 0.2529 1.0671 0.2486 0.2529 −0.0043 25.5871 17.0414 8.5457
SD 0.0767 0.0941 0.0675 5.0656 0.0791 5.1292 0.0982 0.0791 0.1180 10.4570 7.4991 12.2008
100
80
60
40
20
0
Exercise intensity [%]
250200150100500
Work load [W]
: Measured
: Questionnaire
: Measured (Regression line)
: Questionnaire (Regression line)
a
c
a
p
b
c
b
p
Figure 5: Slope of exercise intensity and intercept.
the subject feels that he has reached the limits of
his strength.
The post-experiment questionnaire asks a subject to
choose an appropriate level on the Borg CR10 scale.
This is taken to be his RPE. In addition, the heart rate
for the highest load is assumed to be the highest heart
rate in the experiment and is denoted HR
m
.
OLPD experiment:
Step 1) Give the subject a questionnaire before the
experiment.
Step 2) Set the load of the ergometer to Level 1 on
the first day and increase the load level by 2 on
each succeeding day (2nd day: Level 3, 3rd day:
Level 5, etc.)
Step 3) Have the subject pedal the ergometer at a
speed of 60 rpm for 5 minutes and record the
pulse.
Step 4) Give the subject a questionnaire after the ex-
periment to obtain the perceived exercise inten-
sity. This is the end of the experiment for that
day.
Step 5) Repeat Steps 1-4 for 8 days or until the sub-
ject feels that he has reached the limits of his
strength.
We call the exercise intensity calculated from the
Karvonen formula plus the experimental data the cal-
culated exercise intensity (CEI), and we call the value
obtained from the questionnaire the PEI. We per-
formed a least-squares analysis of the CEI and PEI
and examined the relationship between exercise in-
tensity and work load. Two parameters are used to
describe the relationship between CEI (or PEI) and
work load (Fig. 5): the slope, a
c
(or a
p
), and the ordi-
nate intercept, b
c
(or b
p
).
Table 4: Mean and standard deviation of (a
c
− a
p
) for
HR
max
methods.
HR
max
formulas Avg. SD
Eq.(2): HR
max
= 220− age 0.0126 0.0176
Eq.(4): HR
max
= 205.8− 0.685× age 0.0152 0.0228
Eq.(5): HR
max
= 217− 0.85× age 0.0124 0.0176
Eq.(6): HR
max
= 208− 0.7× age 0.0148 0.0212
Eq.(7): HR
max
= 206− 0.88× age 0.0174 0.0256
Eq.(8): HR
max
= 206.3− 0.711× age 0.0152 0.0228
3.2 Analysis of Experimental Data
First, we compared the AIOD and OLPD results to
determine the effect of fatigue on exercise intensity.
We identified the parameters a
c
and b
c
, and a
p
and b
p
for both AIOD and OLPD using the HR
max
calculated
from (2). These 4 parameters were calculated for each
subject for the AIOD and the OLPD experiments. A
t-test on the differences between the parameters for
AIOD and OLPD showed that, at a significance of
5%, there was no significant difference in exercise in-
tensity between the two types of experiments. And a
comparison of the parameters for AIOD and OLPD
(Table 3)) reveals the differences to be very small.
Thus, we can conclude that the effect of fatigue on
exercise intensity is very small for our pedaling ex-
periments in the range of work loads we used, and that
the OLPD experiment is unnecessary for this study.
Next, we used the AIOD experiment to select ap-
propriate methods of calculating HR
max
. Two crite-
ria for the selection were examined: (a
c
− a
s
) and
(b
c
− b
s
). A variance analysis of these two variables
showed that they resulted in the selection of the same
methods. So, we used only (a
c
− a
s
) and carried out
the selection as follows:
Procedure for Selecting Methods of calculating
HR
max
:
Step 1) Calculate HR
max
using (2) for Subject 1.
Step 2) Calculate a
c
using the HR
max
obtained in
Step 1, and calculate a
p
for Subject 1.
Step 3) Calculate (a
c
− a
p
) and (a
c
− a
p
)
2
.
Step 4) Do Steps 1-3 for all the subjects, and calcu-
late the mean value of (a
c
− a
p
)
2
.
Step 5) Do Steps 1-4 using (4) ∼ (7) one by one.
ExperimentalSelectionandVerificationofMaximum-Heart-RateFormulasforUsewithKarvonenFormula
539
0.6
0.5
0.4
0.3
0.2
0.1
0.0
a
c
200180160140120
HR
m
Figure 6: CEI slope vs. maximum measured heart rate.
0.6
0.5
0.4
0.3
0.2
0.1
0.0
a
c
353025201510
BMI
Figure 7: CEI slope vs. BMI.
Step 6) Analyze the variance of the mean values of
(a
c
− a
p
)
2
, and assess the suitableness of using
the formulas to calculate HR
max
.
Analysis of the data shows that, at a significance
level of 5%, there is no significant difference for any
(a
c
− a
p
)
2
, and that (2) and (5) give the smallest
(a
c
− a
p
)
2
among these 6 methods. Thus, (2) and (5)
are the most suitable methods of calculating exercise
intensity for males in their 20s (Table 4).
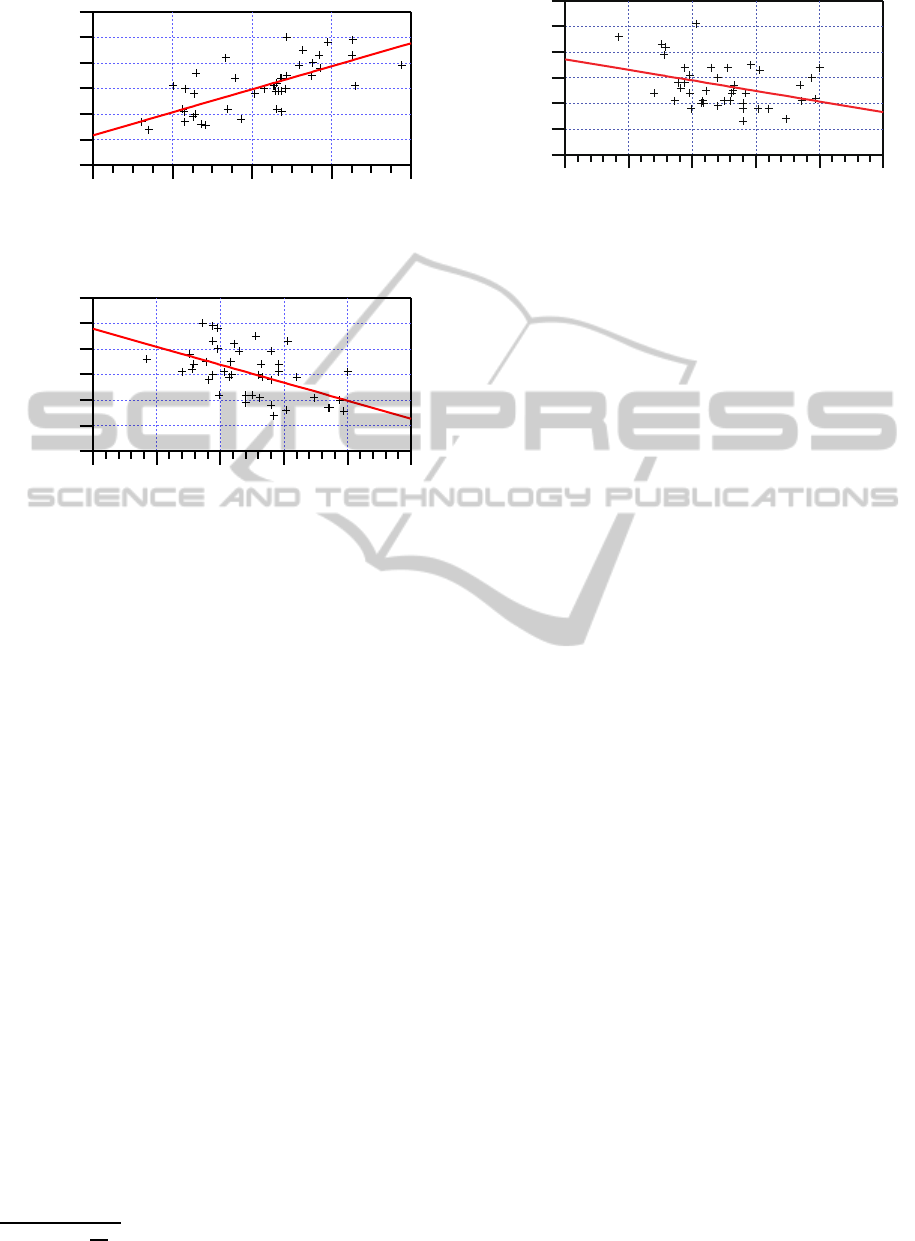
In this study, we also examined the relationships
between exercise intensity and the following physical
parameters of the subjects: height (H [m]), weight (W
[kg]), hours of sleep (HS [h]), heart rate at rest [bpm],
and BMI
2
(body mass index).
The parameters for excise intensity are a
p
and b
p
for PEI, a
c
and b
c
for CEI, HR
m
, (HR
m
− HRR), (a
c
−
a
p
)
2
, and (b
c
− b
p
)
2
.
We calculated the correlation coefficients for each
pair of the 13 parameters, and selected the coupled
items to a
c
, b
c
, a
p
, and b
p
as follows (Table 5).
• a
c
: HR
m
(0.698), b
c
(−0.544), BMI (−0.526),
(b
c
− b
p
)
2
(−0.514), W (−0.408), and
HR
r
(0.382).
• b
c
: (b
c
− b
p
)
2
(0.691) and HR
r
(−0.350).
• a
p
: b
p
(−0.601) and BMI (−0.353).
2
BMI =
W
H
2
.
0.6
0.5
0.4
0.3
0.2
0.1
0.0
a
p
353025201510
BMI
Figure 8: PEI slope vs. BMI.
• b
p
: (b
c
− b
p
)
2
(−0.624).
Some relationships are illustrated in Figs. 6-8.
Figure 6 shows that, when HR
m
is large, a
c
is large.
So, the CEI is more sensitive to an increase in work
load if a person can endure a larger HR
m
during ex-
ercise. Figure 7 shows that a
c
decreases as BMI in-
creases. This means that, if the BMI of a person is
large, he will not be very sensitive to an increase in
the work load. Figure 8 also shows the same tendency
in the relationship between a
p
and BMI.
Since BMI gives an influence on both of a
c
and a
p
,
incorporating this parameter in the Karvonen Formula
has potential for the adaptation of it to an individual.
4 CONCLUSIONS
In this study, we selected the most suitable methods
of calculating HR
max
for use in the Karvonen formula,
which yields an estimate of exerciseintensity. We em-
ployed two kinds of pedaling experiments: AIOD and
OLPD. Based on the results of experiments and ques-
tionnaires on fifteen subjects in their 20s, we selected
the most suitable methods of calculating HR
max
and
extracted physical parameters that are strongly related
to exercise intensity. The following points were clari-
fied:
1. At a significance level of 5%, there is no signif-
icant difference between the results of the AIOD
and OLPD experiments. Thus, the OLPD exper-
iment is unnecessary for the work loads used in
these experiments; the AIOD experiment alone is
sufficient.
2. Among the 6 methods of calculating HR
max
that
were tested, (2) and (5) were found to be the most
suitable for male university students in their 20s.
3. Incorporating BMI in the Karvonen formula may
adapt it to an individual.
How to modify the Karvonen formula by incorpo-
rating BMI into it so as to adapt it to an individual is
ICINCO2013-10thInternationalConferenceonInformaticsinControl,AutomationandRobotics
540

Table 5: Correlation coefficients for exercise intensity vs. physical parameters (“**”: ρ < 0.01 and “*”: ρ < 0.05).
b
c
a
s
b
s
H W HS HR
r
HR
m
HR
m
− HRR (a
c
− a
s
)
2
(b
c
− b
s
)
2
BMI
a
c
−0.544 0.322 0.117 0.146 −0.408
∗∗
0.097 0.382
∗
0.698
∗∗
0.410
∗∗
0.573
∗∗
−0.514
∗∗
−0.526
∗∗
b
c
— −0.285 0.134 −0.259 −0.045 −0.315
∗
−0.350
∗
−0.174 0.060 −0.180 0.691
∗∗
0.067
a
s
— — −0.601
∗∗
0.123 −0.272 0.273 0.145 −0.077 −0.165 −0.100 0.214 −0.353
∗
b
s
— — — −0.031 −0.088 −0.116 0.135 0.249 0.148 0.293 −0.624
∗∗
−0.089
H — — — — 0.432
∗∗
0.112 0.202 0.136 −0.001 −0.014 −0.182 0.054
W — — — — — 0.215 0.045 −0.132 −0.153 −0.178 0.029 0.922
∗∗
HS — — — — — — 0.091 0.094 0.029 −0.167 −0.164 0.183
HR
r
— — — — — — — 0.243 −0.413 0.169 −0.374 −0.053
HR
m
— — — — — — — — 0.784
∗∗
0.351
∗
−0.319
∗
−0.224
HR
m
− HRR — — — — — — — — — 0.222 −0.060 −0.177
(a
c
− a
s
)
2
— — — — — — — — — — −0.356
∗
−0.197
(b
c
− b
s
)
2
— — — — — — — — — — — 0.118
a very important issue, and it will be examined in the
near future.
REFERENCES
Borg, G. (1998). Borg’s perceived exertion and pain scales.
Human Kinetics, Champaigne.
Gulati, M., Shaw, L. J., Thisted, R. A., Black, H. R., Merz,
C. N. B., and Arnsdorf, M. F. (2010). Heart rate
response to exercise stress testing in asymptomatic
women. Circulation, 122:130–137.
Hill, D. C., Ethans, K. D., Macleod, D. A., and Harrison,
D. R. (2005). Exercise stress testing in subacute stroke
patients using a combined upper- and lower-limb er-
gometer. Arch. Phys. Med. Rehabil., 86:1860–1866.
Inbar, O., Oten, A., Scheinowitz, M., Rotstein, A., Dlin, R.,
R., and Casaburi, R. (1994). Normal cardiopulmonary
responses during incremental exercise in 20-70-yr-old
men. Medicine and Science in Sports and Exercise,
26:538–546.
Karvonen, M. J., Kentala, E., and Mustala, O. (1957). The
effects of training on heart rate: a longitudinal study.
Ann. Med. Exp. Biol. Fenn., 35:307–315.
Londeree, B. R. and Moeschberger, M. L. (1982). Effect of
age and other factors on maximal heart rate. Research
Quarterly for Exercise and Sport, 53:297–304.
Miller, W. C., Wallace, J. P., and Eggert, K. E. (1993). Pre-
dicting max hr and the hr-vo2 relationship for exer-
cise prescription in obesity. Medicine and Science in
Sports and Exercise, 25:1077–1081.
Perez-Terzic, C. M. (2012). Exercise in cardiovascular dis-
eases. PM & R, 4:867–873.
Robert, R. A. and Landwehr, R. (2002). The surprising his-
tory of the “HRmax=220-age” equation. Journal of
Exercise Physiologyonline, 5:1–10.
Shenoy, S., Guglani, R., and Sandhu, J. S. (2010). Effective-
ness of an aerobic walking program using heart rate
monitor and pedometer on the parameters of diabetes
control in asian indians with type 2 diabetes. Primary
Care Diabetes, 4:41–45.
Tanaka, H., Monahan, K. D., and Seals, D. R. (2001). Age-
predicted maximal heart rate revisited. Journal of the
American College of Cardiology, 37:153–156.
Young-McCaughan, S. and Arzola, S. M. (2007). Exercise
intervention research for patients with cancer on treat-
ment. Seminars in Oncology Nursing, 23:264–274.
ExperimentalSelectionandVerificationofMaximum-Heart-RateFormulasforUsewithKarvonenFormula
541
