
A Concept of the Real-time Diagnostic System for Prototype Engines
Architecture and Algorithm
Vitaly Promyslov and Stanislav Masolkin
V. A. Trapeznikov Institute of Control Sciences, 65 Profsoyuznaya, Moscow 117997, Russia
Keywords: Modeling, Diagnostic, Real Time, SVM, Software Architecture.
Abstract: The paper summarizes the main ideas and methods used in a software design of the real time diagnostic
system for an advanced engines prototype test bed. The software architecture of the diagnostic systems is
built on a top of the multiprocessor computer system which allows affectively performs various tasks. The
SVM (support vector machine) algorithm is discussed from a point of view its real time implementation.
The simulation results are presented and discussed.
1 INTRODUCTION
Modeling offers a way to automation of the anomaly
diagnosis in the behavior of complex technical
systems during tests. This method transforms
knowledge into a model used for automatic detection
of abnormalities. By the behavior abnormality is
meant any change in the diagnostic information
arriving from the plant and regarded as significant
for the diagnostic system independently of its
causes. Analysis of the causes of abnormal behavior
lies outside the scope of the present paper. For
diagnosis of the abnormal behavior of the pilot
plants such as high-powered engines or experimental
machines, direct transformation of knowledge about
the tested plant into a physical model or expert
conclusions is not necessarily possible. This is due
to complexity and insufficient examination of the
tested plant or classification of information by the
designer for reasons of confidentiality. However,
importance of the timely detection of behavior
abnormalities is evident because it allows one to
minimize the losses of plant destruction and
simplify the post-emergency situation analysis. That
is why the designers of the diagnostic systems of
such plants make emphasis on the diagnosis of
abnormalities by the information-oriented method
which is aimed at constructing the anomaly
detection model relying on the data acquired in the
course of operation, rather than on the expertise. The
information-oriented algorithms for anomaly
detection, which are also known as those of outlier
detection, attempt to identify the portion of data
which differs somehow (is abnormal) for the given
data collection. The readers are referred to
(Chandola et al., 2009); (Markou and Singh,
2003a,); (Markou and Singh, 2003b) for review and
analysis of the abnormality detection algorithms. All
such algorithms need learning data consisting of a
set of the examples of anomalies and a set of
examples of normal (or nominal) data. Using the
learning data, the algorithm trains the model which
is used to verify the hypothesis of nominality and
abnormality of the tested data.
In our opinion, the need for diagnostic system
(DS) to operate at the rate of plant events, that is, in
real time and with the time of response smaller than
the characteristic time of development of the
unfavorable situation, is an essential restriction. For
the engines under examination, this time is about
tens of ms. The resource and time constraints
appreciably restrict the set of realizable algorithms,
as well as increase the role of the technical solutions
used such as system architecture or software and
hardware facilities used to realize the diagnostic
system.
We considered the support vector machines
(Vapnik, 1995) as an algorithm to construct the
information-oriented model. The support vector
algorithm is realized with the use of the free library
(SVM) (Chang and Lin, 1997) that was already used
to solve a similar problem of diagnosis of complex
experimental plants (Iverson et al., 2009),
(Schwabacher et al., 2009), (Jeong et al., 2012),
(Kang et al., 2012).
360
Promyslov V. and Masolkin S..
A Concept of the Real-time Diagnostic System for Prototype Engines - Architecture and Algorithm.
DOI: 10.5220/0004426703600365
In Proceedings of the 10th International Conference on Informatics in Control, Automation and Robotics (ICINCO-2013), pages 360-365
ISBN: 978-989-8565-70-9
Copyright
c
2013 SCITEPRESS (Science and Technology Publications, Lda.)

Since by the time of tests the amount of data for
classification of the abnormal plant modes will be
insufficient, consideration was given to the single-
class algorithm of anomaly detection which learns
using a single data set of which majority or all are
assumed to be nominal. It learns the nominal data
model that may be used to signal anomalies if the
new data do not coincide with the model.
The selected algorithm and diagnostic system
architecture were verified using the simulated data
reflecting the typical forecasted real data obtained
from the plant. Consideration was given to the
system architecture enabling efficient real-time
diagnosis of the engine.
2 SOFTWARE ARCHITECTURE
2.1 Introduction
The proposed diagnostic system architecture
implies division of the algorithms into two classes of
algorithms requiring rigid real-time (RTT) and
calculation algorithms which do not require
immediate response to the inputs (STT). Table 1
presents classification of the diagnostic software
(DSW) and describes functionality of the tasks.
The fundamental difference between tasks (H)
and (S) lies only in the priority and planner. They
are realized as a pool of algorithms executed within
an integrated process. Reasoning from the time
requirements and hardware configuration, there may
be more than one task pool (H and S) with different
sets of independent algorithm. (I)–(INI), this part of
DSW is executed at the stage of activation and
performs the functions of determination of
configuration (distribution of the computer
resources) and generation of the necessary number
of tasks (H) and (S). Connection of inputs and
outputs of the algorithm with nonblocking queues.
The inputs and outputs of the algorithm are
connected by the nonblocking queues at the stage of
initialization; the execution cycles of the rigid real-
time algorithms are generated at the stage of
initialization. DAS – digital acquisition system.
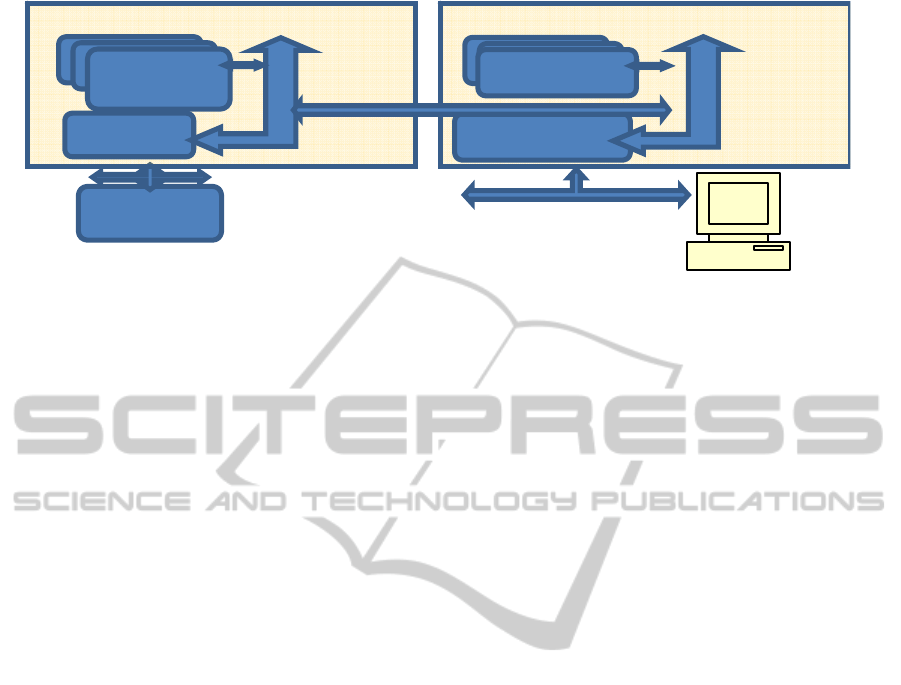
The system architecture realized on a
multiprocessor system is shown in Fig. 1 depicting
allocation of the tasks to the multiprocessor system
processors, the affinity interface being used for
binding.
2.2 Description of the Algorithm
of Task Running
The diagnostic system tasks execute the following
stepwise functions:
2.2.1 Task (INI)
1. Inventory of the RTT algorithms.
a) Determination of the number of RTTs - N.
b) Initialization of the internal structures of the
algorithms.
c) Assignment of output identifier (for task (M)).
Table 1: Program Structure of DS
1
.
Task Type Function and description
(INI) Initialization STT Responsible for DSW initialization, in particular, binds the algorithms to particular
tasks and supports the real-time requirements (dynamic balancing).
(I) Reception and
multiplexing of the inputs
RTT Supports reception of inputs and their allocation to the input ring buffers
(H) Task of rigid real-time
algorithms
RTT Supports execution of the parts of algorithms that must be executed in a strictly
allocated time. In the case of multiprocessor system, the number of task can be
more than one. Determined is from the results of verification of the system
architecture with regard for the computational complexity of the algorithms and
availability of resources.
(S) Task of soft real-time
algorithms
STT Accumulates all algorithms or their parts which are not rigidly timed.
In the case of multiprocessor system, the number of tasks can be more than one
Determined is from the results of verification of the system architecture with regar
d
for the computational complexity of the algorithms and availability of resources.
(M) Task of meta-
algorithms and output
RTT Supports generation of the outputs on the basis of the results of operation of the
algorithms of SТT and RTT. This tasks includes also generation and transmission
of the control signals.
(DI) Service diagnosis STT Outputs service and diagnostic information.
1
Tasks (I) and (М) may be combined in one process executed as a real-time task. Their algorithm which is assumed to be event-triggered is
described in what follows.
AConceptoftheReal-timeDiagnosticSystemforPrototypeEngines-ArchitectureandAlgorithm
361
DAS
I/OIndustrial
Network
RTT
CPU1
/
I
,
M
CPU
CPU
CPU2‐N/H
Internal
realtime
bus
Internal
realtime
bus
STT
CPUM+1/DI,INI
CPU
CPU
CPUN‐M
/
S
LAN
Figure 1: Architecture and task allocation on the multiprocessor computer. CPU1,2-N,M are individual processors or a set
of processors executing the tasks.
2. Determination of the input points for the soft real-
time algorithms (STT).
a) Determination of the list of connected input
signals for each STT.
b) Assignment of the signal receiver identifier.
3. Determination of the input points for RTT.
a) Determination of the list of connected input
signals for each RTT.
b) Assignment of the signal receiver identifier.
c) Determination of the project deadline for each
RTT.
4. Determination of the input points for the meta-
algorithm.
a) Determination of the list of connected input
signals.
b) Assignment of the signal receiver identifier.
5. Algorithm balancing with respect to tasks (H and
S) and processors.
a) Determination of the number of processor
kernels - Np.
b) Determination of the sequences of test signals
for each RTT.
c) Activation of each RTT on the test sequence of
input signals for determination of the maximal
delay per iteration.
d) Determination of the required processor
resources for each RTT on the basis of the
established maximal delay and project deadline.
e) RTT layout with respect to tasks (H) on the
basis of the required processor resources.
f) Determination of N(H), the number of tasks of
types (H) and N(H) of the sets of the points of
input in RTT for each task .
g) N(H) should not exceed Np-2 to satisfy the
requirements for time characteristics.
6. The process with task (S) is generated, its affinity
to Np - (N(H) + 1) processors is established, the
points of input for all STT are given to it.
7. N(H) processes with tasks (H) are generated,
affinity to one free processor is established for
each, and the corresponding sets of the points of
input to RTT are passed.
8. Affinity to one free processor is established for
the current process.
9. Control is passed to task (I).
2.2.2 Task (I)
The task is waiting for input data. After getting
them, the signals are placed into the input ring
buffers. The data readiness signal is sent to all tasks
(H) and (S). Control is transferred to task (M).
2.2.3 Task (H)
The task is waiting for the data readiness signal.
After getting the input data readiness signal, the
task executes RTTs successively fixed to it.
(Individual RTTs place the outputs into the output
ring buffers.)
Upon cycle completion, passage is made to the
mode of waiting for the input data (duration of one
cycle is at most 5 ms.).
2.2.4 Task (S)
After activation individual flows are generated to
execute STT.
Each algorithm operates using its own program
and reads data from the input buffer.
The data readiness signal is processed by each
STT using the internal algorithm. (Individual STTs
place the output signals in the output ring buffers.)
2.2.5 Task (M)
Selection of meta-algorithms: each meta-algorithm
ICINCO2013-10thInternationalConferenceonInformaticsinControl,AutomationandRobotics
362
checks availability of connected signals in the output
ring buffers; if any, the algorithm is executed and,
possibly, the output is generated and then placed in
the output ring buffers.
Transmission of signals kept in the output ring
buffers.
2.2.6 Task (DI)
The task periodically diagnoses DSW with low
priority. The diagnostic results are archived in the
common system database and may be displayed on
the service monitor.
2.3 One-class Support-Vector Machine
(SVM)
The one-class SVMs attempt to describe with the use
of the model the set of normal learning data so as to
enable the resulting model to discriminate between
the normal and abnormal data. It is assumed that the
learning data may contain some anomalies. The one-
class SVM first transforms the learning data from the
initial data space into a larger one or, possibly,
infinite-dimensional space of attributes and then
seeks there a linear model (hyperplane), which
allows actually all normal data to stay on the one
side separately from the learning data deviating from
the norm, if any.
2.3.1 Formulation of the Task
and Description of the Algorithm
Each data object is represented as a vector (point) in
the
p
-dimensional space (sequence of
p
numbers).
Each of these points belong only to one class. We
assume that the points are given by
)},).....(,(),,{(
11 nnii
txtxtx
where the label
i
t
assumes value 1 or −1 depending
on whether the point
i
x
belongs to the class or not.
Each
i
x
is a
p
-dimensional vector.
Needed is to generate the function
TXF : (classifier) assigning the class t to an
arbitrary object
ó
.
The predictions of SVM rely on the functions like
0
1
(;)sign ( )
N
i
i
tK
**
i
xx,x
,
1
,
N
train i i
i
Dt
x
, where
d
i
Rx
,
{ 1,1}, 1,...,
i
tiN
). At that, the weights of
the objects
1
{}
N
ii
are nonnegative and upper-
bounded by the constant
0C . The function
()K x,
y
also has parameters on which depends
essentially the performance of the resulting
classifiers.
The kernel of basic radial Gaussian functions
returning the distance between examples x
i
and x
j
as
2
2
exp),(
ji
ji
xx
xxK
(1)
was considered as the kernel. The one-class SVMs
require that the user establishes the maximal
number of points in the learning sample that can be
outliers. We take in our experiments that it is
0.0025 because this provides acceptable results
(Schwabacher et al., 2009). The value of the
SVM kernel is selected using the procedure of
(Runarsson et al., 2003) which takes the least value
such that the assigned part 0.0025 of the learning
points is classified as abnormal.
The results of modeling are considered below,
the data used to verify the algorithm are similar to
the actual data; as a preliminary the algorithm was
tested using the normal (Gaussian) model.
Modeling was carried out on a computer with four
Intel Core 3.07GHz processors.
2.3.2 Simulation
The data for altogether 16 simulated parameters
were considered. A sample of data knowingly
belonging to the normal and abnormal modes was
generated for learning.
Learning sample: data duration 6 s., sampling
step 5 ms.
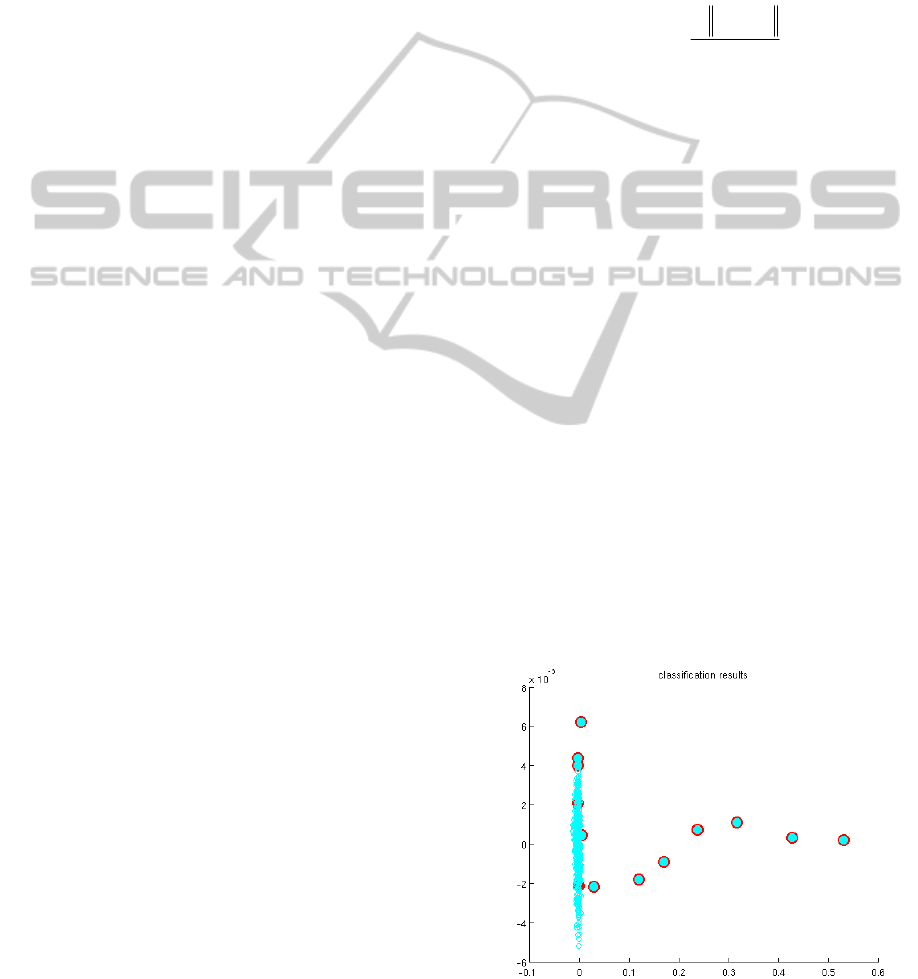
Figure 2: Location of points on the hyperplane for
example (a).
AConceptoftheReal-timeDiagnosticSystemforPrototypeEngines-ArchitectureandAlgorithm
363

Consideration was given to two examples:
a. Test sample corresponding to the abnormal
mode, data for 0.15 s., sampling step 5 ms.
b. Test sample for the nominal operation mode,
data for 0.2 s., sampling step 5 ms.
2.3.3 Analysis, Resource Consumption
and Speed of the Algorithm
Classification precision for example a. was about 80
%, 2 points of 11 were classified as normal. One can
see on the whole the increase in the distinction of the
tested data from the learning sample in the course of
abnormality development.
Figure 3: Location of points on the hyperplane for example
(b).
For example b., classification precision was about
50%, 16 of 38 were classified as abnormal. However,
on the whole one can see the correspondence
between the tested data and the learning sample. The
relative low percent of correct classification in
example b. is attributed to an insufficient volume of
the learning data in the example, increased volume of
the learning sample from 6 s. to 1 min. improves
precision up to 70%.
The probability of the false detection of the
abnormal situation may be considerable reduced if
use several consecutive detections of the abnormal
situation as a sign that situation is really changed and
deviated from a nominal behavior. The pitfall of the
such solution will be reducing the reaction time of
the DS.
The algorithm realizing the SVM method
performs two distinct tasks:
1. modeling of calculation and learning,
2. state classification.
The first task belongs to the STT tasks and
required up 200 ms. on the simulated data samples.
The second task requires much less resources and
may be run in real time (calculation required about
1 ms.).
3 CONCLUSIONS
The paper discusses the architecture and
algorithmic aspects of the design the fault diagnosis
tested for prototype engines. The distributed
architecture of the test bed allows affectively
realizing the complex SVM fault diagnoses
algorithm with reasonable time response. The SVM
algorithm demonstrated its practicability for
preliminary diagnosis of abnormalities of the
objects on the test bed. It was possible to diagnose
an abnormality already at the initial stage, which
would enable reduction in the outcomes of the
abnormality the tested object. However, extended
studies on a larger data volume of real data are
required for confident use of the method.
Estimation of the efficiency of the SVM algorithm
for detection of abnormalities as applied to real data
is a challenge because the number of anomalies in
the data usually is not known. One of the
approaches to estimation of algorithm efficiency
lies in estimating it on the artificial data where the
number of anomalies is known.
REFERENCES
Vapnik, V., 1995. The Nature of Statistical Learning
Theory, Springer-Verlag, New-York.
Iverson, D., Martin, R., Schwabacher, M., Spirkovska, L,
Mackey, R., Castle, P., et al., 2009-1909. General
Purpose Data- Driven System Monitoring for Space
Operations, AIAA Infotech@Aerospace Conference,
AIAA, Washington, DC, 2009, AIAA paper.
Schwabacher, M, Nikunj, Oza, Matthews, B., 2009.
Unsupervised Anomaly Detection for Liquid-Fueled
Rocket Propulsion Health Monitoring. Journal of
aerospace computing, information, and
communication. Vol. 6, July.
Jeong, S, Kang, I., Jeong, M. K., Kong, D., 2012. A New
Feature Selection Method for One-Class
Classification Problems, IEEE Transactions on
Systems, Man, Cybernetics, Part C, 42, pp. 1500-
1509.
Kang, I. Jeong M. K., and Kong, D., 2012. A
Differentiated One-Class Classification Method with
Applications to Intrusion Detection, Expert Systems
with Applications, 39, pp. 3899-3905.
Tax, D. M. J., Duin, R. P. W., 1999. Support Vector
Domain Description, Pattern Recognition Letters,
Vol. 20, No. 1113, pp. 1191–1199.
ICINCO2013-10thInternationalConferenceonInformaticsinControl,AutomationandRobotics
364

Chandola, V., Banerjee, A., Kumar, V., 2009. Anomaly
Detection: A Survey, (to appear), ACM Computing
Surveys.
Markou, M., Singh, S., 2003. Novelty Detection: A Review.
Part 1: Statistical Approaches, [Online], Signal
Processing, Vol. 83, pp. 2481–2497. http://dx.doi.org/
10.1016/j.sigpro.2003.07.018 (Accessed: 6 Јune 2013).
Markou, M., Singh, S., 2003. Novelty Detection: A
Review. Part 2, Neural Network Based Approaches,
Signal Processing, Vol. 83, pp. 2499–2521.
Chang, C., Lin, C., 2007. LIBSVM: a Library for Support
Vector Machines, (Online), http://www.csie.ntu.edu.tw/
~cjlin/papers/libsvm.pdf (Accessed: 6 Јune 2013).
Runarsson, R. T., Unnthorsson, R., Johnson, T. M., 2003.
Model Selection in One Class Nu-SVMS using RBF
Kernels, 16-th Conference on Condition Monitoring
and Diagnostic Engineering Management.
AConceptoftheReal-timeDiagnosticSystemforPrototypeEngines-ArchitectureandAlgorithm
365
