
A Conceptual Model for Effective Early Warning Information
Systems (EEWIS)
Mohamed Saad Eldin
1
, Sherif A. Mazen
1
, Ehab E. Hassanen
1
and Hegazy Zaher
2
1
Department of Information Systems, Faculty of Computers and Information, Cairo University, Giza, Egypt
2
Department of Information Systems, French University, Cairo, Egypt
Keywords: Early Warning, Crises, Forecasting, Model, Indicators.
Abstract: This paper addresses the need for effective early warning information systems (EEWIS) that are capable of
predicting future crises and that can help prevent them or reduce their negative effects. The main problem
facing any EWIS is the lack of effectiveness. The most effective early warning information systems are
characterized by accuracy, flexibility and the ability to detect risks. Effective early warning information
systems can empower communities to prepare for and confront risks and disasters. An effective EWIS
should be based on a reliable and consistent model, yet the models currently available are mostly
deterministic, simplified or inconsistent in application and assumption; thus making them unreliable and
impractical. The goals of this paper are to provide guidelines for professionals involved in implementing
effective early warning information systems, and to present a novel model for EEWIS that can be adapted to
the dynamic needs of the field of crisis management and preparedness.
1 INTRODUCTION
Although early warning information systems are
used to collect and share information at a time of
crisis, such systems are not always effective. While
Assilzadeha and Mansor (2008) believe that the
development and implementation of application
software for early warning- especially for disaster
data and information management- is crucial, Glantz
(2004) claims that there is no perfect Early Warning
System (EWS), except on paper, in governmental
plans, or in a PowerPoint presentation, and that most
of the current systems are not as effective as they
should be. Along the same lines, Sanada et al.,
(2006) also agree that the information systems used
to collect and share information in the time of a
disaster are not always effective. Furthermore, Harff
(1998) argues that at present, early warnings are
rarely "early," seldom accurate, and moreover lack
the capacity to distinguish among different kinds of
crises. In this context, after analyzing the current
problems in existing early warning information
systems used in crisis or disaster preparedness, we
have found that in many cases these systems tend to
be fairly narrow in scope and do not have an
adequate or clear model for collecting, classifying,
processing and producing accurate forecasting
information. The accuracy of forecasting models is
essential for building EEWIS. The limitations of
existing early warning information systems suggest
the need for a more comprehensive conceptual
model. This is the goal we aim to achieve from this
paper. Furthermore, other motivations for this paper
are: The scarcity of specialized EWIS researches
used in crisis preparedness, most of the previous
studies did not address the key steps used in building
EEWIS and there is no agreement on the ideal
structure or functions of EEWIS.
The proposed model provides a guideline for any
organization or sector in the country that needs to
have an EEWIS for crisis preparedness. Moreover,
this model will support any information system in
producing more effective and accurate predictions of
the future. In addition, it will provide decision
makers with a reliable and manageable amount of
warning information for taking preventive actions.
2 EARLY WARNING
INFORMATION SYSTEMS
The idea of early warning emerged in the fifties of
the past century, and was used for the first time in
134
Saad Eldin M., A. Mazen S., E. Hassanen E. and Zaher H..
A Conceptual Model for Effective Early Warning Information Systems (EEWIS).
DOI: 10.5220/0004419801340142
In Proceedings of the 15th International Conference on Enterprise Information Systems (ICEIS-2013), pages 134-142
ISBN: 978-989-8565-60-0
Copyright
c
2013 SCITEPRESS (Science and Technology Publications, Lda.)

military domains to predict risks and potential
attacks before they occur. Until the early eighties;
the concept of early warning had not evolved
noticeably due to a number of reasons; such as the
difficulty of creating its applications and its high
cost. However, the concept has been rediscovered
again after a series of crises and disasters had taken
place in the world and after witnessing their major
impact on lives and property (Eldin, 2011). The
expression ‘Early Warning’ is used in many fields to
mean the provision of information on an emerging
dangerous circumstance where that information can
enable action in advance to reduce the risks involved
(Basher, 2006). A universally accepted definition of
an EWS does not yet exist and most probably never
will (Sivakuma, 2009). There are many definitions
of an EWS that are used to guide the actions of
individuals, groups, and governments. The formal
UN definition is as follows: “The provision of
timely and effective information, through identifying
institutions, that allows individuals exposed to a
hazard to take action to avoid or reduce their risk
and prepare for effective response” (ISDR, 2003).
An EWS can also be defined as “a social process for
generating maximally accurate information about
possible future harm and for ensuring that this
information reaches the people threatened by this
harm, as well as others disposed to protect them
from the harm” (Glantz, 2004); (Davies and Gurr,
1998). An 'Early Warning Information System
(EWIS)' (see Figure 1.) can be understood as a set of
institutional and technical solutions designed and
implemented in a coherent way to make available, to
a wide range of users and more particularly to
decision makers, information useful to carry out
vulnerability analyses, to evaluate and manage the
risk of a hazard that can become a disaster, and to
manage disasters from prevention to recovery and
rehabilitation (Scott, 2003); (ISCRAM, 2008); (IAD,
2002). The objective of EWIS is to generate accurate
information to empower individuals and
communities threatened by hazards to act in
sufficient time and in an appropriate manner so as to
reduce the possibility of personal injury, loss of life
and damage to property or the environment. We can
use the term EWIS for any information system that
collects, shares, analyzes data, produces future
predictions about potential crises and gives
recommendations or warnings for those involved.
Early Warning Information Systems are still not
widely practiced around the world. .The applications
of EWIS are costly, limited and not widely available
especially in some international organizations. The
best known EWIS is the HEWS- Humanitarian Early
Warning System- used by the Department of
Humanitarian Affairs in the United Nations, and the
GIEWS -The Global Information and Early Warning
System- used by the Food and Agriculture
Organization of the United Nations (Verstegen,
1999).
Figure 1: EWIS architecture.
3 EFFECTIVE EARLY WARNING
INFORMATION SYSTEMS
Many developing countries, in particular the least
developed among them, have limited capacities for
effective early warning systems, and in some cases
they are virtually non-existent (Villagran 2006). The
challenges facing any early warning system are
ineffectiveness and failure to achieve its goals. Any
information system can be called effective if it
supports the organization in reaching its objectives
(Malik, 2001). Effective early warning systems not
only save lives but also help protect livelihoods and
national development gains (United Nations, 2006).
Early warning systems are widely recognized as
worthwhile and necessary investments. However in
many cases, early warning systems do not exist, are
ineffective, or break down at critical points – risking
devastation, death, and destitution (ISDR, 2003).
Two international conferences on early warning, in
1998 and 2003 produced a set of internationally
agreed upon guiding principles for effective early
warning systems. The 1998 Potsdam Conference on
Early Warning Systems and the 2003 Second
International Conference on Early Warning in
Germany addressed technical considerations,
strategic issues and institutional requirements in the
early warning field, Moreover, the conferences made
specific recommendations for strengthening early
warning systems; including increasing the ability of
these systems to be more accurate and flexible
(United Nations, 2006); (EWC, 1998); (EWC-ll,
2003); (EWC-lll, 2006). Furthermore, the core
message of the session “People-Centred Early
AConceptualModelforEffectiveEarlyWarningInformationSystems(EEWIS)
135

Warning Systems” at the World Conference on
Disaster Reduction that was held in January 2005, in
Kobe Japan, was that effective early warning
systems must be embedded in an understandable
manner and relevant to the communities which they
serve. Therefore, these systems must be developed
in such a way that ensures that they are functioning
when needed and that the warnings are timely,
comprehensible and ultimately acted upon by the
diverse array of individuals at risk in any
emergency. The Global Survey of Early Warning
Systems (2006) and the UN-ISDR/Platform for the
Promotion of Early Warning (2006) concluded that a
complete and effective early warning system model
should comprise four inter-related elements: risk
knowledge, monitoring and warning service,
dissemination and communication, and response
capability. A weakness or failure in any one part
could result in failure of the whole system (United
Nations, 2006). Along the same lines, the World
Meteorological Organization (2011) suggested that
effective early warning systems are comprised of
four operational components
1. Hazards are detected, monitored, forecasted, and
hazard warnings are developed;
2. Risks are analyzed and this information is
incorporated in warning messages;
3. Warnings are issued (by a designated
authoritative source) and disseminated in a
timely fashion to authorities and the public at
risk;
4. Community-based emergency plans are activated
in response to warnings to reduce impact on lives
and livelihoods.
Failure in one component or lack of coordination
across them leads to failure of the whole system
(WMO, 2011). Martin (2008) also points out in his
paper that the effectiveness of any EWIS largely
depends on the transformation of the event
recognition into the report of warning to the
population or people at risk (Martin et al., 2008);
(Wikipedia, 2012).
From our review of previous studies about
effective early warning information systems; we
have concluded that the effectiveness of EWIS will
depend on the following characteristics:
1. Integrated: All early warning information system
phases should be integrated into one generic
model
2. Detectability: Effective early warning
information systems should have the ability to
confirm the prediction that impacts are going to
occur.
3. Predictability: Effective early warning
information systems should be highly predictive
and capable of forecasting the crisis/hazard
before they occur.
4. Accuracy: An Effective EWIS should produce
accurate results.
5. Certainty: An effective EWIS should have a very
high level of confidence in that the predictions
and detections will be accurate and not result in
false alarms.
6. Flexible: An effective early warning
information system should be flexible and
expand its activities to include different varieties
of risks and hazards.
4 EWIS MODEL
Various writers have identified what they consider to
be the components of a successful EWIS model; for
example, a paper by Verstegen (1999) suggests that
the EWIS model should have five components:
selection of indicators; communication of warnings;
reception of warnings; early warning education;
generation and maintenance of awareness. However,
this model does not specify the methods or steps of
data collection. Moreover, it does not explain how to
measure the precursors, evaluate the event or specify
the forecasting models. Along the same lines,
Lundin (2008) suggests that an EWIS is responsible
for issuing forecasts, warnings, and responses. Yet,
the model he proposes does not clarify how the data
is collected and analyzed; explain how to prepare
future forecasts or how to select the most suitable
model for forecasting. Obviously, there is no
agreement on the ideal structure or function of an
early warning system (Shrestha, 2009). This means
that the structure and functions of EWIS may vary
from one organization to another and from one field
to another. Therefore, after reviewing most of the
previous studies about the major components of an
EEWIS model we suggest that any EEWIS (see
Figure 2.) should take into considerations four
essential sub-models. The first model (Societal
Detection of Events sub-model) includes functions
that capture and analyze the event/crisis information;
the second model (Determining Early Warning
Indicators sub-model) determines the set of
mathematical indicators that should be measured
frequently; the third model (Future Forecasting sub-
model) provides future forecasts depending on the
data calculated from the previous model, and finally
the fourth model (Issuance of Warnings sub-model)
ICEIS2013-15thInternationalConferenceonEnterpriseInformationSystems
136
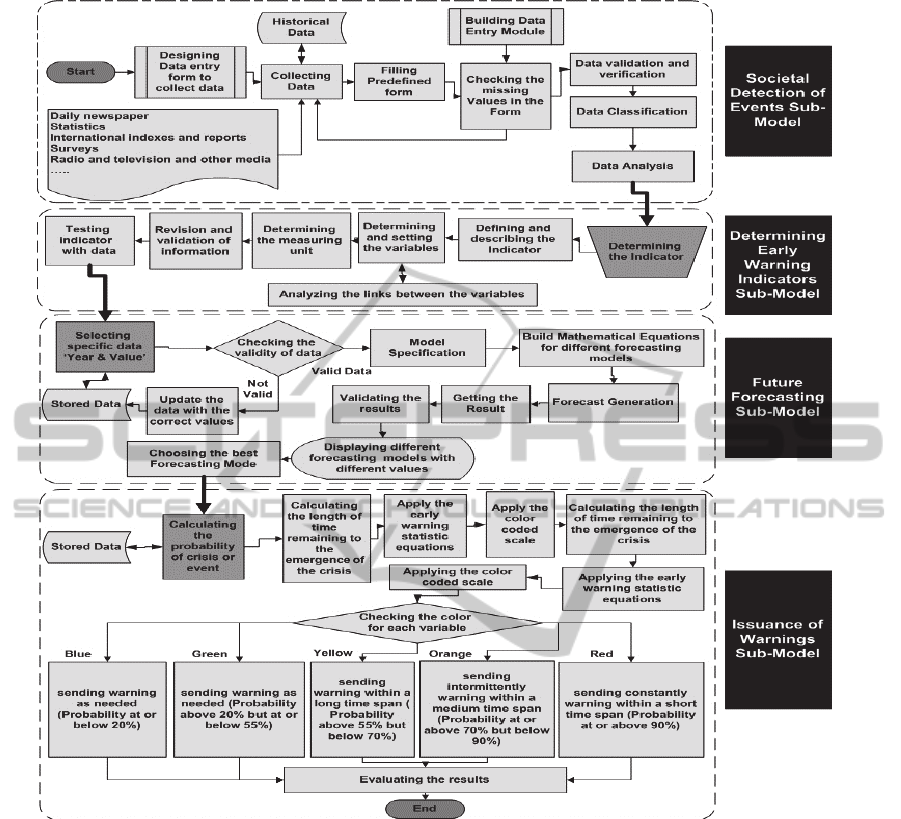
Figure 2: EEWIS model.
is concerned with ending warnings (alerts) to users.
Each of the four models is explained below in detail.
EEWIS (Proposed System) is based on the
conceptual model which consists of set of four sub-
models, the major inputs of the proposed EEWIS
depend on the heterogeneous information which is
gathered from different sources include (News,
Statistics, Reports, Databases, Radio & T.V, Data,
etc). The major outputs from the proposed system
are set of warnings (alerts).
5 CASE STUDY
In order to demonstrate some of the key concepts
introduced in the model described above, we have
implemented a proof-of-concept prototype purely in
software. The key objectives for the proof of concept
are to demonstrate the early warning theoretical
concept, and to show how the theoretical concept
can be implemented practically against data from the
law enforcement sector. The next few pages will
explain the case study in more detail.
5.1 Societal Detection of Event
a) The event data is collected from different sources
and is regularly inputted into the EWIS.
b) The number of occurrences is calculated for each
event in a specific time frame.
c) The EWIS selected the most frequent event;
which is "widespread drug abuse among the
AConceptualModelforEffectiveEarlyWarningInformationSystems(EEWIS)
137

youth" (see Table 1.), because this event has the
highest number of occurrences. This event was
detected from multiple sources
through the
period of time from January 2006 to December
2010 (see Table 2.).
d) Data is collected from different data sources and
entered into the EWIS.
e) After analyzing the data, the system found that
this event is increasing on an annual basis (see
Table 2).
Table 1: Event occurrences (2010).
Event /Phenomena No. of Occurrences
Drug abuse (youth) 64
Spinsterhood 24
The collapse of buildings 22
Hooliganism 21
Child molestation 20
Luxury consumer 19
Unknown Parentage 18
Train accidents 18
Drug trafficking 14
Trafficking in Persons 12
Table 2: Event (drug abuse) occurrences (2006-2010).
Year 2006 2007 2008 2009 2010
No of occurrences 36 40 43 52 64
5.2 Determine the Event Indicators
a) Determining the indicators that best describe the
event: The EWIS uses from 3 (minimum) to 10
(maximum) indicators for each event/phenomena
to work efficiently, the number of indicators
varies from one event/phenomena to another.
The process of determining the indicators is
implemented by a group of experts specialized in
designing law enforcement indicators and these
indicators are:
Indicator A: Total number of drug users in
the country.
Indicator B: Total number of drug cases.
Indicator C: The percentage of people
arrested in drug cases to the total population.
Indicator D: The percentage of local people
arrested to the total of arrests.
b) Defining the indicators and determining the
variables involved in calculating them:
Total number of addicted youth.
Total number of drug cases.
Percentage of youth arrested in drug cases to
the total youth population = (total number of
youth arrested/ total youth population) * 100.
Percentage of local people arrested to the
total of arrests of other nationalities= (total
number of local youth population arrested in
drug abuse cases/ total youth arrested from all
nationalities in drug abuse cases) * 100.
Table 3: Indicators time series data (2003-2010).
Year Indicator A Indicator B Indicator C Indicator D
2003 700 650 4% 40%
2004 800 800 5% 45%
2005 850 825 5.5% 48%
2006 1050 1000 7% 49%
2007 1110 1050 7.2% 55%
2008 1206 1200 7.7% 60%
2009 1708 1400 9% 62%
2010 2000 1650 10.6% 69%
Table 4: Mathematical measures for indicator (A).
Model Fitted Equation MAPE Correlation
Linear y = 386.9 + 175.8 x 11 R
2
= 0.891
Quadratic
y = 783.3 – 62 x +
26.4 x
2
5.2 R
2
= 0.971
Cubic
y = 547.3 +183.5 x –
37.9 x
2
+ 4.8 x
3
3.5 R
2
= 0.981
5.3 Designing a Forecasting Model for
each Indicator
a) Creating a Time Series Data for Each Indicator:
Table (3) shows the time series data for all
indicators and Figure (3) shows the same table is
implemented in the EWIS.
b) Specifying the Mathematical Model: The EWIS
uses three forecasting models to be applied
(Linear, Building mathematical equations for
different forecasting models:
Linear equation (y) = mx +b (where m and b
designate constants, m is a slope of the line)
Quadratic equation (y) = ax
2
+ bx+ c (where
a, b, c are constants with a≠0 )
Cubic equation (y) = ax
3
+ bx
2
+ cx + d
(where a, b, c, d are constants with a≠0).
MAPE ( Mean Absolute Percentage Error) =
ActualValueFittedValue
ActualValue
n
100
(Where n = total number of actual values)
R
2
: The coefficient of determination.
ICEIS2013-15thInternationalConferenceonEnterpriseInformationSystems
138

Table 5: Forecasting Models for Indicator (A) for the
years (2011-2014).
Year X Actual Data Linear Quadratic Cubic
2003 1 700 563 748 698
2004 2 800 739 765 801
2005 3 850 914 835 885
2006 4 1050 1090 958 979
2007 5 1110 1266 1134 1112
2008 6 1206 1442 1362 1312
2009 7 1708 1618 1644 1608
2010 8 2000 1793 1978 2029
2011 9 1969 2366 2602
2012 10 2145 2806 3357
2013 11 2321 3299 4322
2014 12 2497 3844 5526
c) Creating Forecasts for Each Indicator (Forecast
Generation):
Indicator (A), (B), (C) and (D)
Table (4) shows the correlation of variables for
each model, the EWIS will automatically choose
the cubic model because its correlation value is
the largest from among other models (=0.981),
and the value of (MAPE) is the smallest (=3.5),
so the forecasting data for the cubic model will
be more accurate. Table (5) shows the
comparison between the forecasting data for
indicator (A). The system will carry out the same
processes as indicators (B, C and D); the EWIS
will automatically choose the cubic model
because its correlation value is the largest among
other models. In addition, the value of (MAPE)
is the smallest, so the forecasting data for the
cubic model will be more accurate.
d) Charting the forecasting data for each indicator
(see Figure 3.)
e) Choosing the best model: After analyzing and
validating the data, the EWIS will choose the
best forecasting model (see Figure 4.) depending
on the following criteria:
1. Lowest MAPE.
2. Highest correlation between variables.
Figure 3: EWIS: linear forecasting trend.
Figure 4: Choosing the best model.
5.4 Sending Warning Messages
a. Calculating the Probability of a Crisis:
1. Calculating the probability of each indicator
by setting a range for each one, the probabilities
will have values between 0.1 and 1 as shown in
(Table 6.).
2. Determining the level of danger (see Table
7.) the level of danger equation will be :
[(Probability of indicator A + Probability of
indicator B + Probability of indicator C +
Probability of indicator D) / total Number of
indicators] * 100.
3. Converting the result into the color coded
scale as shown in (Table 8.).
b. Calculating the Length of Time Remaining to the
Emergence of the Crisis: The system found that
in the year 2014 the detected event will reach a
dangerous level.
c. Charting Data to Determine the Level of Danger:
the EWIS charted the data for each indicator to
determine the level of danger (there are 5 levels
of danger: dangerous, high, medium, low, and
nil), the probability of a crisis and the time frame
remaining to its emergence.
d. Matching the Level of Danger to the Color
Coded Scale: The EWIS matched the level of
danger (see Table 7. and Table 8.) to the color
coded scale. (Red, orange, yellow, green and
blue).
e. Generating Alerts: the system will automatically
generate alerts based on the forecasting data
calculated through the system. Once generated,
alerts can be distributed through different
channels to many parties.
AConceptualModelforEffectiveEarlyWarningInformationSystems(EEWIS)
139

Table 6: Probability table.
Indicator A Indicator B Indicator C Indicator D
Range Probability Range Probability Range Probability Range Probability
<500 0.1 <400 0.1 < 1 0.1 <10% 0.1
50-1000 0.2 40-800 0.2 1- 3 0.2 10-19 0.2
1001-1500 0.3 80-1200 0.3 >3-6 0.3 20-29 0.3
1501-2000 0.4 1201-1600 0.4 >6-9 0.4 30-39 0.4
2001-2500 0.5 1601-2000 0.5 >9-12 0.5 40-49 0.5
2501-3000 0.6 2001-2400 0.6 >12-15 0.6 50-59 0.6
3001-3500 0.7 2401-2800 0.7 >15-18 0.7 60-69 0.7
3501-4000 0.8 2801-3200 0.8 >18-21 0.8 70-79 0.8
4001-4500 0.9 3201-3600 0.9 >21-24 0.9 80-89 0.9
> 4500 1 > 3600 1 >24 1 90-100 1
Table 7: Final results.
Year
Indicator A
Probability
Indicator B
Probability
Indicator C
Probability
Indicator D
Probability
Level of
Danger (%)
Description
2003 700 0.2 650 0.2 4% 0.3 40% 0.5 30 Low
2004 800 0.2 800 0.2 5% 0.3 45% 0.5 30 Low
2005 850 0.2 825 0.3 5.5% 0.3 48% 0.5 32.5 Low
2006 1050 0.3 1000 0.3 7% 0.4 49% 0.5 37.5 Low
2007 1110 0.3 1050 0.3 7.2% 0.4 55% 0.6 40 Low
2008 1206 0.3 1200 0.3 7.7% 0.4 60% 0.7 42.5 Low
2009 1708 0.4 1400 0.4 9% 0.4 62% 0.7 47.5 Low
2010 2000 0.4 1650 0.5 10.6% 0.5 69% 0.7 52.5 Low
2011 2602 0.6 1999.7 0.5 12.9% 0.6 75.2% 0.8 62.5 Medium
2012 3357 0.7 2454.4 0.7 15.9% 0.7 83% 0.8 72.5 High
2013 4322 0.9 3034.6 0.8 19.8% 0.8 92.9% 1 87.5 High
2014 5526 1 3658.9 1 24.8% 1 104.4% 1 100 Dangerous
Table 8: Description of the color coded scale.
Color Coded Scale Description
Dangerous (Red Color) Threat already occurring or its eventual occurrence is “almost certain”, Probability >= 90%
High (Orange Color) The occurrence of the threat is “probable” to “highly likely", Probability >= 70% but < 90%
Medium (Yellow Color) There is “likely” chance that the threat will occur, Probability >=55% but < 70%
Low (Green Color)
Occurrence is possible but “improbable”; “little chance” to “about even” chance of occurrence,
Probability >= 20% but < 55%
Nil (Blue Color)
Probability of event occurrence is negligible or “highly unlikely”, Probability < 20%
6 TESTING THE EFFICIENCY
OF THE EWIS
According to the effectiveness criteria in section 3 of
this paper we have obtained the following results:
1. Integration: The proposed EWIS sub-models are
integrated into unified model with specific inputs
and outputs.
2. Detectability: The proposed EWIS detected
number of events occurrences as described in
table (1,2).
3. Predictability: The proposed EWIS uses three
prediction models (Linear, Quadratic and Cubic)
to forecast future data trends, in addition the
system selects the best forecasting model
according to the accuracy and correlation
between variables.
4. Accuracy: The proposed EWIS produces
accurate results (see Table 9.), accuracy can be
measured using the following equation:
ICEIS2013-15thInternationalConferenceonEnterpriseInformationSystems
140

Table 9: EWIS results.
Year
Indicator A
Predicted
Value
Accuracy
(%)
Indicator B
Predicted
Value
Accuracy
(%)
Indicator C
Predicted
Value
Accuracy
(%)
Indicator D
Predicted
Value
Accuracy
(%)
2003 700 698
99.7 650 656.1 99.1
4 3.9
97.4 40 40.4 99
2004 800 801
99.9 800 774.2 96.8
5 5.1
98.0 45 44.1 98
2005 850 885
95.9 825 869.5 94.6
5.5 5.9
93.2 48 47.6 99.2
2006 1050 979
93.2 1000 960.5 96.1
7 6.5
92.3 49 50.9 96.1
2007 1110 1112
99.8 1050 1065.6 98.5
7.2 7.2
100 55 54.5 99.1
2008 1206 1312
91.2 1200 1203.6 99.7
7.7 8
96.3 60 58.4 97.3
2009 1708 1608
94.2 1400 1392.9 99.5
9 9
100 62 63 98.4
2010 2000 2029
98.6 1650 1652.1 99.9
10.6 10.7
99.1 69 68.5 99.3
2011 2600 2602
99.9 1987 1999.7 99.4
11.2 12.9
86.8 73 75.2 97
2012 3350 3357
99.8 2502 2454.4 98.1
14.5 15.9
91.2 77 83 92.2
f. 2
013
4322
3034.6
19.8
97.4
92.9
2014 5526
3658.9
24.8
98.0
104.4
Average 97.2% 98.4% 95.4% 97.56%
100
PredictedValueEWISActualValue
ActualValue
X100
5. Certainty: The proposed EWIS has a very high
level of confidence in its predictions which in
average =97.14% and correlation of data is above
98%.
6. Flexible: The proposed EWIS can be used in
different organization with different events or
hazards. The system featured in the case study
used an event from the law enforcement sector,
which had the highest number of occurrences
during the period of the study. However, it can
use events from other sectors and apply the same
processes that were mentioned above.
7 CONCLUSIONS
In this paper, we have proposed a conceptual model
to build an effective EWIS. We have also presented
the detailed structure of this model and how it will
be implemented. The model was tested through a
case study to prove the concept. A list of issues
related to the EWIS was also presented. Based on
our literature review, we have concluded that
hitherto there had only been a few models
worldwide for building an efficient EWIS. Hence, an
information system that is built using our new model
will be effective and beneficial due to a number of
reasons. Firstly, it will provide information on the
past, present and future and on relevant events inside
and outside any organization. Secondly, it will be an
integrated system for gathering relevant data,
converting it to warning information and supplying
the same to concerned executives and decision
makers. Thirdly, it will reduce the time needed to
build a sophisticated EWIS from scratch. Fourthly, it
will select the best model for forecasting; which
leads up to accurate results. And finally, it will
strengthen the ability of the organization to prevent
disasters and crises before they occur.
REFERENCES
Assilzadeha H., Mansor S.B.,2008. Natural Disaster Data
and Information Management System, International
Society for Photogrammetry and Remote Sensing,
Commission VII, Working Group 5, Methods for
Change Detection and Process Modelling, 2008-2012
Basher R., 2006. Global Early Warning Systems for
Natural Hazards: Systematic and People-centred, in
The Platform for the Promotion of Early Warning
(PPEW), Bonn, Germany.
Davies J. and Gurr T., 1998. Preventive Measures
Building Risk Assessment and Crisis Early Warning
System, Rowman & Littlefield Publishers, United
States of America.
Glantz M., 2004. Early Warning Systems: Dos and
Don’ts, in The Early Warning Systems Workshop,
Shanghai-China.
Harff B., 1998. Early Warning of Humanitarian Crises:
Sequential Models and the Role of Accelerators in
AConceptualModelforEffectiveEarlyWarningInformationSystems(EEWIS)
141

Preventive Measures: Building Risk Assessment and
Crisis Early Warning Systems, John L. Davies and
Ted Robert Gurr, eds., Lanham: Rowman & Littlefield
Publishers.
Intelligent Systems for Crisis and Disaster Management –
ISCRAM, 2008, 5th International Conference on
Information Systems for Crisis Response and
Management Washington, DC, USA, May 4-7, 2008.
Intergovernmental Authority on Development, 2002.
Disaster Risk Management Program, Strengthening of
EWISs and Vulnerability Analysis, June, 2002.
International Conference on Early Warning Systems for
the Reduction of Natural Disaster (EWC'98), Potsdam,
Germany, September 1998.
ISDR (UN International Strategy for Disaster Reduction,
2003. Terminology: Basic Terms of Disaster Risk
Reduction, at http://www.unisdr.org/, accessed 15
January 2012.
Lundin H., 2008. Crisis and Conflict Prevention with an
Internet based Early Warning System, Royal Institute
of Technology (KTH), Sweden.
Malik K., 2001. Information Systems Effectiveness: An
Integrated Approach, Paper presented at the Change
Management and the New Industrial Revolution,
International Engineering Management Conference
IEMC '01,NY, USA, October 9, 2001
Martin B., Wolfgang R., Eva O., Stephan M., Et al, 2008.
Development of Suitable Information Systems for
Early Warning Systems, FZI research Center,
Germany.
Saad Eldin M., 2011. Early Warning Systems and their
Positive Effects in Supporting Capacity Development.
Dubai Police General Headquarters, Decision Making
Support Centre, Dubai.
Sanada A., Kusakabe T. And Tamura K., 2006.
Establishing a Disaster Information System to
Practically Support Disaster Countermeasures:
Conducting and Reviewing Demonstration
Experiment, Public Works Research Institute, 38th
Joint Meeting Panel on Wind and Seismic Effects.
Scott J., 2003. Input for Second International Conference
on Early Warning (EWC II) Planning, Bonn,
Germany, January 23, 2003.
Second International Conference on Early Warning
(EWC-II) - 'Integrating Natural Disaster Early
Warning into Public Policy', Bonn, Germany, October
2003.
Shrestha B. K., 2009. Planning Food Security in Nepal,
ADB-FAO workshop on Agricultural Statistics and
Agriculture Census, Bangkok , Thailand, November 2-
5, 2009
Sivakuma M., 2009. Early Warning Systems for Drought:
Past and Present, World Meteorological Organization,
Climate and Water Department, Geneva2, Switzerland
The 3rd International Conference on Early Warning
(EWC-III), Bonn, Germany. 27-29 March 2006. See
www.unisdr-earlywarning.org and www.ewc3.org
United Nations, 2006. An Assessment of Capacities, Gaps
and Opportunities Toward Building a Comprehensive
Global Early Warning System for all Natural Hazards.
Global Survey of Early Warning Systems. Bonn:
United Nations.
Verstegen S., 1999. Conflict Prognostication: Toward a
Tentative Framework for Conflict Assessment,
Clingendael Institute, Netherland.
Villagran, J. and Bogardi J., 2006. Early Warning Systems
in the Context of Disaster Risk Management, United
Nations University: Institute for Environment and
Human Security (UNU-EHS).
Wikipedia. (n.d.). Definition of Event. Retrieved
September 15, 2012, from Wikipedia the free
encyclopedia: http://en.wikipedia.org/wiki/Event.
World Meteorological Organization (WMO)., 2011.
October). Good practices for Multi-hazard Early
Warning Systems (EWS). Retrieved from MeteoWorld:
http://www.wmo.int/pages/publications/meteoworld/ar
chive/oct11/mhew_en.html
ICEIS2013-15thInternationalConferenceonEnterpriseInformationSystems
142
