
Model-based Performance Testing of Web Services using Probabilistic
Timed Automata
Fredrik Abbors, Tanwir Ahmad, Dragos Truscan and Ivan Porres
Department of Information Technologies,
˚
Abo Akademi University, Joukahaisenkatu 3-5 A, Turku, Finland
Keywords:
Performance Testing, Performance Monitoring, Load Generation, Probabilistic Timed Automata.
Abstract:
In this paper, we present an approach for performance testing of web services in which we use abstract models,
specified using Probabilistic Timed Automata, to describe how users interact with the system. The models are
used in the load generation process to generate load against the system. The abstract actions from the model
are sent in real-time to the system via an adapter. Different performance indicators are monitored during the
test session and reported at the end of the process. We exemplify with an auction web service case study on
which we have run several experiments.
1 INTRODUCTION
Today, we see advancements in cloud computing and
more and more software applications being adapted
to a cloud environment. Applications deployed in the
cloud are delivered to users as a service, without the
need for the users to install anything. This means that
most of the processing is done on the server side and
this puts a frightful amount of stress on the back-end
of the system. Performance characteristics such as
throughput, response times, and resource utilization
are crucial quality attributes of such applications and
systems.
The purpose of performance testing is to deter-
mine how well the system performs in terms of re-
sponsiveness, stability, and resource utilization under
a particular synthetic workload in a controlled en-
vironment. The synthetic workload (Ferrari, 1984)
should mimic the expected workload (Shaw, 2000) as
closely as possible, once the system is in operational
use, otherwise it is not possible to draw any reliable
conclusions from the test results.
Performance tests are typically implemented as
usage scenarios that are either manually scripted (e.g.,
using httperf or JMeter) or pre-recorded (e.g., using
Selenium (SeleniumHQ, 2012) in the case of web ap-
plications). The usage scenarios are then executed
concurrently against the system under test. A ma-
jor drawback with this approach is that the manually
coded scripts and pre-recorded scenarios seldom rep-
resent real-life traffic and that certain combinations of
user inputs may remain untested. Repeating the same
script over and over may lead to unrealistic results
because of caching and other operating system opti-
mization mechanisms. Performance testing is done
efficiently when it is executed in an iterative man-
ner and uses techniques that simulate real life work
load as closely as possible (Menasce, 2002). This
means that load is incrementally increased until a cer-
tain threshold (saturation) is reached, beyond which
the performance of the system begins to degrade.
In this paper, we propose a model-based approach
to evaluate the performance of a system by incremen-
tally exercising different kinds of loads on the system.
The main contributions of this work are:
• we use abstract models, specified as Probabilistic
Timed Automata (PTA) to model the user profiles,
including the actions or sequences of actions the
user can send, the probabilistic distribution of the
actions, and individual think time for each action,
• the load is generated in real-time from these mod-
els and sent to the system under test (SUT) via an
adapter which converts abstract actions into con-
crete interactions with the SUT and manages data
dependencies between different actions;
The rest of the paper is structured as follows: In
Section 2 we give an overview of the work related
to our approach. Section 3 presents our model-based
testing process, while Section 4 presents an auction
web service case study and an experiment using our
approach. Finally, in Section 5, we present our con-
clusions and we discuss future work.
99
Abbors F., Ahmad T., Truscan D. and Porres I..
Model-based Performance Testing of Web Services using Probabilistic Timed Automata.
DOI: 10.5220/0004372000990104
In Proceedings of the 9th International Conference on Web Information Systems and Technologies (WEBIST-2013), pages 99-104
ISBN: 978-989-8565-54-9
Copyright
c
2013 SCITEPRESS (Science and Technology Publications, Lda.)

2 RELATED WORK
There is already a large body of work on workload
characterization and a more limited one on load gen-
eration from performance models. In the following,
we briefly enumerate several works that are closer to
our approach.
Barna et al., (Barna et al., 2011) present a model-
based testing approach to test the performance of a
transactional system. The authors make use of an it-
erative approach to find the workload stress vectors of
a system. An adaptive framework will then drive the
system along these stress vectors until a performance
stress goal is reached. They use a system model, rep-
resented as a two-layered queuing network, and they
use analytical techniques to find a workload mix that
will saturate a specific system resource. Their ap-
proach differs from ours in the sense that they use a
model of the system instead of testing against a real
implementation of a system.
Other related approaches can be found in (Shams
et al., 2006) and (Ruffo et al., 2004). In the former,
the authors have focused on generating valid traces
or a synthetic workload for inter-dependent requests
typically found in sessions when using web applica-
tions. They describe an application model that cap-
tures the dependencies for such systems by using Ex-
tended Finite State Machines (EFSMs). Combined
with a workload model that describes session inter-
arrival rates and parameter distributions, their tool
SWAT outputs valid session traces that are executed
using a modified version of httperf (Mosberger and
Jin, 1998). The main use of the tool is to perform a
sensitivity analysis on the system when different pa-
rameters in the workload are changed, e.g., session
length, distribution, think time, etc. In the latter, the
authors suggest a tool that generates representative
user behavior traces from a set of Customer Behav-
ior Model Graphs (CBMG). The CBMG are obtained
from execution logs of the system and they use a mod-
ified version of the httperf utility to generate the traf-
fic from their traces. The methods differ from our
approach in the sense they both focus on the trace
generation and let other tools take care of generating
the load/traffic for the system, while we do on-the-fly
load generation from our models.
(Denaro et al., 2004) propose an approach for
early performance testing of distributed software
when the software is built using middleware compo-
nents technologies, such as J2EE or CORBA. Most
of the overall performance of such a system is deter-
mined by the use and configuration of the middleware
(e.g. databases). They also note that the coupling be-
tween the middleware and the application architecture
determines the actual performance. Based on archi-
tectural designs of an application the authors can de-
rive application-specific performance tests that can be
executed on the early available middleware platform
that is used to build the application with. This ap-
proach differs from ours in that the authors mainly
target distributed systems and testing of the perfor-
mance of middleware components.
3 PERFORMANCE TESTING
PROCESS
Our performance testing process is depicted in Figure
1. In brief, we build a workload model of the system
by analyzing different sources of information, and
subsequently we generate load in on-the-fly against
the system. During the process, different performance
indicators are measured and a test report is created at
the end.
Requirements
Execution
Logs
Test
Report
Workload
Models
Load
Generation
System
UnderTest
Monitoring
Figure 1: Our performance testing process.
In our work, we have used various Key Perfor-
mance Indicators (KPIs) to provide quantifiable mea-
surements for our performance goals. For instance,
we specify the target KPIs before the testing proce-
dure is started and later on we compare them against
the actual measured KPIs.
3.1 Workload Characterization
The first step in our process is characterizing the
workload of the system. According to (Menasce and
Almeida, 2001), the workload of a system can be de-
fined as the set of all inputs the system receives from
the environment during any given period of time.
Traditionally, performance analysis starts first
with identifying key performance scenarios, based on
the idea that certain scenarios are more frequent than
others or certain scenarios impact more on the perfor-
mance of the system than other scenarios. A perfor-
mance scenario is a sequence of actions performed by
an identified group of users (Petriu and Shen, 2002).
WEBIST2013-9thInternationalConferenceonWebInformationSystemsandTechnologies
100

In order to build the workload model, we start by
looking and analyzing the requirements and the sys-
tem specifications, respectively. During this phase we
try to form an understanding of how the system is
used, what are the different types of users, and what
are the key performance scenarios that will impact
most on the performance of the system. A user type
is characterized by the distribution and the types of
actions if performs.
The main sources of information for work-
load characterization are: Service Level Agreements
(SLAs), system specifications, and standards.
By using these sources we identify the inputs
of the system with respect to types of transactions
(actions), transferred files, file sizes, arrival rates,
etc. following the generic guidelines discussed in
(Calzarossa et al., 2000). In addition, we extract in-
formation regarding the KPI’s, such as the number of
concurrent users the system should support, expected
throughput, response times, expected resource utiliza-
tion demands etc. for different actions under a given
load. We would like to point out that this is a man-
ual step in the process. However, automating this step
could be achieved analyzing log files of the system
and using various clustering algorithms for determin-
ing e.g., different user types, which is subject for fu-
ture work.
The following steps are used for analyzing the
workload:
1. Identify the actions that can be executed against
the system.
(a) Determine the required input data for each ac-
tion. For instance, the request type and the pa-
rameters.
(b) Identify dependencies between actions. For ex-
ample, a user can not execute a logout action
before a login action.
2. Identify the most relevant user types, based for in-
stance on the amount of interactions with the sys-
tem.
3. Define the distribution of actions that are per-
formed by each user type.
4. Estimate an average think time per action.
With think time we refer to the time between two
consecutive actions. In our approach, the think time
for the same action can vary from one user to another,
or from one test scenario to another.
3.2 Workload Models
The results of the workload characterization are ag-
gregated in a workload model based on Probabilistic
Timed Automata.
1
2
X=t1 / action1() / p0 /X:=0
3
p1
4
p2
5
p3
6
X=t2 / action2() / X:=0 X=t3 / action3() / X:=0 X=t4 / action4() / X:=0
X = t5 / action5() / p4 / X:= 0
7
X = t5 / action6() / p5 / X:= 0
8
X=t6 / action7() / X:=0
Figure 2: Example of a probabilistic timed automaton.
We take the definition of a probabilistic timed au-
tomaton (PTA) as defined by (Kwiatkowska et al.,
2006). A (PTA) P = (L,l, X,
∑
, inv, prob) is a tu-
ple consisting of a finite set L of locations with the
initial location l ∈ L; a finite set X of clocks; a fi-
nite set of
∑
of actions; a function inv : L → CC(X)
associating an invariant condition with each location,
where CC(X) is a set of clock constraints over X; a
finite set prob ⊆ L × CC(X) ×
∑
× Dist(2
X
× L)
of probabilistic transitions, such that, for each l ∈ L,
there exists at least one (l,
, , ) ∈ prob; and a label-
ing function δ : L → 2
AP
, where AP denote a set of
atomic propositions.
A probabilistic transition (l,g,p,a) ∈ prob is a
quadruple containing (1) a source location l, (2) a
clock constraint g, called guard or invariant condi-
tion, (3) a probability p, and (4) an action. The prob-
ability indicates the chance of that transition being
taken. The action describes what action to take when
the transition is used, and the clock indicates how long
to wait before firing the transition. The behavior of a
PTA is similar to that of a timed automaton (Alur and
Dill, 1994): in any location, time can advance as long
as the invariant holds, and a probabilistic transition
can be taken if its guard is satisfied by the current val-
ues of the clocks. Every automaton has an end loca-
tion, depicted with a double circle, which will even-
tually be reached. It is possible to specify loops in
the automaton. We note that not all transitions have
both a guard and a probability. For simplicity, we do
not explicitly specify location invariants, but they im-
plicitly evaluate to true. One such workload model is
created for each identified user type.
Model-basedPerformanceTestingofWebServicesusingProbabilisticTimedAutomata
101
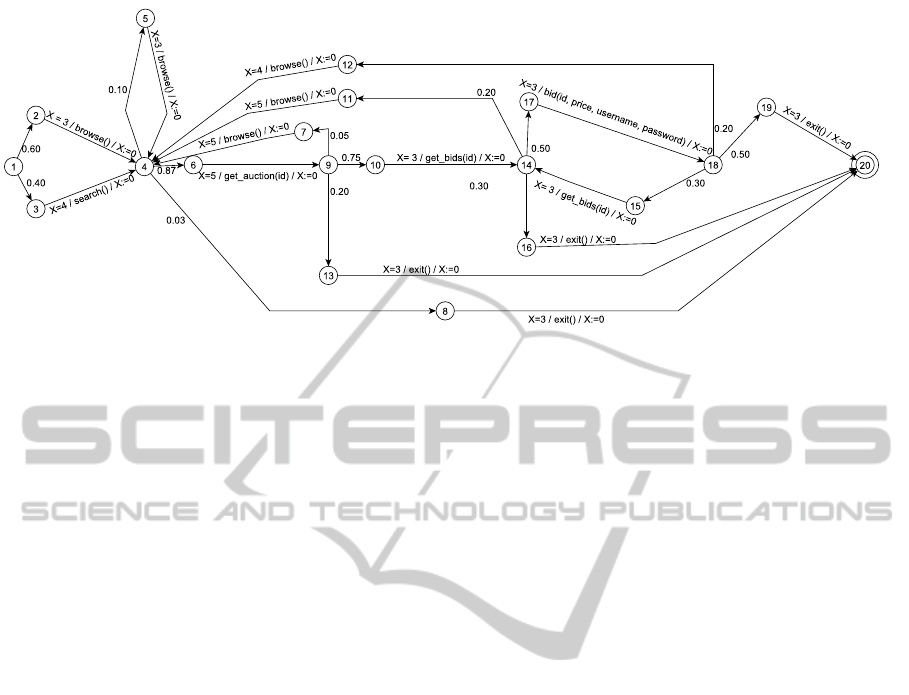
Figure 3: PTA model for an aggressive-bidder user type.
3.3 Load Generation
The resulting workload models are used for generat-
ing load in real-time against the system under test, by
creating traces from the corresponding PTA. The user
types are selected based on their reciprocal distribu-
tion. The PTA of each user type will be executed con-
currently by selecting the corresponding actions and
sending them to the system. By executing the PTA of
a given user, in each step an action is chosen based on
the probabilistic values in the automaton.
The load generation is based on a deterministic
choice with a probabilistic policy. This introduces
certain randomness into the test process and that can
be useful for uncovering certain sequences of ac-
tions which may have a negative impact of the perfor-
mance. Such sequences would be difficult or maybe
impossible to discover if static test scripts are used,
where a fixed order of the actions is specified, and re-
peated over and over again. Every PTA has an exit
location which will eventually be reached. By modi-
fying the probability for the exit action, it is also pos-
sible to adjust the average length of the generated se-
quences.
3.4 Performance Monitoring
During the load generation, we constantly monitor
target KPIs for the entire test duration. At the end,
we collect all the gathered data and compute descrip-
tive statistics, like the mean and peak response times
for different actions, number of concurrent users, the
amount of transferred data, the error rate, etc. All the
gathered information is presented in a test report. The
resource utilization of the system under test is also
monitored and reported. Besides computing different
kinds of statistical values from the raw data we have,
the test report also contains graphs such as how the
response time varied over time with the number of
concurrent users. The test report also shows the CPU,
disk, network and memory usage on the target system.
Tool support for load generation is provided via
the MBPeT tool (Abbors et al., 2012). Due to space
limitations we defer more details about the approach
and support to (Ahmad et al., 2013)
4 CASE STUDY AND
EXPERIMENTS
In this section, we demonstrate our approach by us-
ing it to evaluate the performance of an auction web
service, generically called YAAS. The YAAS applica-
tion was developed as a stand-alone application and is
used for the evaluation of our approach. The YAAS
has a RESTful (Richardson and Ruby, 2007) interface
based on the HTTP protocol and allows registered
users to create, change, search, browse, and bid on
auctions that other users have created. The applica-
tion maintains a database of the created auctions and
the bids that other users have placed on the auctioned
objects. The YAAS application is implemented us-
ing Python (Python, 2012) and the Django (Django,
2012) framework.
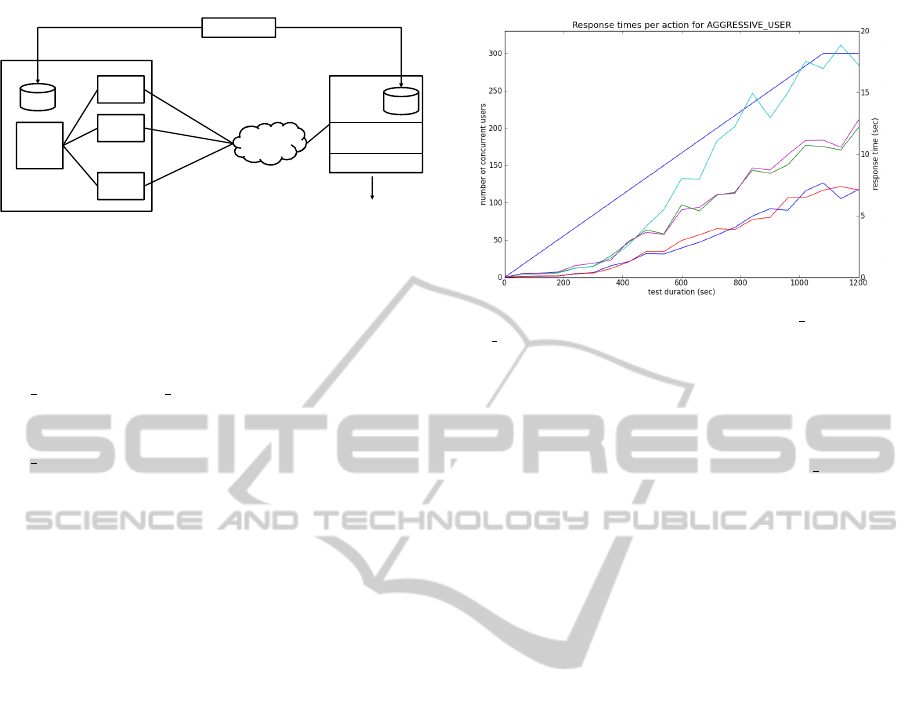
Test Architecture. The test architecture is shown in
Figure 4. The MBPeT tool has a scalable architec-
ture where a master node controls several slave nodes.
The SUT runs an instance of the YAAS application
on top of the Apache web server. All nodes (master,
slaves, and the server) feature an 8-core CPU, 16 GB
of memory, 1Gb Ethernet, 7200 rpm hard drive, and
Fedora 16 operating system. The nodes were con-
nected via a 1Gb Ethernet.
A populator script is used to generate input data
(i.e., populate the test databases) on both the client
and server side, before each test session. This ensures
WEBIST2013-9thInternationalConferenceonWebInformationSystemsandTechnologies
102
1GB
Slave
Node 1
Slave
Node 2
Master
Node
Slave
Node N
.
.
Monitoring tools
Apache
YAAS
DB
DB
Populator
Ethernet
Server
Dstat
Figure 4: A caption of the test architecture.
that the test data on either side is consistent and easy
to rebuild after each test session.
Workload Modeling. We analyzed the workload fol-
lowing the steps described in Section 3. Based on
this analysis, three user types were identified: aggres-
sive bidders, passive bidders, and non-bidders. From
this information, we constructed a PTA model for
each user type. Figure 3 shows the PTA for a aggres-
sive bidder.
Figure 3 shows that each action has a think time
parameter, modeled as a clock variable associated
with it, that specifies how much time should elapse
before firing a transition. This variable is denoted
with the symbol X and it is reset to 0 after the tran-
sition is fired. Upon firing the transition, the action
associated with that transition is sent to the SUT.
Adapter. An adapter is used to translate abstract ac-
tions generated from the model into concrete HTTP
requests by adding the necessary HTTP parameters
and encapsulation to the SUT. All slaves run identi-
cal adapters. The models as such are system inde-
pendent, but an adapter module need to be written for
every system that one chooses to interface with. Since
YAAS is based on the HTTP protocol, it will under-
stand the basic HTTP commands like GET, POST,
PUT, etc. Whenever a new action is selected from
the model, the corresponding HTTP request is created
and, when needed, the associated data is automati-
cally attached to the request from the local database.
Experiments. In the case study, an experiment was
conducted to find out how the YAAS application per-
forms under load. As a rule of thumb for ensuring
accurate results, the experiment was run three times.
In the experiment, we set out to test how many
concurrent users the host node can support without
exceeding the specified target response time values.
Table 1 shows the average and max response time
limits (see column Target Response Time) that were
selected for each type of action. For instance, the av-
erage response time limit for action browse() was set
to 4.0 seconds, while the max response time was set to
8.0 seconds. If any of the set limits (average and max)
are breached during the test run, the tool will mark the
time of the breach and the number of concurrent users
Figure 5: Average response times for get auction and
get bids (bottom), search and browse (middle), and bid
(top) when ramping up from 0 to 300 users.
at that time (see Table 1 - Time of breach). The length
of the test run was 20 minutes (1200 seconds). Fig-
ure 5 shows how the response times of different ac-
tions increase over time for the aggressive user type
as the number of concurrent users are ramped up from
0 to 300. In this experiment the tool generated a total
of 1504 unique test sequences form the models. Sev-
eral of the unique test sequences were executed more
than 100 times and the variance on the test sequence
length was from 1 up to 50 actions.
Table 1 also shows the time when a target response
time (average and/or max) value was exceeded and
the number of concurrent users at that time. For ex-
ample, the average response time for the search() ac-
tion was exceeded at 229 seconds into the test run by
the aggressive user type. The tool was when running
64 concurrent users. Form this table we concluded
that the current configuration of the server can sup-
port a maximum of 64 concurrent users before ex-
ceeding the threshold value of 3 seconds set for action
search(). A closer inspection of the monitored values
of the server showed that the database was the bottle-
neck, due to the fact a sqlite database was used and
the application locked the whole database for write
operations.
Additional experiments, including a comparison
of our approach against JMeter can be found in (Ah-
mad et al., 2013). The experiment showed that out
tool has similar capabilities as JMeter for instance
when comparing the throughput (actions/sec) against
the SUT.
5 CONCLUSIONS AND FUTURE
WORK
In this paper, we have presented a model-based
performance testing approach that uses probabilistic
Model-basedPerformanceTestingofWebServicesusingProbabilisticTimedAutomata
103

Table 1: Response time measurements for user actions when ramping up from 0 to 300 users.
Target Response Time Non-Bidders (22 %) Passive Users (33 %) Aggressive users 45 % Verdict
Actions Average Max Time of Time of Time of Time of Time of Time of Pass/fail
(sec) (sec) breach (sec) breach (sec) breach (sec) breach (sec) breach (sec) breach (sec)
browse() 4.0 8.0 279 (78 users) 394 (110 users) 323 (90 users) 394 (110 users) 279 (78 users) 394 (110 users) Failed
search(string) 3.0 6.0 279 (78 users) 394 (110 users) 279 (78 users) 394 (110 users) 229 (64 users) 327 (92 users) Failed
get action(id) 2.0 4.0 280 (79 users) 325 (91 users) 279 (78 users) 279 (78 users) 276 (77 users) 325 (91 users) Failed
get bids(id) 3.0 6.0 279 (78 users) 446 (130 users) 325 (91 users) 394 (110 users) 327 (92 users) 394 (110 users) Failed
bid(id,price, username, password) 5.0 10.0 —- —– 327 (92 users) 474 (132 users) 328 (92 users) 468 (131 users) Failed
models to generate synthetic load in real-time. The
models are based on the Probabilistic Timed Au-
tomata, and include statistical information that de-
scribes the distribution between different actions and
corresponding think times. With the help of probabil-
ity values, we can make it so that a certain action is
more likely to be chosen over another action, when-
ever the virtual user encounters a choice in the PTA.
We believe that the PTA models are well suited for
performance testing and that the probability aspect
that the PTA holds is good for describing dynamic
user behavior, allowing us to include a certain level
of randomness in the load generation process. This is
important because we wanted the virtual users to be
able to mimic real user behavior as closely as possi-
ble, and minimize the effect of caches on the perfor-
mance evaluation.
The approach is supported by a set of tools, in-
cluding the MBPeT load generator. MBPeT has a
scalable distributed architecture which can be easily
deployed to cloud environments. The tool has a ramp-
ing feature which describes at what rate new users are
added to the system and also supports the ability to
specify a think time. When the test duration has ended
the MBPeT tool will gather measured data, process it
and create a test report.
In the future we will look into if parts of the model
creation can be automated. At the moment it is done
manually. There are indications that certain parts of
creating the models can be automated e.g. by auto-
matically analyzing the log data and using different
clustering algorithms.
REFERENCES
Abbors, F., Ahmad, T., Truscan, D., and Porres, I. (2012).
MBPeT: A Model-Based Performance Testing Tool.
2012 Fourth International Conference on Advances in
System Testing and Validation Lifecycle.
Ahmad, T., Abbors, F., Truscan, D., and Porres, I. (2013).
Model-Based Performance Testing Using the MBPeT
Tool. Technical Report 1066, Turku Centre for Com-
puter Science (TUCS).
Alur, R. and Dill, D. L. (1994). A theory of timed automata.
Theor. Comput. Sci., 126(2):183–235.
Barna, C., Litoiu, M., and Ghanbari, H. (2011). Model-
based performance testing (NIER track). In Proceed-
ings of the 33rd International Conference on Software
Engineering, ICSE ’11, pages 872–875, New York,
NY, USA. ACM.
Calzarossa, M., Massari, L., and Tessera, D. (2000). Work-
load Characterization Issues and Methodologies. In
Performance Evaluation: Origins and Directions,
pages 459–481, London, UK, UK. Springer-Verlag.
Denaro, G., Polini, A., and Emmerich, W. (2004). Early
performance testing of distributed software applica-
tions. In Proceedings of the 4th international work-
shop on Software and performance, WOSP ’04, pages
94–103, New York, NY, USA. ACM.
Django (2012). Online at https://www.djangoproject.com/.
Ferrari, D. (1984). On the foundations of artificial work-
load design. In Proceedings of the 1984 ACM SIG-
METRICS conference on Measurement and modeling
of computer systems, SIGMETRICS ’84, pages 8–14,
New York, NY, USA. ACM.
Kwiatkowska, M., Norman, G., Parker, D., and Sproston,
J. (2006). Performance analysis of probabilistic timed
automata using digital clocks. Formal Methods in Sys-
tem Design, 29:33–78.
Menasce, D. A. (2002). Load Testing of Web Sites. IEEE
Internet Computing, 6:70–74.
Menasce, D. A. and Almeida, V. (2001). Capacity Plan-
ning for Web Services: metrics, models, and methods.
Prentice Hall PTR, Upper Saddle River, NJ, USA, 1st
edition.
Mosberger, D. and Jin, T. (1998). httperfa tool for measur-
ing web server performance. SIGMETRICS Perform.
Eval. Rev., 26(3):31–37.
Petriu, D. C. and Shen, H. (2002). Applying the UML
Performance Profile: Graph Grammar-based Deriva-
tion of LQN Models from UML Specifications. pages
159–177. Springer-Verlag.
Python (2012). Python programming language. Online at
http://www.python.org/.
Richardson, L. and Ruby, S. (2007). Restful web services.
O’Reilly, first edition.
Ruffo, G., Schifanella, R., Sereno, M., and Politi, R. (2004).
WALTy: A User Behavior Tailored Tool for Evaluat-
ing Web Application Performance. Network Comput-
ing and Applications, IEEE International Symposium
on, 0:77–86.
SeleniumHQ (2012). Online at http://seleniumhq.org/.
Shams, M., Krishnamurthy, D., and Far, B. (2006). A
model-based approach for testing the performance of
web applications. In SOQUA ’06: Proceedings of the
3rd international workshop on Software quality assur-
ance, pages 54–61, New York, NY, USA. ACM.
Shaw, J. (2000). Web Application Performance Testing –
a Case Study of an On-line Learning Application. BT
Technology Journal, 18(2):79–86.
WEBIST2013-9thInternationalConferenceonWebInformationSystemsandTechnologies
104
