
Improving Modeling with Layered UML Diagrams
Harald St
¨
orrle
Department of Informatics and Mathematical Modeling, Technical University of Denmark,
Richard Petersens Plads, 2800 Lyngby, Denmark
Keywords:
Model based Development, Model Structuring, Diagram Presentation.
Abstract:
Layered diagrams are diagrams whose elements are organized into sets of layers. Layered diagrams are rou-
tinely used in many branches of engineering, except Software Engineering. In this paper, we propose to add
layered diagrams to UML modeling tools, and elaborate the concept by exploring usage scenarios. We vali-
date the concept by implementation, lab assessments, and field testing. We conclude that layers enhance and
complement conventional diagrams and model structuring techniques, are easy to add to existing modeling
infrastructure, and are easy to apply by modelers.
1 INTRODUCTION
In a previous survey (St
¨
orrle, 2007), we have found
that models in industry can grow to substantial sizes.
We have also found that there are some very large
diagrams, that is, diagrams representing hundreds or
thousands of model elements. Often, these are also
very important diagrams in the sense that they are
widely used and play a central role in the organiza-
tions that created them; frequently, posters created
from these diagrams can be found on many office
walls. For such big diagrams, organizing and struc-
turing the underlying models and their presentation as
diagrams becomes a major challenge (St
¨
orrle, 2010).
Today, we have only few practical and widely avail-
able methods to structure diagrams, and they have sig-
nificant shortcomings. As a remedy, we propose to
add layering features to UML modeling tools, emu-
lating graphic design tools like Adobe Illustrator or
Photoshop.
A layer groups a set of presentation elements to
express some commonality of the model elements vi-
sualized by the corresponding presentation elements.
As a shorthand, we will often refer to the model el-
ements of a layer, meaning the model elements pre-
sented by the presentation elements placed on a layer.
A layered diagram is a diagram with an ordered set
of layers. There are contexts where “model” and “di-
agram” are synonymous, but this is not the case for
most UML modeling tools. Layers as we discuss
them in this paper have no impact to the underlying
models, they are only used to structure diagrams.
The placement of elements on layers is not part of
the model as such. Thus, the constraints or relation-
ships between the model elements as implied by the
modeling language (e.g., the UML meta model) do
not constrain the placement of corresponding presen-
tation elements on layers. Thus, a layer does not have
to be a correct or complete UML diagram by itself—
only the combination of all layers together has to sat-
isfy the same language-induced constraints as a con-
ventional diagram. Fig. 1 contrasts the concepts used
in layered diagrams with those used in conventional
diagrams. Obviously, the conceptual differences are
small, which helps with the implementation of lay-
ered diagrams.
Each set of layers may be shown or hidden inde-
pendently, so that n layers allow 2
n
combinations of
visible layers. Also, layers may be selectively locked
so that they stay visible, but are not affected by ma-
nipulations. Finally, layers may be used to select the
input to semantic model operations such as union, in-
tersection, or difference by simply computing the set
of model elements presented by a set of layers. Ele-
ments may also be placed on layers dynamically by
filters, such that there are layers to collect model ele-
ments based on their type, the presence of an error or
annotation, their time of creation, and so on.
2 RELATED WORK
Today, very few UML modeling tools offer layer-
ing; the only two exceptions we know of are Visu-
206
Störrle H..
Improving Modeling with Layered UML Diagrams.
DOI: 10.5220/0004337302060209
In Proceedings of the 1st International Conference on Model-Driven Engineering and Software Development (MODELSWARD-2013), pages 206-209
ISBN: 978-989-8565-42-6
Copyright
c
2013 SCITEPRESS (Science and Technology Publications, Lda.)
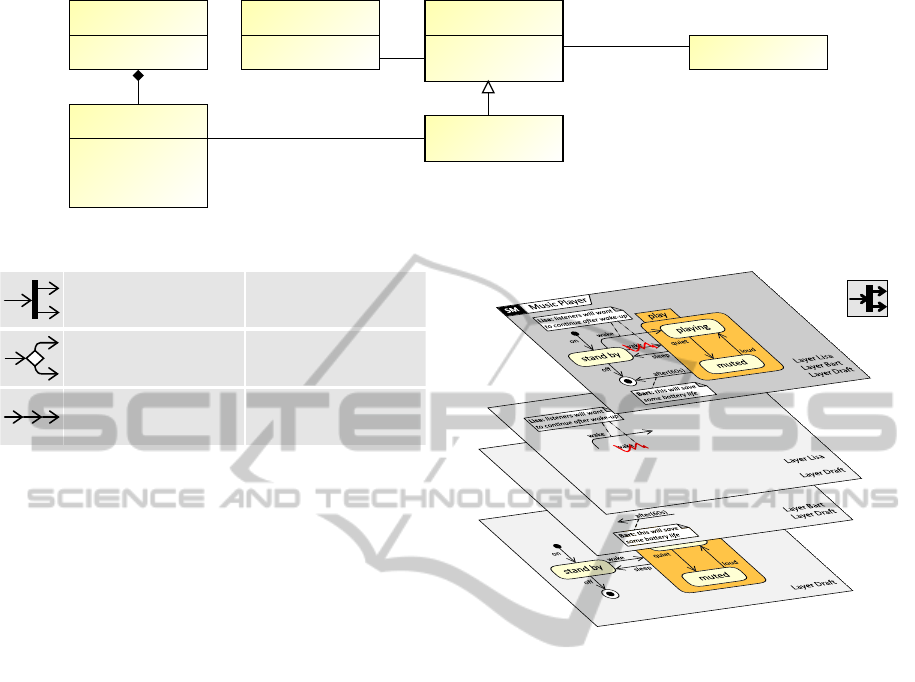
ModelElement
Layer
name: String
isVisible: Bool
isLocked: Bool
isFrozen: Bool
1..* {ordered}
ConvenonalDiagram
layout
diagram type
layer
PresentaonElement
* *
*
1
presentaon
subject
posion: xyCoordinate
shape: ShapeEnum
. . .
*
1
LayeredPE
layout
diagram type
LayeredDiagram
Figure 1: Comparing conventional diagrams with layered diagrams from a conceptual perspective.
Alternave Models
Sequenal Models
- consecuve steps or stages
- temporal evoluon of model
- increasing/decreasing levels of detail (zoom)
- compeng variants
- diverging versions
- overlapping branches
Scenarios for using layers in UML modeling
Benefits
Benefits
- orthogonal angles or viewpoints
- independent contribuons (e.g., comments)
- oponal aspects, features, or qualies
Orthogonal Models
- n layers replace 2
n
separate views
- merge n contribuons while keeping traces
- easy combinaon of subsets
Benefits
- provide connected layouts
- avoid cascading changes
- allow also for branching evoluon
- avoid redundancy in overlapping submodel
- easy switching between alternaves
- combine n branches in a single diagram
Figure 2: Some scenarios where using layers can improve
UML modeling practice.
alParadigm (www.visual-paradigm.com) and Trinity
(Peltonen et al., 2010). Without layers, modelers
could use multiple independent diagrams for each as-
pect. Clearly, the number of views may grow expo-
nentially with the number of independent aspects –
not so with layers. Alternatively, modelers might use
annotations or color coding to deal with orthogonal,
alternative, or sequential views. Again, this works for
small numbers of views, but is limited by the built-
in limitations of the human visual apparatus. Using
animated and 3d-models (see (Gogolla et al., 1999;
McIntosh, 2009)) is limited by the challenging nature
of navigating even small 3d models.
3 LAYER USAGE SCENARIOS
We describe three scenarios to highlight the short-
comings of existing model structuring mechanisms
and point out how layers can help address the issue;
Fig. 2 provides an overview. All three scenarios are
straightforward and common in large scale domain
modeling.
Orthogonal Models. Consider the case of model
dimensions, i.e., models that capture orthogonal an-
gles, points of view, or dimensions, such as indepen-
dent product aspects, features, or qualities. Consider
a model under review by several people. Assume that
the reviewers document their remarks as model an-
notations “in place”. At some point, the remarks are
Figure 3: Layers for orthogonal aspects.
joined together yielding a common model with all re-
view remarks in it. Simply merging different models
has several disadvantages: (1) the resulting diagrams
can become quite crowded and confusing when there
are many comments on one issue; (2) extra effort is
required to ensure that every comment can be traced
to the reviewer responsible for it; (3) the model might
become inconsistent and difficult to understand when
reviewers propose competing solutions to an issue.
When using layers, however, each review may use
an individual layer (or set of layers) for his or her
contributions. This way, we may selectively switch
between different reviewers’ viewpoints, but still can
see several reviewers’ comments simultaneously, if
required. Also, it is always clear who the author of a
comments is, by simply looking at the layer on which
the contribution resides. Fig. 3 shows a small example
of using layers in this scenario.
Alternative Models. Consider the case of model-
ing alternatives, i.e., models that capture compet-
ing solutions to a given problem, diverging variants
of designs, or branching versions. For instance, a
model may document variants of business process im-
ImprovingModelingwithLayeredUMLDiagrams
207
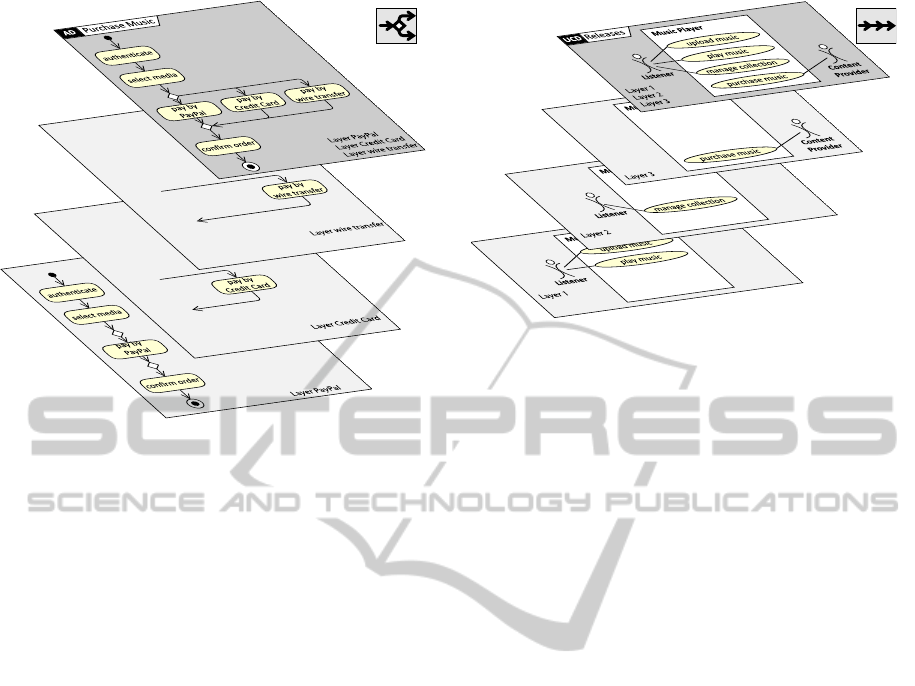
Figure 4: Layers for alternatives.
plementations deployed to different customers (see
Fig. 4). Assume that the alternatives have commonal-
ities as well as differences.
Of course one could simply join all alternatives
into a single model, but this will make it difficult to
distinguish variants. Also, only those parts where all
variants overlap (i.e., the intersection of all alterna-
tives) may be factored out, so that model parts may
have to be stored redundantly, which may lead to in-
consistencies and model clones. When using layers,
however, each alternative may use a separate layer,
see Fig. 4. Discarding an alternative amounts to dis-
carding a layer with all the model elements it refers
to. There is also no need to store overlapping model
fragments redundantly, since the modeler may choose
to show all layers that contribute elements to an alter-
native.
Sequential Models. Consider the case of model se-
quences, i.e., models consisting of subsequent stages
to document an evolution of refinement or elabora-
tion, such as the visualization of a projects’s release
schedule. Now, assume that a sequence of use case
diagrams is used to represent a series of increments
planned to be produced over time (see Fig. 5 for an
example). Each increment contains a set of actors and
use cases that adds to the previous elements.
Showing all increments simultaneously in one di-
agram will make it difficult to see the progress over
time and the individual contribution per increment.
Using an individual diagram for each stage results in
a large number of diagrams that are hard to maintain:
changes to the i-th diagram of a sequence of n dia-
Figure 5: Layers for sequential stages.
grams will have to be reflected in all diagrams from
i + 1 to n, or the model’s audience will be confused
about changing layouts. Using layers, on the other
hand, each increment can be placed on its own layer.
Thus, they can easily be shown in isolation, or as part
of a set. Changing the elements of the i-th layer is
immediately visible in all layers above i.
4 VALIDATION
We validated our proposal in three ways. First, we im-
plemented it to explore any inherent hidden technical
difficulties, which proved to be more or less straight-
forward.
Second, we studied the outcome in controlled en-
vironments with expert modelers from academia and
industry, and interviewed the participants and log-
ging problems and shortcomings to be amended. We
asked graduate students to model the GUI of a calen-
dar application using AIDE (without layering). The
resulting UML StateMachine consisted of 178 States
(nested up to 9 levels deep) and 218 Transitions, pre-
sented in a single diagram. The facilities for navi-
gating large diagrams that were available at this point
(zooming and locator-maps) were clearly inadequate
for diagrams of this size. Next, we added layer-
ing support to AIDE, and asked students to restruc-
ture these models using layers. We logged problems
and shortcomings, resulting in a list of bugs, none
of which indicated conceptual problems with layers.
This case study clearly showed that layers can be used
in modeling StateMachines with great benefit. In par-
ticular, navigating a large diagram and focusing on
specific parts or aspects becomes very easy. Structur-
ing the model presentation by placing model elements
on up to 20 layers greatly helped, and handling so
MODELSWARD2013-InternationalConferenceonModel-DrivenEngineeringandSoftwareDevelopment
208

many layers posed no significant problem. Defining
the “right” layers, however, requires a certain amount
of thought. We speculate that the exact nature of lay-
ers is specific to the application domain and model
purpose. We also presented the improved AIDE to 22
expert modelers from industry and academia and col-
lected their opinions in order to establish the valid-
ity of our earlier findings in a larger and more diverse
populations. The feedback was unanimously positive:
all experts immediately saw the potential benefit of
layers in their respective fields and could well imagine
using such a feature in previous and current projects.
Some of them readily proposed more examples of us-
age scenarios.
Third, we field tested our approach by using it in
the classroom in a UML modeling course. No is-
sues related to layering appeared. Some student teams
used layering in unexpected ways, e.g., to separate
different diagram regions for splitting and merging
work. Students also exploited the layers in their pre-
sentations. Note that the students had only been in-
formed of the existence of layers, without any form
of training in their usage; the students invented these
usage scenarios ad hoc. We conclude that, on the one
hand, that the adoption of layers might be supported
by creating a stack of appropriately named default
layers. On the other hand, more focus ought to be
put on supporting collaboration through layers.
5 CONCLUSIONS
In this paper we propose layers to structure large dia-
grams. We illustrate the benefits of layers using three
realistic and common usage scenarios. We validate
our proposal by implementation, case study analy-
sis, and field test. We find that layers complement
conventional diagrams by providing dependent views,
which may drastically reduce the number of diagrams
in some situations. In contrast to existing approaches
like 3d and animated UML diagrams, layered dia-
grams offer three benefits: (1) the concepts are com-
monly used in many fields and easy to understand and
apply; (2) there are many useful application scenarios
for layered diagrams; (3) layers are easy to implement
in modeling tools.
While we have already explored many application
scenarios, there seem to be even more (e.g., version
control, group collaboration, or pseudo-animation).
More extensive qualitative research is needed to bet-
ter understand the extent and limits of layers in UML
modeling. Also, a more thorough investigation into
the benefit of layers is clearly needed.
REFERENCES
Gogolla, M., Radfelder, O., and Richters, M. (1999). To-
wards three-dimensional representation and animation
of UML diagrams. In Proc. 2nd Intl. Conf. Unified
Modeling Language, pages 489–502. Springer Verlag.
Gorton, I., Cuesta, C. E., and Babar, M. A., editors (2010).
Proc. 4th Eur. Conf. Sw. Architecture (ECSA’10):
Companion Volume. ACM.
McIntosh, P. M. (2009). X3D-UML: User-Centred De-
sign, Implementation and Evaluation of 3D UML Us-
ing X3D. PhD thesis, RMIT University.
Peltonen, J., Felin, M., and Vartiala, M. (2010). From a
Freeform Graphics Tool to a Repository Based Mod-
eling Tool. In (Gorton et al., 2010), pages 277–284.
St
¨
orrle, H. (2007). Large Scale Modeling Efforts: A Survey
on Challenges and Best Practices. In Hasselbring, W.,
editor, Proc. IASTED Intl. Conf. Software Engineer-
ing, pages 382–389. Acta Press.
St
¨
orrle, H. (2010). Structuring very large domain models:
experiences from industrial MDSD projects. In (Gor-
ton et al., 2010), pages 49–54.
ImprovingModelingwithLayeredUMLDiagrams
209
