
A MapReduce Architecture for Web Site User Behaviour Monitoring
in Real Time
Bill Karakostas
1
and Babis Theodoulidis
2
1
School of Informatics, City University London, Northampton Square, London, U.K.
2
Manchester Business School, University of Manchester, Booth Street West, Manchester, U.K.
Keywords: Real Time MapReduce, Data Stream Analysis, Web Log Analysis, Web Mining, Erlang.
Abstract: Monitoring the behaviour of large numbers of web site users in real time poses significant performance
challenges, due to the decentralised location and volume of generated data. This paper proposes a
MapReduce-style architecture where the processing of event series from the Web users is performed by a
number of cascading mappers, reducers and rereducers, local to the event origin. With the use of static
analysis and a prototype implementation, we show how this architecture is capable to carry out time series
analysis in real time for very large web data sets, based on the actual events, instead of resorting to sampling
or other extrapolation techniques.
1 INTRODUCTION
The ability to analyse the behaviour of a process
based on a history of observed events in order to
forecast future behaviour, and based upon that make
decisions, is important for many types of business
and other command and control systems.
One type of application requiring trends analysis
and forecasting based on past observations are web
sites used for e-commerce, e-government and other
similar purposes. Decisions aim to optimise their
operation or to maximise their effectiveness, in for
example, selling to the maximum number of
customers or serving the maximum number of
citizens. Web-based business processes are
considered as traffic intensive applications, since the
number of users can fluctuate dramatically within a
short time (Pun and Si, 2009), thus often requiring
decision making in real time.
Also, applications such as personalization, user
feedback, malicious traffic detection, and real-time
search require both very fast response and scalability
(Royans, 2010). Other reasons why a web site needs
to be monitored in real time includes:
Identifying flash crowd situations in which the
server can no longer handle overwhelming
service requests (Pun and Si, 2009).
Assessing the effectiveness of a business
marketing campaign in order to amplify it or
modify it in real time, for example monitoring
user traffic to the web page of a product that is
under promotion, in order to, for example, adjust
the promotion parameters or ensure that enough
stock is available to meet demand.
Traditionally, attempts to understand user behaviour
were done through analysis of web logs. A web log
is a record of user data as captured by a web server
and includes for example the time spent on the web
site, total value of transactions made and so on. One
of the main problems with this approach is that web
logs can reach several gigabytes in size, making the
need for specialised storage and analysis software
(data warehouse). For example, the weblog of
Amazon is reported to be in excess of 15 Gigabytes
(Devi et al., 2012). Also, the data in these large-scale
weblogs often comes from multiple sources, and
existing algorithms do not address the distributed
nature of such data.
However, the main obstacle in attempting to
mine user behaviour from web logs is that this is not
a real time method. It can take several hours before
useful user behaviour patterns are extracted from a
large web log. Such time gap makes this approach
unsuitable for time critical applications, such as for
example, detecting a denial of service (DoS) attack
on the web site. A real time approach to web user
behaviour monitoring, on the other hand, would
require a dedicated architecture for data capture
45
Karakostas B. and Theodoulidis B..
A MapReduce Architecture for Web Site User Behaviour Monitoring in Real Time.
DOI: 10.5220/0004332600450052
In Proceedings of the 2nd International Conference on Data Technologies and Applications (DATA-2013), pages 45-52
ISBN: 978-989-8565-67-9
Copyright
c
2013 SCITEPRESS (Science and Technology Publications, Lda.)

from distributed sources, distributed processing of
the data for statistical analysis, pattern identification,
and finally centralised processing of the
consolidated results. However, existing formalisms
and methods of inference have not been effective in
real-time applications, where tradeoffs between
decision quality and computational tractability are
essential (Arsham, 2012).
This paper proposes such an architecture that
follows the MapReduce paradigm, but is adapted for
real time usage. The architecture consists of layers
of mappers, reducers and rereducers, that
successively perform data aggregation and feed the
consolidated results to a decision making tool.
The main contribution of this paper are as
follows:
It proves theoretically and with experiments, that
the proposed architecture can be used to analyse
web user data in real time for large numbers of
concurrently connected users, i.e. ranging to
hundreds of thousands of users.
The proposed approach does not require
dedicated or specialised software or hardware
such as real time databases and high performance
servers, as all the processing is performed by the
same web servers, or other commodity hardware
used by the web site.
The remaining of the paper is structured as follows.
Section 2 analyses the different approaches to web
user behaviour analysis and also the use of
MapReduce style processing for real time analysis of
web logs. Section 3 presents the proposed
architecture and carries out a theoretical analysis of
its performance. Section 4 presents experimental
results from the prototype implementation of the
architecture and its performance in a simulated web
site with varying numbers of connected users.
Finally, the paper concludes with further
improvements to the proposed architecture and its
integration with other technologies for user
behaviour analysis.
2 LITERATURE REVIEW
In the past decade, the importance of analyzing
systems logs has grown, because log data constitute
a relevant aspect in evaluating the quality of such
systems (Agosti et al., 2012). For online systems
serving large numbers of users such as e-commerce
and e-business sites, analysis of such logs serves not
only for understanding system behaviour, but also
for user behaviour analysis, through mining. This
section first surveys approaches to web log data
analysis, and their applications in user behaviour
mining, and then considers the more recent category
of distributed, parallel and real time web log analysis
algorithms and techniques.
2.1 User Behaviour Mining and
Analysis from Web Logs
System log analysis has been used for performance
analysis, i.e. for understanding workloads and
improvement purposes (Iyengar et al., 1999). System
logs produced by distributed systems are also often
used for troubleshooting and problem diagnosis (Fu
et al., 2009), as detection of execution anomalies
such as workflow errors and performance issues is
very important for the maintenance, development,
and performance refinement of large scale
distributed systems (Fu et al., 2009). For example, in
(Sugaya et al., 2011) an online log analysis
architecture and an extensible framework for
detecting errors and faults in the target real-time
system is proposed.
A more popular application of web log analysis,
is for mining knowledge about the user behaviours,
and through that, understand the users better. This in
turn, can lead to more effective, i.e. more
personalised, responsive, and profitable web sites.
One of the objectives of user behaviour mining is to
discover frequent patterns of web site usage
concentrated over a period of time, or very long
sequential patterns. (Masseglia et al., 2002).
Users leave the trails of their interaction with the
web site in various places, such as in web logs,
queries, etc. One reported approach, for example to
infer user behaviour is through the analysis of their
web search query logs (Cayci et al., 2009). Thus,
identification of patterns and trends in the user
behaviour over large scale web site deployment can
utilise different sources of logged data. Web log files
therefore, can be analyzed to identify usage and
access trends (Sudhamathy, 2010). Decision trees
have also been proposed for web user behaviour
analysis. This includes prediction of user future
actions and the typical pages leading to browsing
termination (Pabarskaite, 2003). Another proposed
user mining technique is the application of
hierarchical unsupervised niche clustering to user
profiles (Hawwash and Nasraoui, 2010).
A number of approaches consider web originated
user data to be streams, to which stream analysis
techniques can be applied, i.e. algorithms for mining
and summarizing time series data (Li, 2011).
(Yoshino et al., 2011) for example, monitor resource
DATA2013-2ndInternationalConferenceonDataManagementTechnologiesandApplications
46

usage for web systems using real-time statistical
analysis of log data. (Campanile et al., 2007)
propose parsing of heterogeneous data streams based
on the definition of format-dependent grammars and
automatic production of adhoc parsers. They present
a working implementation of the approach in a
telecommunication environment for real-time
processing of billing information
flows. In (Zhang
et al., 2009) time series analysis is used to evaluate
predictive scenarios using search engine
transactional logs.
2.2 Distributed and Parallel
Architectures for User Behaviour
Mining
Since the early research in web mining of user data,
it became apparent that an ideal mining method
should provide frequent patterns in real time,
allowing the result to be available immediately
(Masseglia et al., 2001).
However, only recently, the state of the art in
real time processing of massive data sets has started
to make such techniques technically feasible.
Processing times for massive data sets have been
improved with the use of parallel techniques such as
MapReduce, a programming model and framework
that hides details of parallel execution and allow
users to focus only on data processing strategies
(Lee et al., 2011). However, data analytics for large
data sets such as web logs, traditionally use batch
processing systems such as Hive and Hadoop (Devi
et al., 2012)
Architectures for real time parallel processing of
web data streams are an emerging area of research.
Yahoo! Lab! for example, announced in 2010 a
general purpose, real-time, distributed, fault-tolerant,
scalable, event driven, expandable platform (S4)
which allows programmers to implement
applications for processing continuous unbounded
streams of data. S4 clusters are built using low-cost
commoditized hardware, and based on technologies
from Hadoop. S4 abstracts the input data as streams
of key-value pairs that arrive asynchronously and are
dispatched to processing nodes that produce data
sets of output key-value pairs (Royans, 2010). It is
always difficult, however, to decide how many
splitters, mappers and reducers must be there for an
optimal configuration (Zhang et al., 2010).
In conclusion, there is a generally acknowledged
requirement for efficient and scalable architectures
for analysing large volumes of web generated data.
However, the process of setting up and configuring
dedicated parallel and distributed architectures
capable of such task, that can also scale up
efficiently, is ad-hoc, and more research is required.
3 ARCHITECTURE
The proposed architecture of the system is illustrated
in Figure 1. Large web deployments such as clusters
of web servers can be accommodated by the
proposed architecture. A number of mappers and
reducers are assigned to each web server cluster to
capture and process in real time user generated
events. Aggregation of such events is done at the
reducer stage, and further aggregation of
summarised events across clusters is performed by
rereducers. The final aggregated results are
transmitted to appropriate decision support
application(s) and tools. All processing is done in
main memory, with no secondary storage used to
store the intermediate or final results.
Communication between processing nodes is carried
out using message passing.
The detailed formats of events and messages
processed and exchange is explained in the
following sections
.
Figure 1: Conceptual Architecture of the proposed
approach.
W eb server
Cluster
data
statistics
Event data
R educer
W eb server
W eb server cluster
W eb server
R educer
W eb server
W eb server cluster
M onitoring / DSS application
Re-
re du
cer
R eal tim e
statistics
AMapReduceArchitectureforWebSiteUserBehaviourMonitoringinRealTime
47

3.1 User Event Data
The structure of a typical record of user activity
captured in a web log looks as follows:
{Transaction ID, Date/time, fromPage, Operation
type, ToPage, Userid}
However, not all such records contain useful
information about user behaviour. This paper
suggests that to automatically analyse the behaviour
of a user group, it is first necessary to classify such
behaviour into distinct categories. We define as
interesting behaviour actions of user that cause an
important change in the user’s current state. For
users of an e-commerce site, for example, the
following types of user states could be considered as
interesting:
landed: the user has just visited the home page of
the web site,
browsing: the user is in a web site page (other
than the landing page ) for over a certain amount
of time
bounced: the user leaves the web site soon after
he/she lands on the web site (usually within a
few seconds). Because bouncing does not usually
captured by an explicit action such as clicking on
a link, it is recorded as user inactivity (timeout))
when a certain time has elapsed since the user
has landed
buying: a buy transaction has been recorded
under the user’s tracking id.
Moreover, we are interested in identifying such
behaviours over the total population of users i.e.
changes in the sizes of the above populations and the
size of flows between populations, in real time . We
are interested for example to know, at any time, how
many landed users 'bounce’, browse the web site, or
actually buy something
.
Figure 2 shows the state transition model for the
interesting user states.
Figure 2: State transition diagram for web site users.
As opposed to static, non real time analysis
which can be done on saved web logs, and
transaction data, real time analysis requires that the
user events that cause the above types of behaviour
are detected, classified correctly and aggregated
across all nodes on the web server cluster within
given time limits.
This information can then be sent to a decision
support tool to be visualised or even to trigger an
automatic decision. If such information is
transmitted sequentially to a decision support
application, real time performance requirements
cannot be easily met. On the other hand, if it is
transmitted in parallel, it can require a high
performance system that can process potentially
millions o request concurrently. Thus, a staged
processing architecture is required as explained in
the following section.
3.2 Key Architectural Concepts
The system architecture is illustrated in Figure 3. In
general, the architecture assumes a set E of event
types, n mappers, r reducers and rr rereducers. The
responsibility of a mapper is to collect events from a
cluster of web servers, classify them according to the
given taxonomy E, and emit c {e
k
, e(k), t} messages
at t
s
,
ts+1
, ... intervals, to its assigned reducer, where c
is the cardinality of E, e
k
is an event in E, and e(k) is
the number of events of type e
k
detected . As not all
event types are interesting, a mapper therefore acts
as both a classifier and a filter.
The task of a reducer is to collect messages
{e
k
, k
1
, t}, ..{e
n
, k
n
, t} sent by its assigned mappers,
and at intervals t aggregate those that are at most
time units before or after t, and send the aggregate
values to a rereducer rr as a series of messages {e1,
e1), t}, {e2,
e2), t}, ... {e
c
,
e2), t} where e1,
e2,... are all the members of E.
Rereducers, similar to reducers, aggregate event
populations but also carry out preprocessing of the
aggregated data before they submit to the final
receiving application. Thus, a rereducer will send
messages {Op, e, t} to the receiving application,
where Op is a data operation such as average, max,
min etc and e is a member of E.
Because the receiving application is not part of
the processing system, the paper does not prescribe
how it should process the received data. The
receiving application could, for example, act as a
further reducer, by aggregating data received from
several rereducers, or instead, process each data
received separately. For this purpose, it is also
recommended that rereducers include as part of the
bought
browsed
bounced
landed
DATA2013-2ndInternationalConferenceonDataManagementTechnologiesandApplications
48

message an indication of their coverage of the total
population, for example the number of clusters that
they aggregate. The application is expected to use
such information in order to compile several metrics
as to the quality of the received data, as explained in
the following section.
3.3 Performance Analysis
In general, a system that measures behaviour of
large numbers of events in real time can be
characterised by the following properties:
Coverage: This is defined as the percentage of
the total population that is being measured. For
example, if the total number of events is 1
million and 500,000of them are included in the
measurements, the coverage is said to be 50%
Resolution: This is measured as the time interval
between two measurements, whereas the smaller
the interval, the higher the resolution For
example, the resolution of measurements taken
every 1 mS is 1000 higher than the resolution for
measurements taken every 1 second.
Accuracy: This is a measure of the percentage of
events that are correctly reported as having
occurred at time t.
Delay D is the difference between the event
measurement of t and the time t’ is received by
the monitoring application.
Taking into account the above, the analysis of the
architectural components performance requirements
is as follows:
Assuming E event categories, N generated events
per time unit, M mappers, R reducers and RR
rereducers.
Each mapper performs N/M classification
operations per time unit and emits to its reducer
E messages.
Each reducer receives E *M/R messages
performs E*M/R additions and emit E messages
to its rereducer.
Finally, a rereducer receives E* R/RR messages
and performs E*R/RR operations such as min,
max, average, moving average etc, before
transmitting their output to the receiving
application.
Assuming that the times to generate transmit and
receive the messages are insignificant compared to
the time it takes to complete the main data
processing operations, from the above analysis it can
be noted that the delay D is a function of
max(t
classify
(N/M)) + max(E*M/Rt
addition
()) +
max(t
statistics
(E*R/RR))
Operations t
classify
and t
addition
can be parallelised,
unlike some of the operations in t
statistics
that involve
sorting or other not easily parallelisable operations.
Therefore, delay D which determines the real time
performance of the system can be controlled by
increasing the number of mappers, and by keeping
the ratios of mappers to reducers and reducers to
rereducers within limits that ensure that the
overheads of managing concurrent messaging
operations do not become significant compared to
the other operations.
Figure 3: Block diagram of the proposed real time web
user behaviour system.
The requirement that processing nodes at each
processing stage must have adequate processing
capacity to handle the expected number of messages,
can be illustrated by using an example. A 10% loss
of events at the mapper stage, combined with a 5%
loss at reducer and 2% loss at rereducer stages
respectively, will reduce the system’s coverage to
0.9*0.95*0.98 = 83% This suggests to avoid using
too many reducing stages, as well as to try to
minimise event losses at every processing stage.
4 EXPERIMENTS
We experimented with the proposed architecture by
developing a prototype in Erlang, a concurrent
AMapReduceArchitectureforWebSiteUserBehaviourMonitoringinRealTime
49
language that facilitates the implementation of large
numbers of distributed communicating nodes.
Mappers, reducers and rereducers are implemented
as Erlang functions, so that large numbers of those
can be spawned at runtime, according to the needs of
the simulation. A separate Erlang function is used to
simulate the web users, allowing the numbers of
generated events to be easily adjusted. The
following parameters were used for experimentation:
Number of simulated users (n): variable between
1000 and 1 million, with each user generating on
average 1 event every 10 seconds. Reflecting real
world patterns we set the frequencies of events to
be variable, with landing events having a
frequency of 1, bouncing events having a
frequency of 0.5 and buying events a frequency
of 0.1. This simulates the idea that a landed user
has a 0.5 probability to bounce, a 0.1 probability
to buy and a 0.4 probability to carry other
activities (e.g. browse).
Monitored event types: land, bounce and buy
Number of mappers (m) : variable and ranging
between n and n/100
Number of reducers: m/10
Number of rereducers:1
With the number and behaviour of the users
controlled by the simulator, the purpose of the
experiments were to validate that the user behaviour
was reproduced accurately in the receiving
application, and that the total delay incurred by the
processing stages did not exceed a maximum D, as
per the definitions in section 3.5. For this purpose,
the RRDtool a high performance data logging and
graphing system for time series data, was used as the
receiving application. To implement 100% coverage,
the interval with which data is fed into the RRDtool
was set equal to the data sending interval used by the
rereducer.
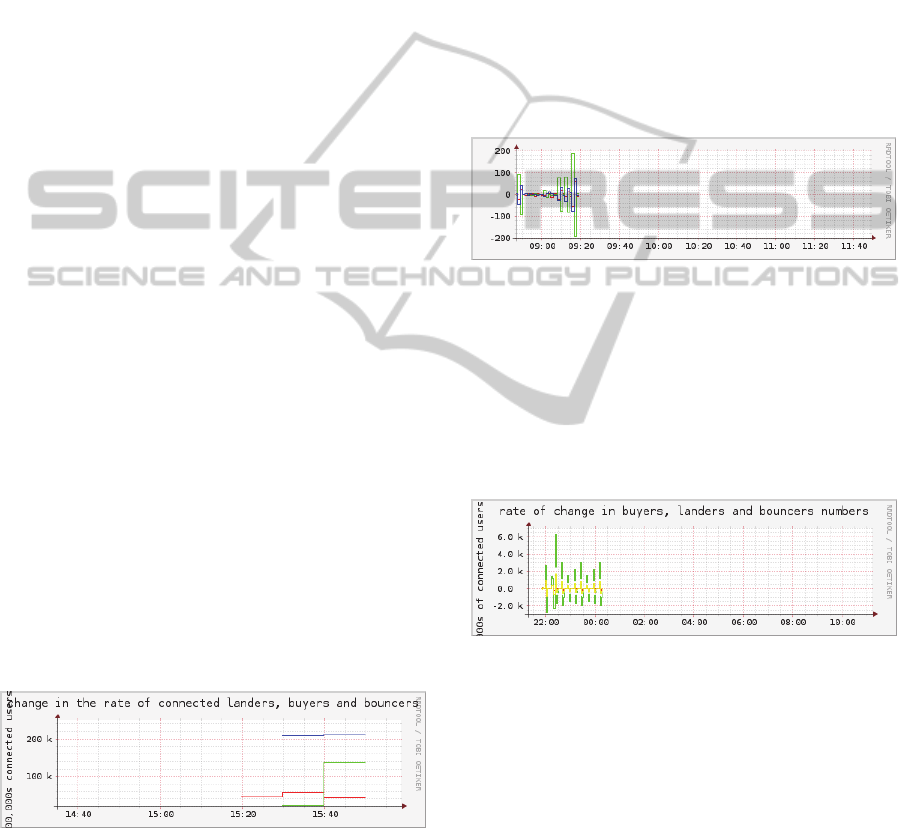
Figure 5: Visualising the behaviour of a 200k user
population.
Figure 5 shows the behaviour of the user
population by the changes to the numbers of
‘landers’ (shown in blue) , ‘bouncers’ (green) and
‘buyers’ (red), from a total user base of around
200,000 users, monitored over a period of 30
minutes, with measurements recorded every 10
seconds by the RRDtool. From the diagram, it can
be noted that the population of bouncers shows a
more sharp rate of increase over time, compared to
the other two populations, something expected, since
bouncers by definition leave the web site very soon
after they have landed. It must be also noted that
figures 5 to 7 show changes in rate rather than
moving averages, as over a sufficient long period the
later would normally smooth to an almost constant
rate. Figure 6 shows the rate of change for the
different populations for a smaller set of users
compared to Figure 5 (approximately 1000 users),
recorded with a frequency of 1 second by the
RRDtool.
Figure 6: Visualising the behaviour of a 1000 user
population.
As in Figure 5, ‘bouncers’ show the highest rate
of change. Figure 7 shows the behaviour of the
different user categories, but from a smaller user
base of around 10,000 users and over longer periods
(2 hours). Again, ‘bouncers’ show the largest
fluctuations in numbers, as expected.
Figure 7: Visualising population change rates for 10,000
web users.
As a final experiment, an attempt was made to
populate the RDDtool database concurrently, with
data from 100 mapper processes database
concurrently, with data from 100 mapper processes.
As expected,this experiment failed with the mapper
processes experiencing lock contention. This
confirmed the paper’s premise that a centralised
approach to web user data updating cannot scale up.
DATA2013-2ndInternationalConferenceonDataManagementTechnologiesandApplications
50

5 CONCLUSIONS AND
FURTHER RESEARCH
This paper has argued that real time analysis of web
user behaviour requires a suitably distributed and
multistage processing architecture, that collects and
analyses user behaviour data online rather than in
batch. Thus, in this paper’s proposed approach web
logs are not stored on files or databases, with
processing instead taking place in memory and near
to the source of the events, as they occur. The
approach utilises multiple processing stages in order
to improve performance, scalability and resilience.
Mappers, reducers and rereducers can be added and
withdrawn from the monitoring system, either due to
failures or because of other availability and
performance requirements.
The proposed system can be integrated with
various types of decision support, and other
command-and- control-type systems. Visualisation
tools can be used for example, to show in real time
the activity status for the whole web site,
highlighting areas and paths of high or low activity.
A high traffic path can for example indicate the
pages with the most visitors as well as the order they
were visited. Aberrant behaviour can also be
detected with this system, as when a rate in some
type of behaviour exceeds a specified threshold
within a specified temporal window. An example of
such aberrant behaviour would be a more than 100%
increase in the number of ‘bouncers’ within an hour.
Finally, automated tools can be devised to
calculate the optimal numbers of mappers, reducers
and rereducers based on the number and type of
monitoring events and historical data about the web
site traffic such as audit trail data from the web
application performance.
REFERENCES
Agosti , Maristella , Franco Crivellari Giorgio Maria Di
Nunzio2012. Web log analysis: a review of a decade
of studies about information acquisition, inspection
and interpretation of user interaction. Data Mining and
Knowledge Discovery archive. Volume 24 Issue 3,
May 2012 . Pages 663-696.
Arsham, Hosein. 2012. Time-Critical Decision Making for
Business Administration. Merrick School of Business
University of Baltimore. Available from
http://home.ubalt.edu/ntsbarsh/stat-data/forecast.htm#
rgintroduction.
Campanile, Ferdinando Alessandro Cilardo, Luigi
Coppolino, Luigi Romano. 2007. Adaptable Parsing of
Real-Time Data Streams. In 15th Euromicro
International Conference on Parallel, Distributed and
Network-Based Processing (PDP'07) Naples, Italy
February 07-February 09.
Cayci, Aysegul Selcuk Sumengen Cagatay Turkay Selim
Balcisoy Yucel Saygin. 2009. Temporal Dynamics of
User Interests in Web Search Queries. In International
Conference on Advanced Information Networking and
Applications Workshops, Bradford, United Kingdom.
May 26-May 29.
Devi, T, Ramasubramanian, Thiyagarajan Sivakumar
Kuppusamy. 2012. Hive and Hadoop for Data
Analytics on Large Web Logs. Available from
http://www.devx.com/Java/Article/48100.
Fu, Qiang Jian-Guang Lou Yi Wang Jiang Li. 2009.
Execution Anomaly Detection in Distributed Systems
through Unstructured Log Analysis. In Ninth IEEE
International Conference on Data Mining. Miami,
Florida December 06-December 09.
Hawwash, Basheer & Olfa Nasraoui. 2010. Mining
andtracking evolving web user trends from large web
server logs. Statistical Analysis and Data Mining
archive Volume 3 Issue 2, April 2010 Pages 106-125
John Wiley & Sons, Inc. New York, NY, USA.
Iyengar, Arun K. Mark S. Squillante Li Zhang. 1999.
Analysis and characterization of large-scale Web
server access patterns and performance. World Wide
Web archives Volume 2 Issue 1-2, 1999 Pages 85 –
100.
Lee, Kyong-Ha , Yoon-Joon Lee, Hyunsik Choi, Yon
Dohn Chung, Bongki Moon. 2011. Parallel Data
Processing with MapReduce: A Survey. SIGMOD
Record, December 2011 (Vol. 40, No. 4).
Li, Lei (2011) Fast Algorithms for Mining Co-evolving
TimeSeries September 2011 CMU-CS-11-127.
Computer Science Department. School of Computer
Science. Carnegie Mellon University Pittsburgh, PA.
Masseglia, F. M. Teisseire P. Poncelet (2001) Real-Time
Web Usage Mining: A Heuristic Based Distributed
Miner. WISE '01 In Proceedings of the Second
International Conference on Web Information Systems
Engineering (WISE'01) Volume 1 - Volume 1 Page
288 IEEE Computer Society Washington, DC, USA.
Masseglia, F., M. Teisseire, P. Poncelet. 2002. Real Time
Web Usage Mining with a Distributed Navigation
Analysis. In Proc. 12th International Workshop on
Research Issues in Data Engineering: Engineering E-
Commerce/E-Business Systems (RIDE'02) San Jose,
California February 24-February 25.
Pabarskaite, Zidrina. 2003. Decision trees for web log
mining. Intelligent Data Analysis archive. Volume 7
Issue 2, April 2003 Pages 141 - 154 .
Pun, Ka-I Yain-Whar Si. 2009. Audit Trail Analysis for
TrafficIntensive Web Application. In
IEEE
International Conference on e-Business Engineering
Macau, China October 21-October 23.
Royans. 2010. Real-Time MapReduce using S4. Available
at http://www.royans.net/arch/page/4/.
Sudhamathy, G. 2010. Mining web logs: an automated
approach. In A2CWiC '10: Proceedings of the 1st
Amrita ACM-W Celebration on Women in Computing
AMapReduceArchitectureforWebSiteUserBehaviourMonitoringinRealTime
51

in India September 2010.
Sugaya, Midori, Ken Igarashi Masaaki Goshima Shinpei
Nakata Kimio Kuramitsu. 2011. Extensible online log
analysis system. In EWDC '11 Proceedings of the 13th
European Workshop on Dependable Computing Pages
79-84.
Yoshino, Matsuki , Atsuro Handa, Norihisa Komoda,
Michiko Oba. 2011. Resource usage monitoring for
web systems using real-time statistical analysis of log
data. In The 13th WSEAS international conference on
mathematical methods, computational techniques and
intelligent systems.
Ying Zhang, Bernard J. Jansen, Amanda Spink. 2009.
Time series analysis of a Web search engine
transaction log Information Processing and
Management: an International Journal, Volume 45
Issue 2.
Zhang, Fan,Junwei Cao, Xiaolong Song, Hong Cai, Chen
Wu. 2010 . AMREF: An Adaptive MapReduce
Framework for Real Time Applications. In GCC 2010:
(157-162).
DATA2013-2ndInternationalConferenceonDataManagementTechnologiesandApplications
52
