
Community Detection within Clusters Helps Large Scale Protein
Annotation
Preliminary Results of Modularity Maximization for the BAR+ Database
Giuseppe Profiti
1, 2
, Damiano Piovesan
3
, Pier Luigi Martelli
2, 3
, Piero Fariselli
1, 3
and Rita Casadio
2, 3
1
Department of Computer Science and Engineering, University of Bologna, via Mura Anteo Zamboni 7, Bologna, Italy
2
Health Science and Technologies CIRI, University of Bologna, via Tolara di Sopra 50, Ozzano dell'Emilia, Italy
3
Biocomputing Group, University of Bologna, Via San Giacomo 9/2, Bologna, Italy
Keywords: Graphs, Community Detection, Protein Sequences, Automated Annotation.
Abstract: Given the exponentially increasing amount of available data, electronic annotation procedures for protein
sequences are a core topic in bioinformatics. In this paper we present the refinement of an already published
procedure that allows a fine grained level of detail in the annotation results. This enhancement is based on a
graph representation of the similarity relationship between sequences within a cluster, followed by the
application of community detection algorithms. These algorithms identify groups of highly connected nodes
inside a bigger graph. The core idea is that sequences belonging to the same community share more features
in respect to all the other sequences in the same graph.
1 INTRODUCTION
Sequencing technology has greatly advanced in
recent years, leading to a huge amount of sequence
data. However, experimental characterisation of
proteins and their variants is far too slow compared
to the pace at which data are deposited in the public
data bases. The problem of protein sequencing
annotation is therefore a key issue in bioinformatics:
how to endow with reliable structural and functional
features proteins that are automatically inferred after
genome sequencing of different species.
Electronic annotation is the current solution to
this problem: the annotation of a new sequence is
routinely derived after alignment towards a data
base of curated references, namely proteins for
which some information is made available and
described in literature. The public reference data
base is SwissProt (Boeckmann et al., 2003), with
over 500.000 sequences, where only 28% of the
proteins are endowed with evidence at the protein
level and/or transcript level. Considering that some
22 million protein sequences are currently included
in UniProt KB (Magrane et al., 2011), it appears that
the problem of inferring information from a small
percentage of the data base deserves some attention.
Recently, the annotation resource BAR+ was
proposed (Piovesan et al., 2011), allowing the
transfer of annotation in a statistically validated
manner and in this, it is quite unique. BAR+ is based
on a pairwise similarity search among a set
including some 14 millions protein sequences, on
the generation of clusters by splitting the
components of graphs including all the proteins that
pairwise share 40% sequence identity over at least
90% of the alignment length and on statistical
validation of all the structural and functional features
characterizing a cluster. By this, any sequence that
enters any of the about 100,000 clusters endowed
with statically validated features inherits annotation
from other members of the same group, rather
independently of its similarity with the seed
sequences carrying along experimentally validated
annotation.
Here we exploit the notion of community within
a graph to enhance annotation details within
statistically validated features. The paper is
organized as follows: background on graph theory,
terminology and community detection algorithms
are presented in section 2; the BAR+ database is
described in section 3; preliminary results and
discussion about the tested algorithms are in section
4; section 5 contains conclusions and future goals.
328
Profiti G., Piovesan D., Luigi Martelli P., Fariselli P. and Casadio R..
Community Detection within Clusters Helps Large Scale Protein Annotation - Preliminary Results of Modularity Maximization for the BAR+ Database.
DOI: 10.5220/0004328703280332
In Proceedings of the International Conference on Bioinformatics Models, Methods and Algorithms (BIOINFORMATICS-2013), pages 328-332
ISBN: 978-989-8565-35-8
Copyright
c
2013 SCITEPRESS (Science and Technology Publications, Lda.)

2 GRAPHS AND COMMUNITIES
A graph G(V,E) is defined as a set V of n vertices,
also called nodes, and a set E of m edges connecting
pair of vertices. Edges may have a weight
representing a degree of relationship between nodes,
like the strength of the connection, the length of the
path between the two nodes or something else.
Nodes connected by an edge are said to be
neighbours.
Unweighted graphs can be thought as a special
class of weighted graphs in which edges can have
weight 0 or 1.
A graph is dense if the number of edges is close
to n
2
, otherwise it is sparse.
A graph can be directed or undirected: given a
pair of nodes, the graph is directed if the order of
nodes in the pair matters, i.e. the edge starts from the
first node and ends on the second. Otherwise, if the
order does not matter, the graph is said to be
undirected.
One way to store the edges is by using the
adjacency matrix, an n by n matrix whose cell in the
i-th row and j-th column contains the weight of the
edge from node i to node j. Obviously, the adjacency
matrix of an undirected graph is symmetric.
In a (weighted) graph, the degree (strength or
weighted degree) k of a node is the number (the sum
of the weights) of the edges connecting it to other
vertices.
A path is an ordered sequence of edges where
each edge starts from the end of the previous one.
A component in a graph is a set of nodes that can
be reached from each other using path (Diestel
2005). A graph is partitioned if it is composed by
more than one component.
A community is defined as a subset of nodes
having more edges leading to members of the same
community than to other nodes in the graph. The
term community comes from the original application
of this concept to social networks; however,
community detection is now used to assess
robustness of network infrastructures and to analyse
interaction networks.
The definition of community is a bit vague and
then a mathematical measure is needed in order to
compare different assignment of nodes to
communities in a graph.
Given that, different approaches to community
detection have been developed (Fortunato, 2010),
ranging from clustering techniques like k-means,
spectral methods, the maximization of a target
function and even to game theoretic algorithms.
Both spectral methods and k-means require a-priori
knowledge of the number of communities, but we
wanted an algorithm able to automatically detect the
communities without the need of setting a parameter.
We decided to focus on modularity optimization
algorithms, because they do not require the number
of communities as a parameter and are mostly
deterministic.
2.1 Modularity
Given a graph containing nodes belonging to a set of
communities, the modularity measure (Newman,
2004); (Newman, 2006) evaluates how well
connected the nodes inside a community are in
respect of the other nodes, using the following
formula:
1
Q =
2m 2m
ij
ij i j
i, j
kk
A δ c,c
(1)
Q is the modularity; i and j are nodes; A is the
adjacency matrix of the graph; k is the (weighted)
degree of a node; m is half of the sum of all the
elements of A; c
i
is the community of node i; delta is
a function returning 1 if the communities passed as
parameters are the same, 0 otherwise.
The modularity value ranges from -0.5 to 1. In
theory, maximizing the modularity means that the
best partitioning of the graph has been found.
However, modularity maximization is not a
simple task (Brandes et al., 2008) and that definition
of modularity has its limits on finding small
communities (Fortunato and Barthélemy, 2007).
2.2 Modularity Maximization
There are different algorithms for modularity
maximization: the original algorithm by Girvan and
Newman Girvan and Newman (Girvan and Newman
2002); (Newman and Girvan, 2004) is too expensive
in terms of computational complexity given the size
of our clusters.
We then focused on an algorithm known as the
Louvain method.
2.2.1 Louvain Method
The Louvain method (Blondel et al., 2008) is a
greedy algorithm for modularity maximization. The
greedy approach uses a heuristic that locally
maximize the modularity of the next state.
The algorithm starts with all the nodes assigned
to different communities. It then proceeds as
follows:
CommunityDetectionwithinClustersHelpsLargeScaleProteinAnnotation-PreliminaryResultsofModularity
MaximizationfortheBAR+Database
329

1. evaluate the increase of modularity that would
occur by putting adjacent nodes in the same
community
2. choose the best pair from step 1 and actually
assign the two nodes to the same community
3. consider the new community as a single node
4. go back to step 1.
The procedure ends when it is not possible to further
increase the modularity.
The exact computational complexity of the
algorithm has not been calculated, but it is roughly
estimated to be O(n log n).
2.2.2 Implementation
The Louvain method used was the one included in
Gephi (Bastian et al., 2009), a graph visualization
tool that also releases a toolkit for batch evaluations.
Given the size of our graphs and the
computational expensiveness of the Girvan-Newman
algorithm, the Louvain method was our final choice.
It should be pointed out that, at the time of the
experiments, the Louvain method implemented in
Gephi lacked the support for weighted modularity.
However, after checking few graphs we noticed that,
given the structure of our graphs, the difference in
the communities identified using weighted and
unweighted modularity is only on few nodes placed
on the “border” between two communities.
3 BAR+ ANNOTATION
DATABASE
BAR+ (Piovesan et al., 2011) is a non hierarchical
clustering method relying on a non comparative
large-scale genome analysis. The present version of
BAR+ contains 913,762 clusters with over 9 million
sequences
(http://bar.biocomp.unibo.it/bar2.0/stats.htm); in
10% of the clusters, including some 5 million
sequences, structural and functional features are
statistically validated (the associated P-value is
=0.01). Sequences in a cluster inherit annotations
from proteins that have been experimentally
characterised, when the feature/s is/are statistically
meaningful (P-value < 0.01) after evaluating the
cumulative distribution of Bonferroni corrected P-
values (Bartoli et al. 2009). Features include GO
terms (Ashburner et al. 2000) and Pfam domains
(Finn et al., 2009). The core idea of BAR+ is that
when a sequence sharing at least 40% sequence
identity over at least 90% of the alignment length
with one of the sequence in a validated cluster it
inherits structural and functional annotations from
the cluster. Features may include GO terms of the
three different branches (Molecular Function,
Biological Process, Cellular Components), Pfam
domains and when present, also PDB templates.
Within the statistically validated clusters some
3500 comprises from 300 to 87893 proteins. The
distribution of GO terms and Pfam domains can
therefore be heterogeneous, and not enough detailed
to ensure the correct location of the protein within a
specific family when the cluster includes a
superfamily. In order to cope with this problem and
in order to enhance the level of details for the
annotations we applied community detection
algorithms to split subsets of proteins sharing fine
grained annotation within the same cluster.
4 PRELIMINARY RESULTS
BAR+ clusters can be represented as graphs:
sequences are the nodes and similarity relationships
are the edges, with weight equal to the evaluated
sequence identity between the pair of nodes. Self
loops, i.e. edges from a node to itself, have been cut
out.
We applied the Louvain method (with
unweighted modularity) to all BAR+ clusters with
more than 100 sequences.
4.1 Community Detection in Cluster
#1. ABC Transporters
The biggest cluster of BAR+ considered in the
preliminary evaluation contains 87893 sequences,
mainly from Prokaryotes.
Annotations from Gene Ontology, from Pfam,
and the 22 PDB structure associated to the cluster
indicates that the cluster contain sequences of the
ATP-binding domain of the ABC transporters.
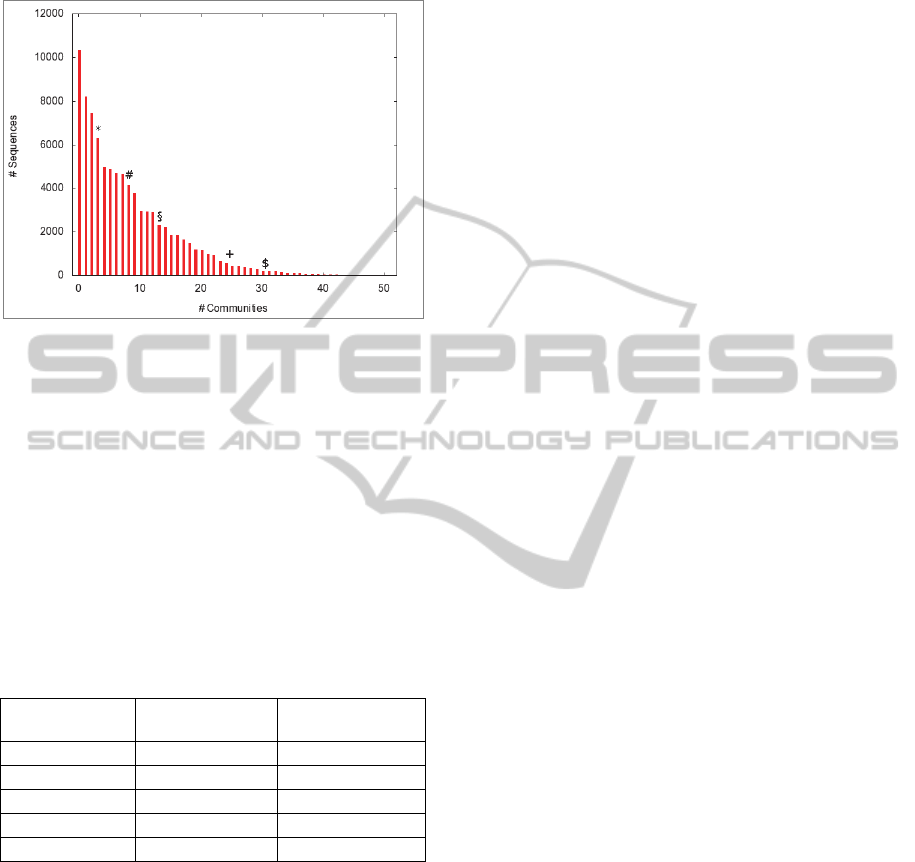
The Louvain method identified 50 communities
in the cluster (with a modularity of 0.99) and
including from 5 up to 10333 sequences.
Distribution of sequences among the 50
communities is shown in figure 1.
Differently from the most general Biological
Processes GO terms associated to the cluster, some
specific biological processes are populating specific
communities:
“Ferric iron transport” (GO:0008272);
“Cobalt ion transport” (GO:0006824);
“Nitrate transport” (GO:0015706);
BIOINFORMATICS2013-InternationalConferenceonBioinformaticsModels,MethodsandAlgorithms
330
“Vitamin transport” (GO:0051180);
“Zinc ion transport” (GO:0006829);
Figure 1: Number of sequences per community. The most
representative biological processes inside the communities
are also indicated: (*) Ferric iron transport. (#) Nitrate
transport. (§) Cobalt ion transport. (+) Zinc ion transport.
($) Vitamin transport.
In Figure 1 some bars are labelled to indicate
which community is more associated to a specific
transport, and in Table 1 the Bonferroni corrected P-
values, evaluated for each community w.r.t. the
whole cluster, are also indicated. Only the specified
community associated with a GO term in the table
got a statistically significant P-value for that GO
term.
Table 1: P-values of GO terms in communities.
Transport type
(GO term)
Community
P-value
Cobalt ion
#15 3.03025e-243
Ferric iron
#10 7.29299e-06
Nitrate
#13 1.38961e-86
Vitamin
#11 3.29897e-50
Zinc ion #30
0.0
This is one of the many different examples that
we are analysing with respect the partition of the
BAR+ clusters into communities. When a protein
sequence will end up in cluster 1 it will inherit then a
specific statistically validated annotation in relation
to a biological transport process depending on which
community it will end up in and on its sequence
neighbours.
5 CONCLUSIONS
In this paper we discuss how community detection
can help protein sequence annotation.
A fast algorithm, based on the well studied
modularity measure, was chosen and tested in order
to identify a fine grained subclustering of protein
sequences belonging to a same group.
The preliminary results on the ABC transporters
already clustered in one set according to a procedure
previously developed showed that protein sequences
of the same superfamily and specific for different
transport types are grouped in different
communities. Our results suggest that community
detection in large collection of sequences sharing
statistically validated GO terms of the three main
branches will fine tune the function specificity
associated to families within the superfamily.
Given the current implementation of Gephi,
which is memory consuming and given our volume
of data, we plan to implement the Louvain method
in a more fast programming language and to use data
structures with a lower memory footprint.
Combining different approaches and testing them
against new experimental annotations may lead to a
brand new annotation procedure. By using fast
community detection algorithms it would be
possible to quickly update the cluster annotations
after the release of new sequencing data.
ACKNOWLEDGEMENTS
GP would like to thank the 2007-2013 Regional
Operational Programme of the European Regional
Development Fund and the Emilia-Romagna region
for funding his research. RC thanks the following
grants: PRIN 2009 project 009WXT45Y (Italian
Ministry for University and Research: MIUR),
COST BMBS Action TD1101(European Union RTD
Framework Programme), and PON project
PON01_02249 (Italian Ministry for University and
Research: MIUR). DP is a recipient of a PHD
fellowship from the Ministry of the Italian
University and Research.
REFERENCES
Ashburner, M. et al., 2000. Gene Ontology: tool for the
unification of biology. Nature Genetics, 25(1), pp.25–
29.
Bartoli, L. et al., 2009. The Bologna Annotation Resource:
a Non Hierarchical Method for the Functional and
Structural Annotation of Protein Sequences Relying on
a Comparative Large-Scale Genome Analysis. Journal
of Proteome Research, 8(9), pp.4362–4371.
CommunityDetectionwithinClustersHelpsLargeScaleProteinAnnotation-PreliminaryResultsofModularity
MaximizationfortheBAR+Database
331

Bastian, M., Heymann, S. & Jacomy, M., 2009. Gephi: An
Open Source Software for Exploring and
Manipulating Networks. In International AAAI
Conference on Weblogs and Social Media.
Blondel, V. D. et al., 2008. Fast unfolding of communities
in large networks. Journal of Statistical Mechanics:
Theory and Experiment, 2008, p.P10008.
Boeckmann, B. et al., 2003. The SWISS-PROT protein
knowledgebase and its supplement TrEMBL in 2003.
Nucleic acids research, 31(1), pp.365–370.
Brandes, U. et al., 2008. On modularity clustering.
Knowledge and Data Engineering, IEEE Transactions
on, 20(2), pp.172–188.
Diestel, R., 2005. Graph Theory, Springer London,
Limited.
Finn, R. D. et al., 2009. The Pfam protein families
database. Nucleic Acids Research, 38(Database),
pp.D211–D222.
Fortunato, S., 2010. Community detection in graphs.
Physics Reports, 486(3–5), pp.75–174.
Fortunato, S. & Barthélemy, M., 2007. Resolution limit in
community detection. Proceedings of the National
Academy of Sciences, 104(1), p.36.
Girvan, M. & Newman, M. E. J., 2002. Community
structure in social and biological networks.
Proceedings of the National Academy of Sciences,
99(12), p.7821.
Magrane, M. & Consortium, U., 2011. UniProt
Knowledgebase: a hub of integrated protein data.
Database, 2011.
McGinnis, S. & Madden, T. L., 2004. BLAST: at the core
of a powerful and diverse set of sequence analysis
tools. Nucleic acids research, 32 (suppl 2), pp.W20–
W25.
Newman, M. & Girvan, M., 2004. Finding and evaluating
community structure in networks. Physical Review E,
69.
Newman, M., 2004. Analysis of weighted networks.
Physical Review E, 70.
Newman, M. E. J., 2006. Modularity and community
structure in networks. Proceedings of the National
Academy of Sciences, 103(23), p.8577.
Piovesan, D. et al., 2011. BAR-PLUS: the Bologna
Annotation Resource Plus for functional and structural
annotation of protein sequences. Nucleic Acids
Research, 39, pp.W197–W202.
BIOINFORMATICS2013-InternationalConferenceonBioinformaticsModels,MethodsandAlgorithms
332
