
Estimation of the Range of Motor Units Firing Rates from EMG
Signals using a Fourier-based Power Spectrum Technique
A. Malanda
1
, I. Rodríguez
2
, L. Gila
3
, J. Navallas
1
, J. Rodríguez
1
and P. A. Mathieu
4
1
Department of Electric and Electronic Engineering, Universidad Pública de Navarra, 31006 Pamplona, Spain
2
Economics Department, Universidad de Navarra, 31009 Pamplona, Spain
3
Department of Neurophysiology, Complejo Hospitalario de Navarra, 31008 Pamplona, Spain
4
Institute de Génie Biomédical, Université de Montréal, Québec, Canada
Keywords: Motor Unit Action Potential, Firing Rates, EMG Power Spectrum.
Abstract: A method for estimating the range of the motor units mean firing rates from electromyographic (EMG)
recordings is presented. The method is based on classical Fourier spectral estimation techniques and is
applied to the 0-50 Hz band of the EMG signal within which the mean MU firing rates are usually observed
in sustained contractions. Extensive simulations were performed to account for the influence of different
signal characteristics such as the firing rate range (FRR), the number of MUAP trains, the coefficient of
variation of the motor unit inter-spike intervals (IPI)) and the noise levels. The number of simulated MUAP
trains whose mean firing rate dwelled within the estimated range and the estimation error for the lower and
upper extremes of the actual FRR were evaluated. While some peaks were undetected and some
inaccuracies in the detected firing rate range were observed, satisfactory results were obtained, as for the
vast majority of cases the estimated range corresponded to the actual FRR of the simulated MUAP trains.
1 INTRODUCTION
For voluntary muscle activation, the fundamental
physiological unit is the motor unit (MU) composed
of a motor neuron and its innervated muscle fibres.
To be activated, a MU depends on a signal generated
in the brain and conducted along the spinal cord.
This signal consists in a series of action potentials,
which upon reaching the innervated fibres produce
muscular action potentials causing the contraction of
these fibres. The electrical potential associated with
a motor unit firing and captured by an electrode
placed in the proximity of the muscle fibres is called
motor unit action potential (MUAP) and the series of
MUAPs, a MUAP train.
Muscle force modulation in skeletal muscles is
due to two mechanisms: the recruitment (activation)
and derecruitment (deactivation) of MUs, and
changes in the firing rate (i.e., the frequency of
occurrence of action potentials in a MUAP train) of
active MUs. Extensive experimental work has been
carried out to measure the firing rate of MUs from
intramuscular EMG recordings and to relate it to
different muscles, type and intensity of contraction,
subject’s age, pathological conditions, fatigue, etc.
(Basmajian, 1985).
The straightforward procedure is the so-called
MUAP decomposition (i.e., the manual or automatic
isolation of one or several MUAP trains from the
EMG signal) followed by the statistical evaluation of
the MUAP spikes occurrences (Ren, 2006).
However this procedure is limited to the capacity of
these techniques to resolve precisely different
MUAP trains, and this capacity degrades rapidly as
muscle contraction intensity gets higher since, with
recruitment, the number of MUAPs present in the
signal is increased. Detection of MUAPs is even
more problematic in surface EMG recordings
because the signal results from a larger collection of
MUAP trains. Besides, these signals are smoothed
by the low-pass filter action of the tissues involved
in the volume conduction of the potentials, making
more similar the shape for the individual MUAPs,
and more difficult the decomposition (Zhou, 2004).
As an alternative to MUAP decomposition, MUs
firing rates can be estimated from the EMG power
spectrum where a peak, associated to the
predominant MU firing rate, may appeared in the 10
to 40 or 50 Hz range. This has been demonstrated in
a number of studies: Van Boxtel and Schomaker
377
Malanda A., Rodríguez I., Gila L., Navallas J., Rodríguez J. and Mathieu P..
Estimation of the Range of Motor Units Firing Rates from EMG Signals using a Fourier-based Power Spectrum Technique.
DOI: 10.5220/0004308003770382
In Proceedings of the International Conference on Bio-inspired Systems and Signal Processing (BIOSIGNALS-2013), pages 377-382
ISBN: 978-989-8565-36-5
Copyright
c
2013 SCITEPRESS (Science and Technology Publications, Lda.)

(1983) for the facial and maxilar elevator muscles,
Weytjens and Van Steenberghe (1984) for the biceps
brachii, Englehart and Parker (1994) for the
abductor pollicis. In other cases however, the peaks
of different MUAP trains are smoothed or
completely eliminated by cancellation (De Luca,
1979, Weytjens and Van Steenberghe, 1984). For
this peak to be clearly observed, either the EMG
signal is composed by regular MUAP trains with
similar firing rate, or it is dominated by a MUAP of
large amplitude (De Luca, 1979). With healthy
muscles, the first cause is more likely to be present
than the second one (Basmajian and De Luca 1985).
In neuropathic conditions however, reinervation
processes may create MUs composed of an unusual
high number of muscle fibres and the second
condition may then be present.
Various mathematical models for the EMG
signal have been proposed such as the ones of Lago
and Jones (1977) and De Luca, (1979) where a
MUAP train is modelled by:
k
n
k
tthtu
1
(1)
where h(t) is the temporal MUAP waveform and t
k
are the time instants where the actual MUAPs occur.
Differences between two successive MU firing
instants (t
k
-t
k-1
) are called interpulse intervals (IPIs)
and are modelled as independent random variables
and thus constitute a renewal process. Under
conditions of stationarity, i.e., non-varying h(t) and
non-varying IPI probability density function (PDF),
the power spectrum of a signal corresponding to a
MUAP train is given by:
2
1
Re21
1
jH
jF
jF
S
(2)
where
is the mean IPI, F(j
) is the Fourier
transform of the IPIs PDF and H(j
) is the Fourier
transform of h(t). Various distributions such as
Gaussian, gamma, Poisson and Weibull distributions
have been proposed to accommodate experimental
data (Merletti and Parker, 2004). All of them lead to
one principal peak in the signal power spectrum with
additional smaller ones at subsequent harmonics. All
those peaks are blurred as the coefficient of variation
of the IPI (CVI) increases, particularly as it
approaches values of 0.3 (Weytjens and Van
Steenberghe 1984).
The features of the EMG power spectrum in
relation to the IPI statistical characterization and the
degree of stationarity have been amply studied
through analytical derivation and simulation (Lago
and Jones, 1977), (De Luca, 1979), (Englehart and
Parker, 1994). Other studies have been focussed on
the statistical relationship between EMG variables,
such as the root mean square amplitude or the mean
power frequency, and MU firing rates (Christie et al.
2009), (Fuglesang-Frederiksen and Ronager, 1988).
However, the influence on the EMG power spectrum
of the number of MUAP trains, the mean firing rates
of these trains, the CVI and the signal to noise ratio
(SNR) has not undergone similar systematic studies.
The aim of this work is to present a method for
estimating the frequency range of the firing rates of
the set of MUAP trains that compose an EMG signal
based on the Fourier power spectrum. The capacity
of the approach for varying number of MUAP trains,
actual firing rate range (FRR), ICV and noise level
was explored through extensive simulation runs
using the afore mentioned EMG generation model.
2 MATERIAL
10 s-long simulated EMG signals were obtained as
the sum of several MUAP trains, each of which
generated as the multiple repetition of a given
MUAP waveform. Intervals between MUAP
occurrences followed Gaussian distributions whose
mean was the inverse of the firing rate. The firing
rate and the coefficient of variation for each of these
trains were set as input parameters in the different
analysis tests. MUAP waveforms were taken ‘off-the
self’ from a set of potentials recorded from the
deltoid muscles of different patients in a previous
study (Rodríguez et al., 2010). White Gaussian noise
was added to the signals so that specific levels of
SNR could be tested. The sampling rate of the
simulated signal was set to 20 kHz.
Different tests were performed to evaluate the
performance of the method. In the tests some of the
input parameters were given a fixed value while
some were varied in a systematic way or randomly
within a certain range. Simulations were run 500
independent times for every tested parameter value.
- The first test concerned the detection
performance for different FRR values. 10
MUAP trains composed the simulated signals,
whose mean firing rates were independent
randomly taken in the range [f1-f2], which we
will call nominal frequency range (NFR)
hereafter. f1 was set to 10 Hz and f2 was varied
from 11 to 20 Hz in 1 Hz steps. An SNR of 20
dB, a random variation in the amplitude of the
BIOSIGNALS2013-InternationalConferenceonBio-inspiredSystemsandSignalProcessing
378
MUAP waveforms with maximum excursion
of 20 dB and an ICV of 0.15 were used.
- The second test was to measure the influence of
the number of MUAP trains. This number was
varied from 4 to 20 in steps of 2. The NFR was
set to [10-15 Hz]. All the other parameters
were the same as in the previous test.
- In the third test, the influence of the MU firing
regularity was analysed by varying the ICV
from 0.03 to 0.3 in steps of 0.03. Fifteen
MUAP trains composed the simulated signals
whose NFR was also set to 10-15 Hz.
- In the fourth test, the SNR was varied from 0 to
30 dB in steps of 5 dB. Other parameters
values were the same as in the previous tests.
3 METHODS
As firing rates are located in the low frequency
section of the spectrum and to fasten computation,
the EMG signals were decimated by a x100 factor.
Power spectrum was computed by the Welch's
averaged, modified periodogram method, Hayes
(1996), implemented in the Matlab Signal
Processing Toolbox (version 6.3), using 1s-long
signal segments, windowed by a Hamming window
and with a 50% overlap between consecutive
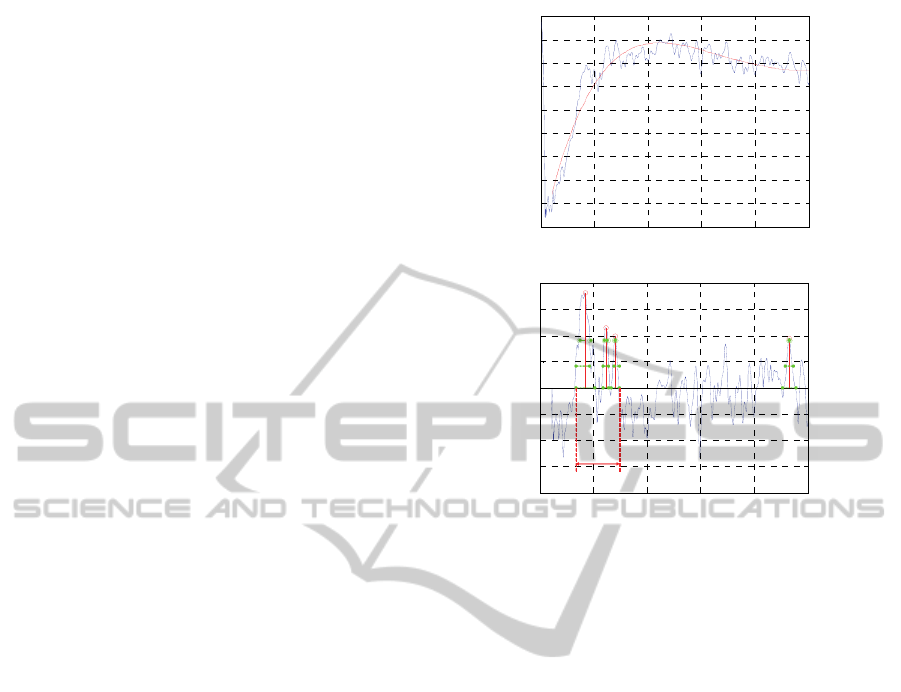
segments. In Fig. 1A we show in the 0-50 Hz range
a typical EMG power spectrum of an EMG signal
composed of 10 MUAP trains. Around 10 Hz, three
peaks, corresponding to actual MU firing rates can
be observed. They are superposed to a smoothly
increasing curve, mainly associated to the power
spectrum of the MUAP waveforms used to generate
the signal. To flatten the spectrum in the 0-50 Hz
band, a 5th order polynomial curve was fitted to the
power spectrum curve in a mean square basis. The
polynomial curve was then subtracted from the
spectrum curve, leaving a ‘rectified spectrum’ where
the three peaks appeared more clearly for detection
(Fig. 1B). On the ‘rectified spectrum’ in logarithmic
scale the highest peak (P
max
) was obtained. An
interval around P
max
was determined, in which the
‘rectified spectrum’ was higher than a given
threshold. Three different values for this threshold
were tested in the experiments: P
max
/2, P
max
/4 and 0
and were and referred as Th1, Th2 and Th3,
respectively (Fig. 1B). The 0-50 Hz band was then
scan to detect other peaks having a power level
higher than P
max
/2.
Frequency intervals around these peaks were
then determined following the procedure applied to
the highest peak.
0 10 20 30 40 50
-120
-115
-110
-105
-100
-95
-90
-85
-80
-75
EMG power spectrum (dB)
Freq (Hz)
A
0 10 20 30 40 50
-8
-6
-4
-2
0
2
4
6
8
‘Rectified’ EMG power spectrum (dB)
Freq (Hz)
Detected freq range
B
Th1
Th2
Th3
Figure 1: A: EMG power spectrum (logarithmic
amplitude) and interpolation curve. B: EMG Rectified
spectrum (logarithmic amplitude).
If the highest frequency of any of these intervals was
higher than two times the frequency of P
max
, the
former interval was discarded, as it could be related
to the harmonics of peak frequencies around P
max
.
The estimated frequency range was finally obtained
by joining together all the remaining intervals and
the frequency gaps between these intervals. These
gaps could have been produced by valleys of nearby
peaks and might contain firing rate frequencies of
actual MUAP trains of the EMG signal cancelled by
these valleys. As merit figures we measured the
following features:
- The number of missed peaks: firing rates of
actual MUAP trains of the EMG signal outside
the frequency range determined by the method.
- The lower frequency range error (LFRE):
difference between the lower extreme of the
determined frequency interval and the lower
extreme of the FRR calculated as
1/1
1
, where
1
/1
is the lowest mean
firing rate of the set of MUAP trains
composing the EMG signal and
is the ICV,
which was given the same value for all the
MUAP trains.
The higher frequency range error (HFRE):
difference between the upper extreme of the
EstimationoftheRangeofMotorUnitsFiringRatesfromEMGSignalsusingaFourier-basedPowerSpectrumTechnique
379
1 2 3 4 5 6 7 8 9 10
0
0.5
1
1.5
2
2.5
rang peak freq (Hz)
Num peaks withi n det ected range (st d)
1 2 3 4 5 6 7 8 9 10
-1
-0.5
0
0.5
1
1.5
2
2.5
3
3.5
ra ng peak freq (Hz )
Lower freq range error ( mean)
1 2 3 4 5 6 7 8 9 10
0
0.5
1
1.5
2
2.5
rang peak freq (Hz)
Lower freq range error (std)
1 2 3 4 5 6 7 8 9 10
-6
-5
-4
-3
-2
-1
0
rang peak freq ( Hz)
Higher freq r ange error (mean)
1 2 3 4 5 6 7 8 9 10
0
0. 5
1
1. 5
2
2. 5
3
3. 5
rang peak freq (Hz)
Higher freq range error (std)
Num. missed peaks
(mean)
Peak freq range (Hz)
Lower freq range error
(mean) (Hz)
Peak freq range (Hz)
Higher freq range error
(mean) (Hz)
Peak freq range (Hz)
(std) (std)
1 2 3 4 5 6 7 8 9 10
0
0.5
1
1.5
2
2.5
3
3.5
4
4.5
5
rang peak freq (Hz)
Num peaks within det ect ed range (mean)
1 2 3 4 5 6 7 8 9 10
1 2 3 4 5 6 7 8 9 10 1 2 3 4 5 6 7 8 9 10
(std)
AB
C
DE
F
0
1
2
3
4
5
-1
0
1
2
3
-6
-5
-4
-3
-2
-1
0
5
0
1
2
0
1
2
0
1
2
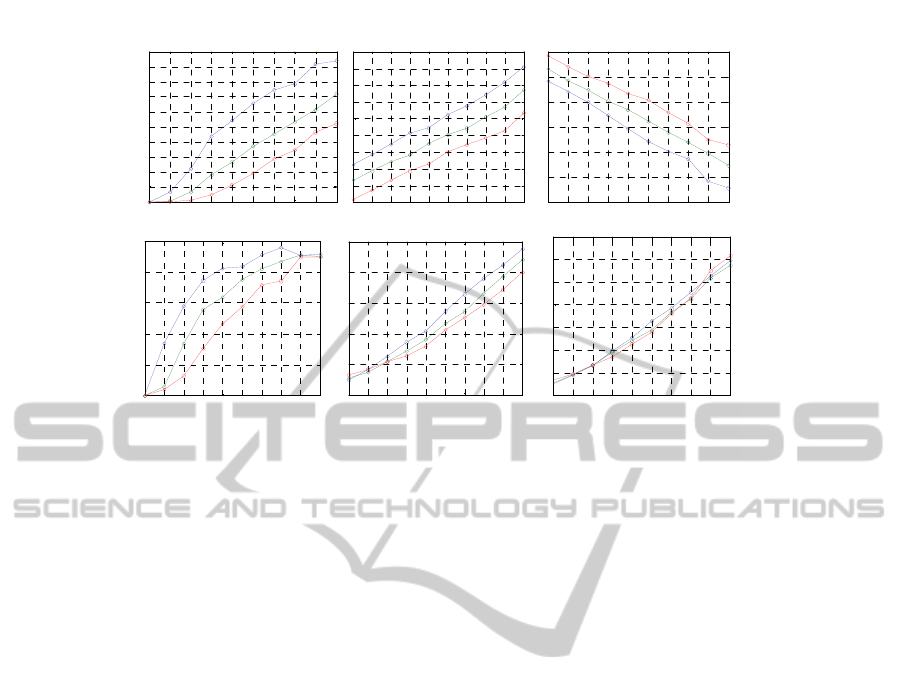
3
Figure 2: Results of the first test. Blue, green and red curves are respectively for Th1, Th2 and Th3 thresholds.
determined frequency interval and the upper extreme
of the FRR, calculated as
1/1
2
, where
2
/1
is the highest mean firing rate of the set of
MUAP trains composing the EMG signal.
All simulations were run in the Matlab program
(version 7.0.4) (The Math Works, Inc., USA).
4 RESULTS
As the FRR increased, a steady degradation of the
number of detected peaks was observed (Fig 2.A).
Th3 presents the best scores of the three thresholds,
with 0.5 missed peaks out of 10 on average for
frequency ranges up to 5 Hz and down to 2.5 misses
for 10 Hz range. Th2 presents slightly lower
detection scores and Th1 shows clearly worse
results. The LFRE mean increased almost linearly as
the NFR increased, and was highest for Th1 and
lowest for Th3 (Fig 2.B). Globally LFRE almost
linearly as the NFR increased, and ranged from 0.1
to 3.3 Hz for Th3, from 0.65 to -4.5 Hz for Th2 and
from -1.2 to -5.5 Hz for Th1 (Fig 2.C). The
variability of LFRE and HFRE, as measured by the
STD increased with increasing NFR (Fig. 2.E, F).
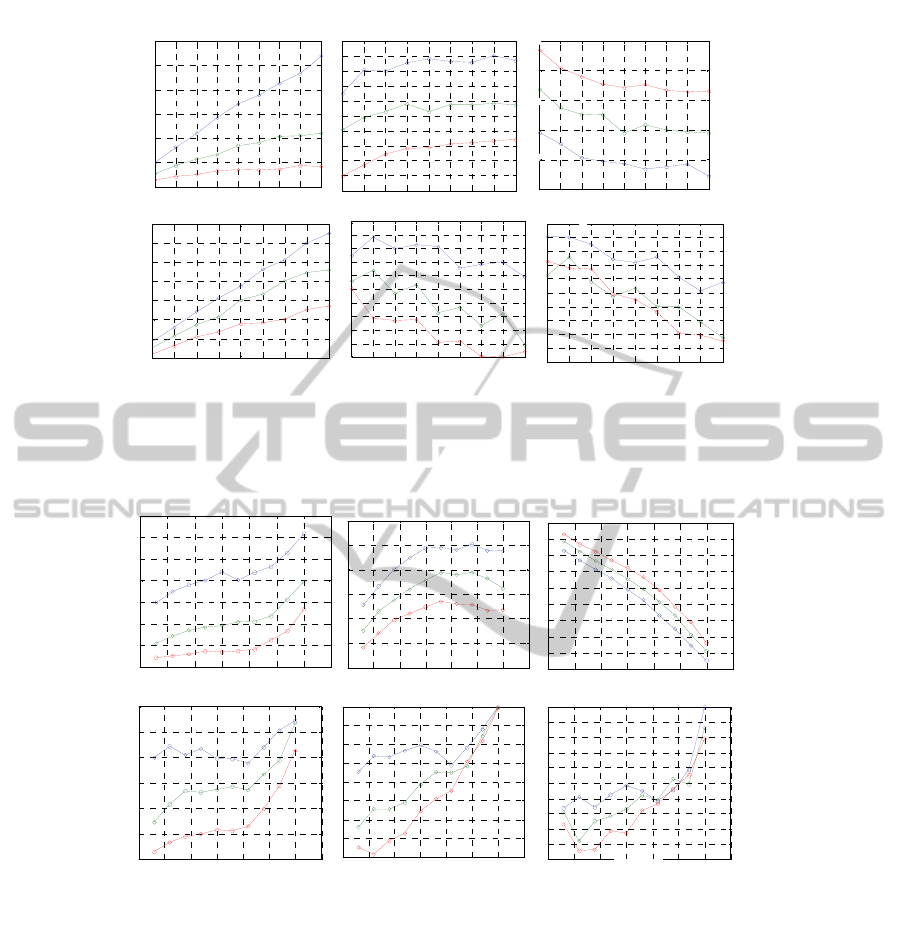
The results of the second tests are presented in
Fig.3. The mean and STD of the number of missed
frequency peaks increased steadily with the number
of MUAP trains (Fig 3.A, D). In the case of Th3, the
mean was lower than one peak on average for all the
studied cases. The number of missing peaks was
higher for Th2 and Th1: from 0.5 to 2.4 peaks for
Th2 and from 1 to 5.4 peaks for Th1 on average, as
the number of MUAP trains varied from 4 to 20. The
LFRE increased only slightly with the number of
MUAP trains (no more than 0.5 Hz) in the total
inspected range and was lower in mean and STD for
Th3 than for Th2 and Th1 (Fig 3.B, E). The HFRE
decreased slightly with the number of MUAP trains.
It was negative in all the studied cases and its
magnitude was lower for Th3 than for Th2 and Th1
both in the mean and STD values (Fig 3.C, F).
Results for the third test are given in Fig.4. A
moderate increase in the number of missed peaks
was observed for the three considered threshold
values as the ICV increased and was below 0.2.
(Missed peaks were on average below 1, 2 and 4.5
for Th3, Th2 and Th1, respectively). For larger
values of ICV, the mean and STD of the number of
missed peaks increased more remarkably (Fig 4.A,
D). The LFRE mean increased steadily for the three
thresholds under study and ICV values up to 0.2 (Fig
4.B). For larger ICV values, LFRE mean remained
more or less constant (around 1.5 Hz for Th1, 0.75
Hz for Th2 and 0.25 for Th3). The HFRE variation
with ICV decreased around 0 Hz to -7 Hz, indicating
considerable underestimation of the upper extreme
of the FFR as ICV increased (Fig 5.C). Also the
STD of the HFRE increased with the ICV (Fig 5.F).
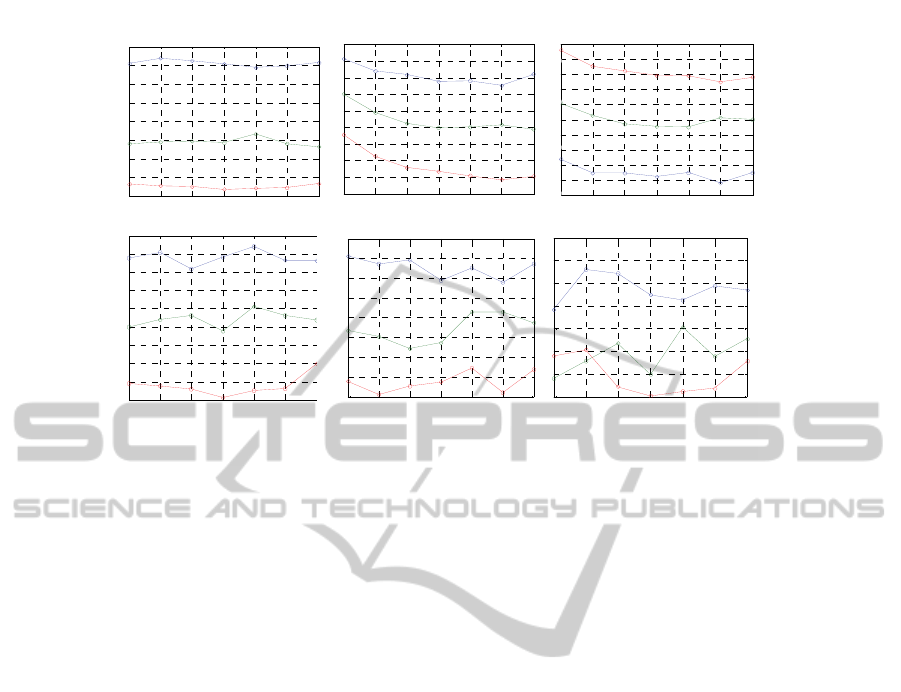
Results of the fourth test are presented in Fig. 5.
Strangely, the number of detected peaks does not
vary significantly with the SNR (Fig. 5.A, D).
BIOSIGNALS2013-InternationalConferenceonBio-inspiredSystemsandSignalProcessing
380
4 6 8 10 12 14 16 18 20
0.5
1
1.5
2
2.5
3
3.5
4
Number of MUA P s
Num p eaks out of de tec ted range (st d)
Num MUAP trains
(std)
Num MUAP trains
4 6 8 10 12 14 16 18 20
-0.4
-0.2
0
0.2
0.4
0.6
0.8
1
1.2
1.4
1.6
Number of MUAP s
Lower freq range error (mean)
Lowe
r
freq range error
(mean) (Hz)
4 6 8 10 12 14 16 18 20
-3. 5
-3
-2. 5
-2
-1. 5
-1
Number of MUAPs
Higher freq range error (mean)
Highe
r
freq range error
(mean) (Hz)
Num MUAP trains
4 6 8 10 12 14 16 18 20
0.7
0.75
0.8
0.85
0.9
0.95
1
1.05
1.1
1.15
1.2
Number o f MUA Ps
Lower freq range error (std)
4 6 8 10 12 14 16 18 20
0. 9
0.95
1
1.05
1. 1
1.15
1. 2
1.25
1. 3
1.35
1. 4
Number of MUAP s
Higher freq range error (std )
4 6 8 10 12 14 16 18 20
0
1
2
3
4
5
6
Number of MUAPs
Num peaks out of detected range (mean)
Num. missed peaks
(mean)
(std)
(std)
4 6 8 10 12 14 16 18 20
4 6 8 10 12 14 16 18 20
4 6 8 10 12 14 16 18 20
AB
C
D
E
F
0
1
2
3
4
5
6
-0.4
0
0.4
0.8
1.2
5
-2
-3
-1
1
2
3
4
0.7
0.8
0.9
1
1.1
1.2
0.9
1
1.1
1.2
1.3
1.4
Figure 3: Results of the second test (blue, green and red curves for Th1, Th2 and Th3 thresholds, respectively).
0 0.0 5 0. 1 0. 15 0.2 0. 25 0.3 0.35
1
1.5
2
2.5
3
3.5
4
IPI coef of variation
Num peaks wit hin detec ted range (std)
0 0.0 5 0.1 0.15 0.2 0.25 0.3 0. 35
0.5
0.6
0.7
0.8
0.9
1
1.1
1.2
1.3
IPI coef of variation
Lower freq range error (s td)
0 0.05 0.1 0.15 0.2 0.25 0.3 0.35
0.8
0.9
1
1.1
1.2
1.3
1.4
1.5
1.6
1.7
1.8
IPI coef of variation
Higher freq range error (std)
0 0.05 0. 1 0. 15 0.2 0.25 0.3 0.35
-8
-7
-6
-5
-4
-3
-2
-1
0
1
IPI coe f of variation
Higher fre q range error ( mean)
(std)
IPI coef of variation IPI coef of variationIPI coef of variation
(std) (std)
0 0. 05 0.1 0.15 0. 2 0. 25 0. 3 0. 35
0
1
2
3
4
5
6
7
IPI c oef of varia ti o n
Num peaks out of detected range (mean)
0 0. 05 0.1 0. 15 0.2 0. 25 0.3 0. 35
-1
-0. 5
0
0.5
1
1.5
2
IPI coef of variation
Lower freq range error (mean)
Lower freq range error
(mean) (Hz)
Higher freq range error
(mean) (Hz)
Num. missed peaks
(mean)
0 5 10 15 20 25 30
0 5 10 15 20 25 30
0 5 10 15 20 25 30
(*1.0E-2)
(*1.0E-2)
(*1.0E-2)
AB
C
DE
F
0
1
2
3
4
5
6
7
-1
0
1
2
-8
-6
-4
-2
0
1
2
3
4
0.7
0.5
0.9
1.1
1.3
1.1
0.8
1.4
1.7
Figure 4: Results of the third test (blue, green and red curves for Th1, Th2 and Th3 thresholds, respectively).
As observed in the previous tests, Th3 had a
better performance than the other two thresholds.
In fact, Th3 only missed on average 0.5 peaks out
of the 15, while Th2 missed around 2 and Th1,
around 4. Mean LFRE and HFRE values slightly
decreased in mean as the SNR increased and were
below 15 dB or more and basically stable for an
SNR of 15 dB or more (Fig 5.B-C). LFRE and
HFRE STD values were also very stable for the
three threshold values (Fig 5.E and 5.F).
5 CONCLUSIONS
The main conclusions of this work are:
- A method for estimating the range of the
firing rates of the MU trains composing an
EMG signal has been produced.
- The method provides satisfactory results as in
the majority of studied cases the estimated
range corresponded to the actual FRR.
EstimationoftheRangeofMotorUnitsFiringRatesfromEMGSignalsusingaFourier-basedPowerSpectrumTechnique
381
0 5 10 15 20 25 30
1.4
1.6
1.8
2
2.2
2.4
2.6
2.8
3
3.2
SNR (dB )
Num peaks withi n detec ted range (std)
0 5 10 15 20 25 30
0.7
0.75
0.8
0.85
0.9
0.95
1
1.05
1.1
SNR (dB)
Lower freq range error (std)
0 5 10 15 20 25 30
0
0.2
0.4
0.6
0.8
1
1.2
1.4
1.6
1.8
SNR (dB)
Lower freq range error (mean)
0 5 10 15 20 25 30
-3.4
-3.2
-3
-2.8
-2.6
-2.4
-2.2
-2
-1.8
-1.6
-1.4
SNR (dB)
Higher freq range error (mean)
Lowe
r
freq range error
(mean) (Hz)
Higher freq range error
(mean) (Hz)
(std)
(std)
SNR (dB)
SNR (dB)
0 5 10 15 20 25 30
1
1.05
1.1
1.15
1.2
1.25
1.3
1.35
SNR (dB)
Higher freq ran ge error (st d)
SNR (dB)
0 5 10 15 20 25 30
0.5
1
1.5
2
2.5
3
3.5
4
4.5
SNR (dB)
Num peaks within det ec te d range (m ean)
(std)
0 5 10 15 20 25 30
Num. missed peaks
(mean)
0 5 10 15 20 25 30 0 5 10 15 20 25 30
A
B
C
D
E
F
1
2
3
4
0
0.4
0.8
1.2
1.6
-3.4
-2.8
-2.2
-1.6
-1.4
-2.0
2.6
3.2
0.7
0.8
0.9
1.1
1.0
1.1
1.0
1.2
1.3
Figure 5: Results of the fourth test (blue, green and red curves for Th1, Th2 and Th3 thresholds, respectively).
- The number of undetected peaks increases as
the FRR increases.
- Frequency range absolute errors for LFRE and
HFRE tend to increase as the FFR increases.
- The number of undetected peaks increased as
the number of MUAP trains increased.
- Frequency range absolute errors for LFRE and
HFRE tend to increase slightly as the number
of MUAP trains increased.
- As the ICV increased, absolute values for the
LFRE and HFRE increased and the number of
detected peaks decreased.
- The SNR did not have a significant influence
on the detected frequency range nor on the
number of detected peaks.
REFERENCES
Basmajian, J., De Luca, J. C., 1985. Muscles alive. Their
function revealed by Electromyography, Williams &
Wilkins, Baltimore, 5
th
Edition.
Merletti, R., Parker, P. A., 2004. Electromyography.
Physiology, Engineering and noninvasive applications.
IEEE-Press and John Wiley & Sons, New Jersey.
Ren, X., Hu, X., Wang, Yan, Z., 2006. MUAP extraction
and classification based on wavelet transform and ICA
for EMG decomposition. Med Biol Eng Comput.
Zhou, P., Rymer, W. Z., 2004. Can standard surface EMG
processing parameters be used to estimate motor unit
global firing rate? J Neural Eng.
Van Boxtel, A., Schomaker, L. R. B., 1983. Motor unit
firing rate during static contraction indicated by the
surface EMG power spectrum. IEEE Trans Biomed
Eng.
Weyjtens, J. L. F., Van Steenberghe, D., 1984. Spectral
analysis of the surface electromyogram as a tool for
studying rate modulation: a comparison between
theory, simulation and experiment. Biol Cybern.
Englehart, K. B., Parker, P. A., 1994, ‘Single motor unit
myoelectric signal analysis with nonstationary data’.
IEEE Trans Biomed Eng.
Lago, P., Jones N. B., 1977, Effect of motor unit firing
time statistics on EMG spectra. Med Biol Eng &
Comput.
De Luca, J. C., 1979. Physiology and mathematics of
myoelectric signals. IEEE Trans Biomed Eng.
Christie, A., Inglis, J. G., Kamen, G., Gabriel, D. A., 2009.
Relationships between surface EMG variables and
motor unit firing rates. Eur J appl Physiol.
Fuglesang-Frederiksen, A., Ronager, J., 1988. The motor
unit firng rate and the power spectrum of EMG in
humans. Electroenceph clin Neurophysiol.
Rodríguez, I., Gila, L., Malanda, et al., 2010. Application
of a novel automatic duration method measurement
based on the wavelet transform on pathological motor
unit action potentials. Clinical Neurophysiology.
Hayes, M., Statistical Digital Signal Processing and
Modeling, John Wiley & Sons, 1996.
BIOSIGNALS2013-InternationalConferenceonBio-inspiredSystemsandSignalProcessing
382
