
Semantic Visualization in 3D Urban Environment
Taking Text as an Example
Fan Zhang, Vincent Tourre and Guillaume Moreau
L’UNAM, Ecole Centrale de Nantes, CERMA UMR CNRS1563, Nantes, France
Keywords: Semantic Visualization, Automated 3D Annotation, GIS, Human Perception.
Abstract: One important aspect of semantic data in computer visualization is to offer supporting and extra information
of the environment besides the pure graphical information to system users. It is devoted to help them
understand the visualization result better. This paper presents a way to visualize semantic data in 3D urban
environment in form of text, which is similar to the issue of 3D labelling and annotation. Different objects
in 3D urban environment need different annotation techniques. Occlusions, overlaps, readability, visibility
and information density are problems encountered frequently, and several potential solutions are proposed
accordingly. A primary test is done to compare the performances among three different text layout
techniques: floating text, fading text, linking text. The result shows that floating text and fading text are well
understood in a 3D environment, the former one maintaining good readability and visibility and the latter
one efficiently avoiding occlusions. Finally several open questions are proposed in the discussion part.
1 INTRODUCTION
In recent years, visualization has been increasingly
used in almost every aspect of our daily life. In town
planning and urban development, urban data are
essential for understanding the relationship between
objects of the urban build environment. However, it
is not easy to analyse such data due to the huge
amount of urban objects, their multidimensional
features and complex relations (spatial, temporal or
logical). Hence how to convey information with
high efficiency and accuracy becomes a critical issue.
Geometricdata is to provide spatial information
to userswhich conveys information about location,
shape and size of the space.While semantic data can
provide extra and supporting information which can
enhance the descriptionof the environment. This
work is devoted to visualize semantic data in form of
text in 3D urban environment, namely 3D annotation.
2 RELATED WORKS
According to Stefan et al. (2007), the term ‘labeling’
is more often referenced in cartography field, as
placing names of objects is often used, while
‘annotation’ is a general term, which can be used for
any type of information, such as symbols, figures or
images.
A lot of works have been done in the field of 3D
annotation, from the viewpoint of cartography or
virtual reality. In (Hartmann et al., 2004); (Ali et al.,
2005); (Gotzelmann et al., 2006) 3D annotations are
used to help industrial product design. Stein and
Decoret (2008) aims to improve the interactive
functions of 3D annotations. Havemann et al. (2009)
use 3D annotation to help the reconstruction process
of historical objects. These works mainly focus on
the annotation techniques for a single 3D object,
which seldom take into account the 3D urban
environment.
About placing annotations in 3D urban
environment, (Stefan and Döllner, 2006) (Stefan et
al., 2007) (Hagedorn et al., 2007) have separately
discussed the annotation placement strategies for
point features, line features, plane features and
volume features, more often aiming at the annotation
technique for a single object, such as where to place
the annotation around a certain object, while not
dealing lots of objects in a macroscopic view.
(Klimke and Döllner, 2010) allows user to add and
save script annotations in 3D urban environment to
improve urban planning process.
507
Zhang F., Tourre V. and Moreau G..
Semantic Visualization in 3D Urban Environment - Taking Text as an Example.
DOI: 10.5220/0004282805070510
In Proceedings of the International Conference on Computer Graphics Theory and Applications and International Conference on Information
Visualization Theory and Applications (IVAPP-2013), pages 507-510
ISBN: 978-989-8565-46-4
Copyright
c
2013 SCITEPRESS (Science and Technology Publications, Lda.)
3 PROBLEMS AND
LIMITATIONS
In most cases, annotated objects in 3D environment
can be divided into one of the feature types below:
a) 0D feature, in most cases refers to point features
that occupy a small spatial space while they are of
importance and cannot be ignored, such as a tree, a
control point, a bus stop, a tower or a single building,
depending on scale.
b) 1D feature, which often means line features. They
are objects that have spatial definitions in context of
length while the width is neglected, such as rivers,
roads, railways and border lines.
c) 2D feature, also known as plane features, which
takes the width of objects into consideration such as
squares, open spaces and water bodies.
d) 3D feature, also referenced as volume features,
are objects that cover a large space in the
environment such as icebergs, mountains, sky-
scrapers, large buildings and building groups.
The problems and limitations of current
annotation techniques can be summarized as:
a) No appropriate information density: information
density of annotations in 2D environment has been
tackled as annotation number maximization and size
maximization problem (Alexander, 1999). In 3D
environment, there is no such criterion.
b) Annotation readability and visibility are not
guaranteed: in 2D environment, camera position
does not influence the readability and visibility of
annotations. While in 3D scenes, occlusions,
overlaps occur frequently, which decrease the
readability and visibility of annotations.
c) Low annotation diversity: in existing use-cases of
3D annotation, annotations are treated the same way.
Human perception factors can be added to optimize
the annotation result.
4 POTENTIAL SOLUTIONS AND
PRIMARY TEST
4.1 Potential Solutions
In order to overcome limitations stated in section 3,
here are potential solutions:
a) Firstly, text will be treated as pure text. It aims to
place annotations that differ in size and colour and
compare the effects among them.
b) After successfully placing annotations, a proper
information density will be defined to ensure
information is neither overwhelmed nor too limited.
c) Then, an optimization of readability and visibility
is scheduled. The aesthetic layout of the annotations
is important for system users to acquire information.
Occlusions, low visibility annotations should be
avoided while guarantying readability.
d) Finally, annotation diversity is needed to
highlight important information to make the system
more user-centred and user-friendly.
4.2 Primary Test
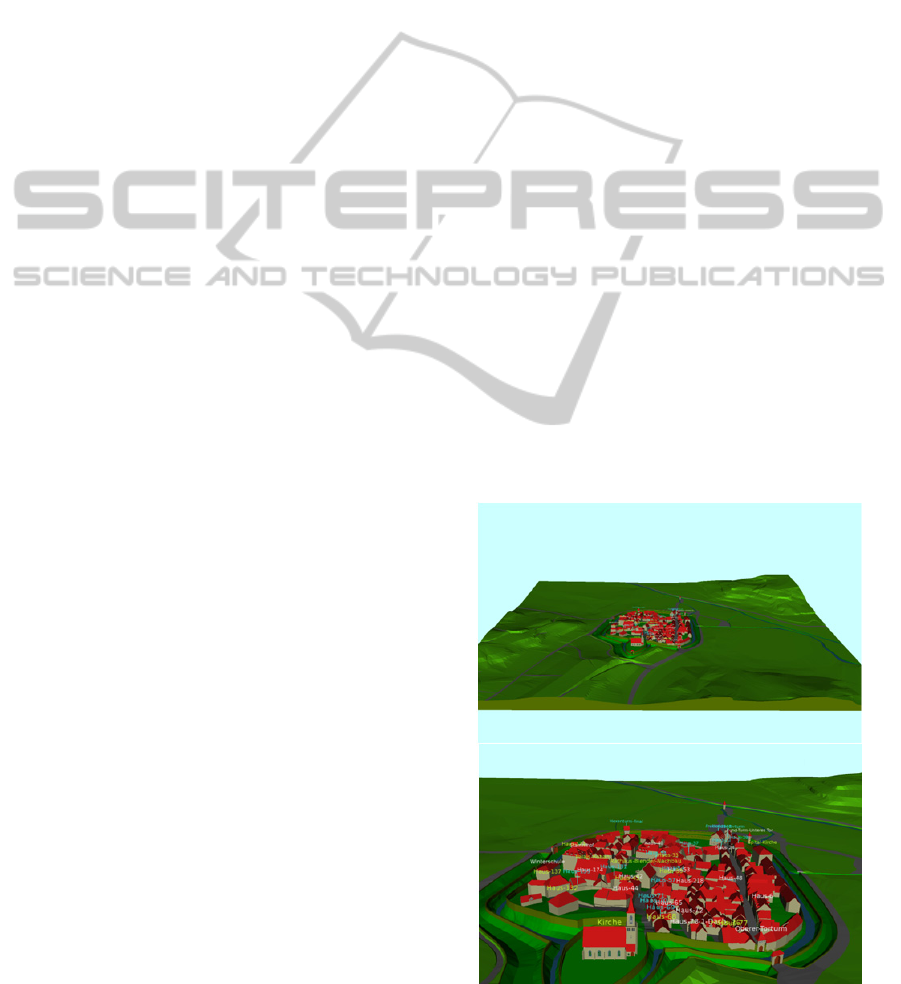
Having proposed potential solutions, we applied the
first solution in a primary implementation with
OpenSceneGraph(OSG), which directly supports
text visualization. The urban environment is built by
a CityGML dataset of Etteinheim, Germany.
Firstly, three types of text are placed:
a) Linking text: cyan text, which is set as always
facing the initial viewpoint. There is a line
connecting annotation and the annotated object;
b) Floating text: yellow text, which is set as always
facing the current viewpoint to maintain readability.
It floats on top of its annotated object;
c) Fading text: white text, which is set to disappear if
it is to be occluded by another fading text and to
appear if it is out of the occlusion scope.
The initialized annotation scene is illustrated in
Figure 1 below:
Figure1: Snapshot of the initialized scene graph.
IVAPP2013-InternationalConferenceonInformationVisualizationTheoryandApplications
508
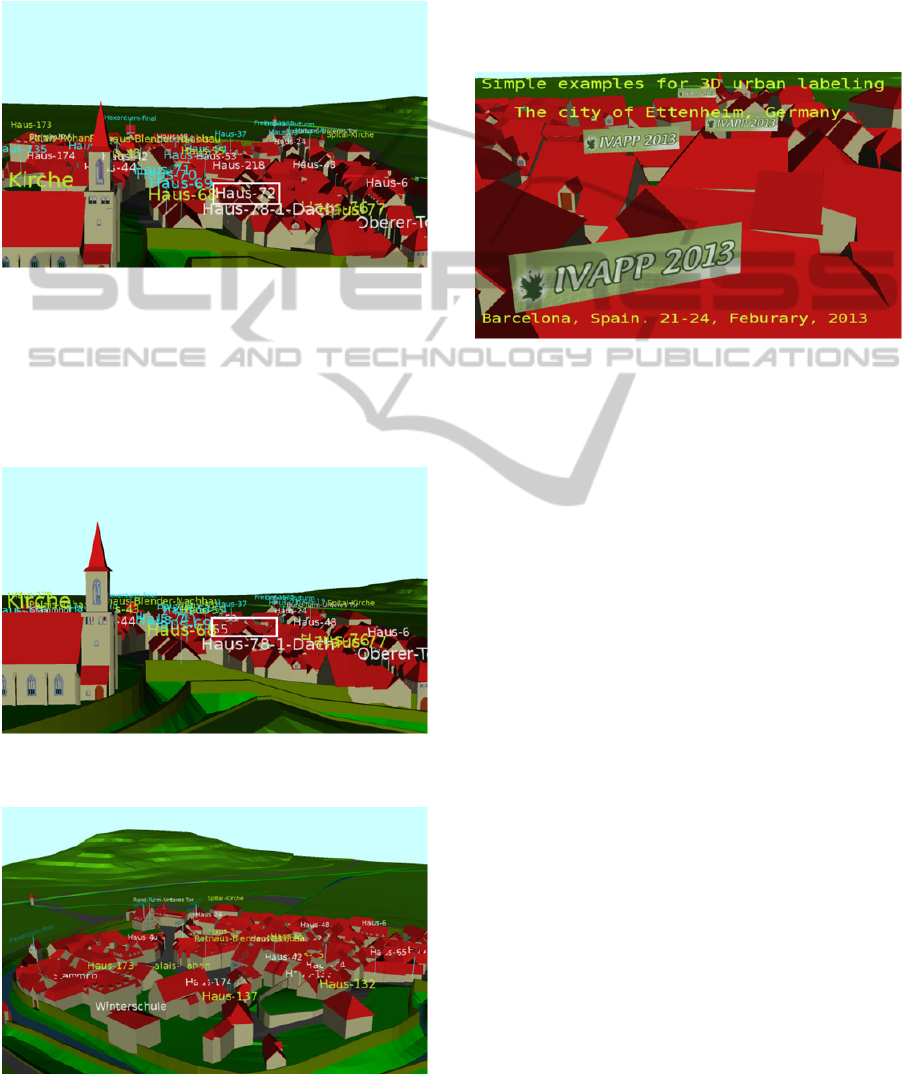
Let’s take'Haus-72' in the white rectangle as
example to compare performances among these
three types of annotations. Currently at this
viewpoint, occlusions of linking texts and floating
texts occur but not so much, and there’s no
occlusion among fading texts, as showed below:
Figure 2a: Viewpoint A for comparing performances of
different types of annotation.
As viewpoint changes, 'Haus-72' disappears as it
is occluded by'Haus-78-1-Dach', as showed in
Figure 2b. While there are too many occlusions
among the other two types of texts which make
annotations unreadable. Fading texts remain clear.
Figure 2b: As viewpoint changes, fading text adjust
themselves while the other two texts do not.
Figure 2c: Another viewpoint for the scene.
In Figure 2c above is another viewpoint of the scene
after a rotation around the scene. Floating text and
fading text still remain readable while linking text is
hard to recognize. In order to better simulate the real
3D world, annotations can be set as linking text but
readability can hardly be maintained.
Besides three texts described above, HUD
annotation and annotation with a text-container are
also placed as showed in Figure 3:
Figure 3: HUD annotation and annotation with a text
container are also placed.
Texts in yellow are HUD (Heading up display)
annotations which always stay as initialized to offer
essential information about the system. The most
important information of the system can be set as
HUD annotation. Finally, annotations can be added
as texture as using billboard as the text container.
5 DISCUSSION
Concerning fading texts, they allow users to see
what they want to see easily by changing
viewpoints. They adjust themselves to appear or not
according to the possibility of occlusion. If the user
wants to see some information of his interest, he
only needs to zoom and adjust the camera position
until he sees what he wants to see. So when there are
a lot of annotations to place, fading text can be chose
to annotate objects to avoid occlusions.
For linking texts, they maintain high relations
with annotated objects. But if there are too many
objects to annotate, linking lines will come across
with each other, which will make the scene
confusing. Hence linking text is applicable only
when there are a few annotated objects to annotate.
For floating texts, they are similar to fading texts,
but they will not avoid occlusions among
annotations. So when there is a medium-scale
dataset, floating text is preferred as it does not result
SemanticVisualizationin3DUrbanEnvironment-TakingTextasanExample
509

in confusing connecting lines as linking text does
while reducing the occlusion calculating time as
required by fading texts.
This primary strategy to choose annotation type
is dedicated to a general view. While for a single
object, the annotation method needs to be specified
accordingly. If annotations are placed on the space
of annotated objects, they are called internal
annotations. If not, they are external annotations
(Hagedorn et al., 2007). In general, for point
features, due to their limited space, external
annotations are preferred. For line features, both
external annotation and internal annotation can be
used. For small line features where the space is not
enough for embedding, external annotation is used.
When line features are big enough to contain
annotation, internal annotation is preferred. For
plane features and volume features, in most cases,
internal annotation is used. In real use-cases, things
are more complex.
The information displayed in a single frame is
limited, where an appropriate information density
needs to be defined. Dating back in 1970s, (Töpfer
and Pillewizer, 1966) set the primary guiding
principle for information density in 2D visualization:
Constraint Information Density, which requires the
number of objects per display unit should be
constant. Hence how to set a good information
density of our own case in 3D environment?
As (Ware, 2004) states that visualization is the
result how human beings perceive the world, hence
human perception factors such as colours, textures,
depths, lightness, brightness contrast and others,
play important roles in computer visualization. Here
how to take good advantage of human perception to
help users better find out the information they need?
Finally the evaluation of annotations is a difficult
problem too. How to define if an annotation result is
good or not? Using mathematic way to calculate
some factors such as occlusion ratio? Or should a
group of user test is needed?
6 CONCLUSIONS, FUTURE
WORK
In this paper, the problem of annotation in 3D
environment has been discussed. Challenges and
several potential solutions are proposed. Floating
text, linking text and fading text are tested. Unsolved
problems proposed in Section 5 will be tackled in
the future such as how to define the proper
information density. Then we will work to improve
readability and diversity of annotations. Besides
text, different kinds of annotation forms are
expected to express semantic information, such as
symbols or images. Then a formal evaluation with a
large number of user tests will be done. Finally we
will try to extend the applicability of our annotation
technique into other applications such as augmented
reality, 3D objects generalization and so on.
REFERENCES
Alexander, W., 1999. Automated annotation Placement in
Theory and Practice, PhD thesis, Freie Universitat
Berlin.
Ali, K., Hartmann, K. and Strothotte, T., 2005. Label
Layout for Interactive 3D Illustrations. Journal of
WSCG. 13(1), 1-8.
Gotzelmann, T., Hartmann, K. and Strothotte, T., 2006.
Agent-based annotation of interactive 3D
visualization. Proceedings of 6th International
Symposium on Smart Graphics. Springer LNCS, vol.
4073, 24-35.
Hartmann, K., Ali, K. and Strothotte, T., 2004. Floating
Labels : Applying Dynamic Potential Fields for Label
Layout. Proceedings of 4th International Symposium
on Smart Graphics. 101-113.
Havemann, S., Settgast, V. and Berndt, R., 2009. The
Arrigo Showcase Reloaded-Towards a Sustainable
Link Between 3D and Semantics. Journal on
Computing and Cultural Heritage, l2(1): 1-13.
Hagedorn, B., Maass, S. and Döllner, J., 2007. Chaining
Geo-information Services for the Visualization and
Annotation of 3D Geo-virtual Environments.
Proceedings of 4th International Symposium on LBS
and Tele-cartography, Hong Kong.
Klimke, J. and Döllner, J., 2010. Geospatial Annotations
for 3D Environments and their WFS-based
Implementation. Geospatial Thinking, 379-397.
Stefan, M. and Döllner, J., 2006. Dynamic Annotation of
Interactive Environments using Object-Integrated
Billboards. Proceedings of 14th International
Conference in Central Europe on Computer Graphics,
Visualization and Computer Vision, 327-334 .
Stefan, M., Markus, J. and Döllner, J., 2007. Depth Cue of
Occlusion Information as Criterion for the Quality of
Annotation Placement in Perspective Views. Lecture
Notes in Geoinformation and Cartography. Springer,
473-486.
Stein,T. and Decoret, X., 2008. Dynamic label placement
for improved interactive exploration. Proceedings of
International Symposium on Non-Photorealistic
Animation and Rendering, 15-21.
Töpfer, F. and Pillewizer, W., 1966. The Principles of
Selection, A Means of Cartographic
Generalization.Cartographic J., 3(1):10-16.
Ware, C., 2004. Information Visualization-Perception for
design. Morgan Kaufmann.
IVAPP2013-InternationalConferenceonInformationVisualizationTheoryandApplications
510
