
Suitable Optical Filter for Self-phase Modulation Regenerators
Gábor Fekete and Eszter Udvary
Broadband Infocommunications and Electromagnetic Theory, Budapest University of Technology and Economics,
Egry József utca 18. H-1111, Budapest, Hungary
Keywords: 2R, Nonlinearity, Optical Filter, Optical Regenerator, Reshaping, SPM.
Abstract: In this paper a 2R all-optical regenerator will be presented, which based on the nonlinear self-phase
modulation. The regenerator was simulated with the VPI TransmissionMaker and its optical filter module
was examining, because the optical filter is the main element of these types of regenerators.
1 INTRODUCTION
Long haul optical networks need regenerators
because of fibre attenuation and the dispersions.
Signal reshaping can be performed in the electrical
or optical domain, although the 3R (re-amplifying,
reshaping, retiming) regenerator exists only in the
electrical domain. Nonlinear effects in the optical
networks are usually the source of signal distortion,
but they are the bases of the all-optical regenerators’
reshaping mechanism. A nonlinear device can be a
nonlinear fibre or a semiconductor optical amplifier
(SOA). In this paper a 2R optical regenerator will be
introduced which will use the nonlinear self-phase
modulation (SPM) effect for reshaping. The
regenerator was simulated with the VPI Photonics
TransmissionMaker 8.7 (VPI) software. Increased
attention was given to the optical filter, because its
price can be high if special needs arise or special
parameters are required.
2 NONLINEAR PHASE
MODULATION
There are two types of nonlinear phase modulation:
self-phase modulation (SPM) and cross-phase
modulation (XPM). In the first case the signal’s own
intensity causes an additional phase modulation on
the signal, while in the second case the phase
modulation is caused by another signal’s intensity.
Nonlinear phase-modulation is based on the optical
Kerr-effect. The refractive index of the fibre core
changes as light propagates through on it. The value
of this change can be calculated (Ferreira, 2011)
with equation (1), where n
2
is the nonlinear index of
the fibre and I is the intensity of the propagating
light. This refractive index change causes different
propagation velocity which results different
propagation times, so the signal’s phase will
different at every point of the fibre. It seems that not
only the signal’s intensity was modulated, but its
phase too. In fact it was modulated only in its
intensity. The phase change can be calculated
(Ferreira, 2011) with equation (2), where i is the
channel number index. The first term on the right of
(2) represents the phase change due to SPM, while
the second term is the change caused by XPM. The
created regenerator in VPI was based on the SPM
effect.
Inn
2
(1)
ji
ji
i
2
i
)t(I2)t(I
Ln2
(2)
Figure 1: Spectral broadening caused by SPM. The blue
dash curve is a 2mW pulse’s spectrum without the effect
of SPM, while the green solid curves show the spectral
broadening effect on a 20, 100, 600mW (from inside to
outside) power pulse.
68
Fekete G. and Udvary E..
Suitable Optical Filter for Self-phase Modulation Regenerators.
DOI: 10.5220/0004275300680072
In Proceedings of the International Conference on Photonics, Optics and Laser Technology (PHOTOPTICS-2013), pages 68-72
ISBN: 978-989-8565-44-0
Copyright
c
2013 SCITEPRESS (Science and Technology Publications, Lda.)

Figure 2: Block diagram of the simulated SPM
regenerator. (a) Signal and (b) noise are in the time and
frequency domain. (Rochette, Fu, Ta’eed, Moss and
Eggleton, 2006).
SPM does not change the pulse shape in the time
domain. It just causes spectrum broadening in the
frequency domain. Higher intensity causes bigger
spectral broadening as reported in Figure 1. It was
simulated with the VPI and the SPM effect was
produced by the regenerator’s nonlinear fibre
section. The blue dash curve shows the spectrum of
a pulse with 2mW power after the fibre. In this case
the fibre’s nonlinearity was turned off. Then it was
turned on, but the effect of SPM was negligible, so it
is not observable. The green curves show how the
signal’s spectrum broadening at higher pulse power
levels.
3 WORKING PRINCIPLE
SPM regenerators consist of three elements: an
amplifier, a fibre and an optical band pass filter
(Figure 2). Use of a highly nonlinear fibre is
recommended, because of the higher nonlinear effect
and it needs less power to reach its nonlinear
behaviour. The optical amplifier can be a commonly
used EDFA (Erbium Doped Fibre Amplifier) or a
SOA. It has to amplify the signal at least to a
minimum power level, which needs for the effect of
SPM to start taking place. If we reach or exceed that
power, the signal’s spectrum will be broadening by
the SPM. The regenerator’s principle of operation
(Mamyshev
, 1998) can be seen on Figure 2. The
pulse’s intensities are much higher than the noise
level and the pulses have coherent phase, while the
noise does not. Their spectrums’ shapes are very
similar, but completely different in the time domain.
The nonlinearity of the fibre will broaden the
signal’s spectrum, but the noise spectrum will not
broaden, because its power is too low for any
noticeable broadening, as we saw in Figure 1. One
piece of the broadened spectrum has to fall into the
optical band pass filter’s bandwidth, otherwise only
noise is at the output of the regenerator. The
regenerator works properly, if the whole noise’s
spectrum is filtered out by the filter. Its centre
frequency is shifted away a little bit due to the noise.
This can be critical in the DWDM (Dense
Wavelength Division Multiplexing) systems, where
the wavelength accuracy is important.
4 SIMULATIONS
The transmitter produces 2mW high RZ (return to
zero) pulses at 193.1THz with a bit rate of 0.5Gbps.
Its bit sequence was set to an alternating stream. The
signal degradation was simulated with a white noise
block and an attenuator. The white noise was added
to the signal with a coupler which introduced an
additional attenuation of 3dB. The noise was
considered Gaussian-distributed and its spectral
power density was 10
-16
W/Hz. The attenuator was
placed after the coupler. It created an overall loss of
10dB. In the regenerator a black box amplifier was
used, because only the amplifier’s gain was
important in our investigation, not the amplifying
technique. Its gain was 30dB and it also added noise
to the signal. A standard single mode fibre was used
instead of a highly nonlinear fibre, because its price
is much lower, but we had to use higher intensity for
the nonlinear effect to appear and a longer fibre
span.
Figure 3: Block scheme of the simulated regenerator.
These two disadvantages can easily eliminate the
price benefit of the standard fibre. In the simulation
the fibre’s length was 80km, which is four times
longer, than an average dispersion compensating
fibre’s length which is used in networks. An optical
filter was placed at the output of the regenerator and
an analyzer connected to its output to monitor the
signal (Figure 3). Three filter types were simulated,
which had different kind of transfer function. The
1GHz wide spectrum is broadened to 5.5GHz using
SuitableOpticalFilterforSelf-phaseModulationRegenerators
69
these settings. The width of the spectrum was
measured between the -3dB points.
Figure 4: (a) Nearly closed eye diagram at the regenerator
input. (b) Output eye diagram is distorted by nonlinearity
and noise.
4.1 Ideal (Rectangular) Filter
In the simulation the filter’s attenuation in the stop
band was 80dB. Because of its ideal feature it was
used for examine the filter roles and the required
filter’s bandwidth. The filter’s bandwidth was set to
10GHz and its centre frequency was equal to the
signal’s frequency. The regenerator with these
properties works as a simple amplifier. However the
fibre produces a strong nonlinearity because of the
input power level. It distorts the output signal. The
filter filters out those noise components, which are
out of the broadened signal’s spectrum. This can
improve the signal quality if the noise is out of the
signal band (Figure 4).
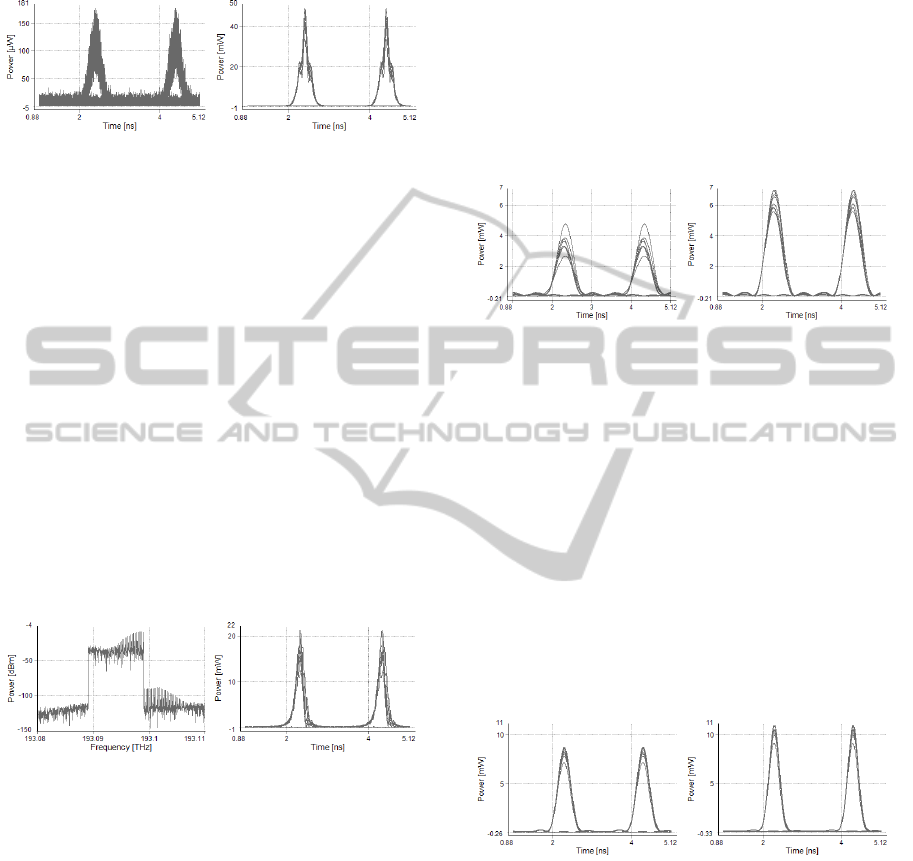
Figure 5: Spectrum and eye diagram at the filter’s output.
In the second case the filter centre frequency was
shifted by 6GHz to the 193.094THz, so that the
signal’s centre frequency was filtered out. The
filter’s other properties did not change. The result
can be seen on Figure 5. Half of the filtered signal is
part of the broadened signal and the other half of it is
the noise. The pulses fluctuated stronger and their
power decreased twofold compared to the previous
case (Figure 4). This simulation shows that the
filter’s pass band must contain only a part of the
broadened signal’s spectrum.
Final simulations with the rectangular filter were
carried out to find the optimal centre frequency and
bandwidth. One of the -3dB point was at
approximately 193.0972THz. This point and the
5.5GHz signal broadening rather limited our options.
There is no sense to use lower frequencies than the -
3dB point’s frequency because they are near to the
noise floor. The centre frequency of the filter was set
up to 193.097 and 193.098THz. The filter’s
bandwidth was 2GHz, because if it had been bigger,
we would have used the other half of the spectrum,
which contains the noise (Figure 2). The higher
centre frequency choice is better (Figure 6) because
of the higher output power. The fluctuations at the
high level are quite similar.
Figure 6: Eye diagrams at the output, when the filter’s
centre frequency was (a) 193.097THz and (b)
193.098THz. The bandwidths were same.
4.2 Trapezoid Filter
These filters are a better model to represent the real
filters because their slope is limited. In the
simulation the filter’s centre frequency was set to
193.098THz and its bandwidth was 2GHz. The
filter’s slope was 40 and 20dB/GHz. The eye
diagrams can be found in Figure 7. They are opened
eye and the fluctuations are approximately 1mW
high. When the filter’s slope was changed to
20dB/GHz the eye had a slightly larger fluctuation.
Figure 7: Eye diagrams after the filter when its slope was
(a) 40 and (b) 20dB/GHz.
4.3 Butterworth Filter
This is a real filter type, which has maximal flat
band pass. It has smaller slope between the pass
band and the stop band, than the trapezoid filter. Its
slope was about 5dB/GHz. The simulated filter was
second order filter and its centre frequency was also
set to 193.098THz with a bandwidth of 2GHz. The
spectrum at the regenerator’s output can be seen in
Figure 8. The eye diagram is opened, but it is
(a)
(a)
(b)
(b)
(a) (b)
PHOTOPTICS2013-InternationalConferenceonPhotonics,OpticsandLaserTechnology
70

moderately asymmetric. It shows that the edges from
high level to low level have a little bit smaller slope
at the end than the low to high edges. This time the
fluctuation was 2mW at the high level. It exceeds
the previous case’s result by 1mW. This
considerable change results from the filter’s smaller
slope which causes worse noise spectrum filtering.
Figure 8: The output spectrum and the eye diagram when a
second order Butterworth filter was used.
Figure 9: Eye diagrams at the output of the regenerator at
different filter’s stop band attenuation.
4.4 Attenuation at the Stop Band
The stop band attenuation is one of the critical
aspects of the filters. If it is too low, the filter will
not be sufficiently attenuating the disturbing
components, so the output signal will be distorted. In
this simulation the minimum stop band attenuation
was examined. A rectangular filter was used with
2GHz bandwidth with a centre frequency of
193.098THz. The filter’s stop band attenuation was
changing from 30 to 80dB with 10dB increments.
The eye diagrams are shown in Figure 9. At 30 and
40dB attenuation the filter can no adequately
suppress the disturbing components, so the signal
has a fast fluctuation at the high levels. Beside this
fast fluctuation the output signal also shows slow
changes. The pulses differ from each other by a
small proportion. There are not any significant
changes in the eye diagrams from the 50dB stop
band attenuation. The pulses at the output differ
from the others, but this difference has a maximum
of 1mW. There are no fast changes on the high
levels. In conclusion the output filter has to have at
least 50dB attenuation at the stop band and it needs
to reach this value as fast as it possible.
5 CONCLUSIONS
We demonstrated with simulations the nonlinear
SPM effect and how it can be used in optical
regenerators. The simulation showed that a standard
fibre can be used instead of a highly nonlinear fibre.
Using a standard fibre the spectrum broadening will
be smaller or the signal’s power has to be higher at
the nonlinear device’s input to get the same
spectrum broadening. The regenerated signal’s
quality mainly depends on the filter. The signal
frequency must be shifted away to get right
regeneration. The signal regeneration depends on the
filter’s slope too. Higher filter’s slope gives better
signal reshaping as we showed. We also presented
that the signal’s shape do not improve if the stop
band attenuation of the filter is higher than 50dB.
All in all the applied filter’s pass band has to be out
of the range of the input noisy signal’s spectrum, but
inside of the broadened spectrum. That part of
broadened spectrum should be selected practically
where the signal’s power is maximal. The filter has
to attenuate 50dB out of the pass band and the slope
between the pass band and stop band has to be as
high as possible.
ACKNOWLEDGEMENTS
The authors acknowledge the Hungarian National
Research Foundation (OTKA) project No. CK
77997 and the Ericsson Hungary for funding their
research.
REFERENCES
Mário F. S. Ferreira, 2011. Nonlinear effects in optical
fibers, John Wiley & Sons, Inc., Hoboken, New Jersey
Masayuki Matsumoto, 2004. Performance Analysis and
Comparison of Optical 3R Regenerators Utilizing
Self-Phase Modulation in Fibers, IEEE.
Martin Rochette, Libin Fu, Vahid Ta’eed, David J. Moss,
Benjamin J. Eggleton, 2006. 2R Optical Regeneration:
An All-Optical Solution for BER Improvement, IEEE
P. V. Mamyshev, 1998. All-optical data regeneration
based on self-phase modulation effect, ECOC’98.
SuitableOpticalFilterforSelf-phaseModulationRegenerators
71

L. B. Fu, M. Rochette, V. G. Ta’eed, D. J. Moss, B. J.
Eggleton, 2005. Investigation of self-phase modulation
based optical regeneration in single mode As2Se3
chalcogenide glass fiber, OPTIC EXPRESS Vol. 13,
No.19.
T. Berceli and P. Herczfeld, 2010. Microwave Photonics—
A Historical Perspective, IEEE Trans. on Microwave
Theory and Techniques, Vol. 58, No.11, pp. 2992-
3000.
PHOTOPTICS2013-InternationalConferenceonPhotonics,OpticsandLaserTechnology
72
